NATIONAL FOOD
LIVSMEDELS
VERKET
Rapport 8 - 2013
Foto:
Karin Jacobsson
by Laurence Nachin, Christina Normark, Irina Boriak and Ingela Tillander
Proficiency testing
Food Microbiology
Internal and external control for microbiological analyses of food and drinking
water
All analytical activities require work of a high standard that is accurately documented.
For this purpose, most laboratories carry out some form of internal quality assurance,
but their analytical work also has to be evaluated by an independent party. Such external
quality control of laboratory competence is commonly required by accreditation
bodies
and can be done by taking part in proficiency testing (PT).
In a proficiency test, identical test material is analysed by a number of laboratories
using their routine methods. The organiser evaluates the results and compiles them in a
report.
The National Food Agency’s PT program offers
External and independent evaluation of laboratories analytical competence.
Improved knowledge of analytical methods used by laboratories with respect to
various types of organisms.
Expert support
Tool for inspections regarding accreditation.
Free extra material for follow-up analyses
For more information visit our website:
www.slv.se/absint
The National Food Agency’s reference material
As a complement to the proficiency testing, National Food Agency also produces
reference material (RM) for internal quality control: a total of 7 RM for food and
drinking water microbiological analyses, including pathogens, are available.
Information available on our website:
www.slv.se/RM-micro
Edition
Version 1 (2013-05-30)
Editor in chief
Annika Rimland, Head of Science Department, National Food Agency
Responsible for the scheme
Laurence Nachin, Microbiologist, Microbiology Division, National Food Agency
PT April 2013 is registered as no. 992/2013 at the National Food Agency, Uppsala.
Proficiency Testing
Microbiology – Food
April 2013
Quantitative analyses
• Aerobic microorganisms, 30 °C
• Psychrotrophs
• Enterobacteriaceae
• Escherichia coli
• Presumptive Bacillus cereus
• Coagulase positive staphylococci
• Lactic acid bacteria
• Clostridium perfringens
• Anaerobic sulphite-reducing bacteria
• Aerobic microorganisms in fish products, 20-25 ºC
• H
2
S producing bacteria in fish products
• Yeasts
• Moulds
Laurence Nachin, Christina Normark, Irina Boriak, Ingela Tillander
Abbreviations
Media
BA
Blood agar
BcS
Bacillus cereus Selective agar
BP
Baird-Parker agar
BP
+RPF
Baird-Parker agar with
Rabbit Plasma Fibrinogen
Chrom .
Chromogenic medium
DG 18
Dichloran Glycerol agar
DRBC
Dichloran Rose Bengal Chloramphenicol agar
IA
Iron agar
ISA
Iron sulphite agar
MPCA
Milk Plate Count agar
MRS
de Man, Rogosa and Sharpe agar
MRS-aB
de Man, Rogosa and Sharpe agar with amphotericin
MRS-S
de Man, Rogosa and Sharpe agar with sorbic acid
MYP
Mannitol Egg Yolk Polymyxin agar / Mossel agar
OGYE
Oxytetracycline Glucose Yeast Extract agar
P
Polymyxin B
PCA
Plate Count Agar
SFP
Shahidi Ferguson perfringens agar base
TBX
Tryptone Bile X-glucuronide agar
TGE
Tryptone Glucose Extract agar
TSA
Trypticase Soy Agar
TSC
Tryptose Sulphite Cycloserine agar
VRB
Violet Red Bile agar
VRBG
Violet Red Bile Glucose agar
YGC
Yeast extract Glucose Chloramphenicol agar
Organisations
EN
European standard from the Comité Européen de Normalisation (CEN)
ISO
International Organization for Standardization
NMKL
Nordic Committee for Food Analyses
Contents
General information on results evaluation... 4
Results of the PT round April 2013 ... 5
- General outcome ... 5
- Aerobic microorganisms, 30°C... 6
- Psychrotrophic microorganisms ... 7
- Enterobacteriaceae ... 8
- Escherichia coli ... 9
- Presumptive Bacillus cereus ... 10
- Coagulase positive staphylococci ... 11
- Lactic acid bacteria ... 12
- Clostridium perfringens.. ... 13
- Anaerobic sulphite-reducing bacteria ... 13
- Aerobic microorganisms in fish products, 20-25 ºC ... 14
- H
2
S producing bacteria in fish products ... 14
- Yeasts ... 15
- Moulds ... 15
Outcome of the results of individual laboratory – assessment ... 17
- Box plot ... 18
Test material and quality control ... 24
- Test material ... 24
- Quality control of the mixtures ... 25
References ... 26
Annex 1: Results obtained by the participants
General information on results evaluation
Statistical evaluation of the results
Highly deviating values that did not belong to a strictly normal distribution were
identified as statistical outliers (Grubbs’ test modified by Kelly) (1). In some cases,
subjective adjustments were made to set limits, based on knowledge of the mixture’s
contents. Outliers and false results were not included in the calculations of means and
standard deviations. Results reported as “>value” were excluded from the evaluation.
Results reported as “<value” were interpreted as being zero (negative result). All
reported results are presented in Annex 1.
According to EN ISO/IEC 17043, for which the proficiency testing programme
organised by the National Food Agency is accredited since early 2012, it is mandatory
for the participating laboratories to give method information for all analyses for which
they report results. Method information is sometimes difficult to interpret, e.g. many
laboratories choose a medium that differs from that in the reported standard methods.
Therefore, in the following section, results have been grouped according to the method
or the medium used to perform the analysis.
Uncertainty of measurement for the assigned values
The uncertainty of measurement for an assigned value is calculated as the standard
deviation divided by the square root of the number of correct results (”standard error”).
The assigned value of evaluated parameters is the mean value.
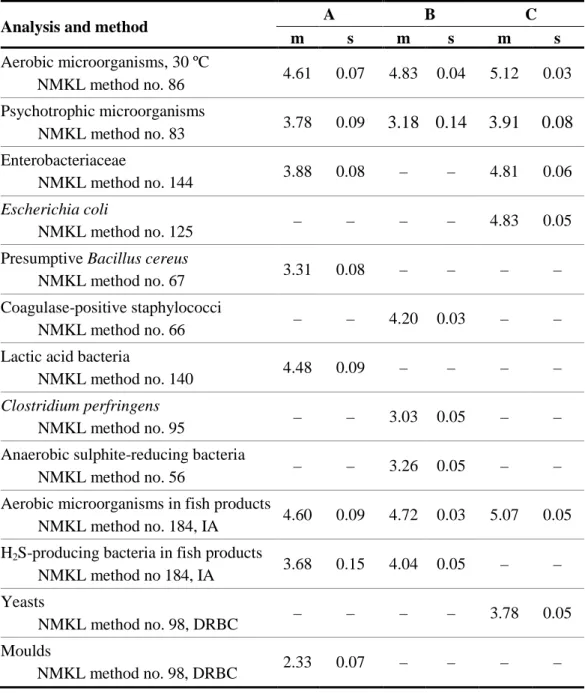
Tables and figures legend
Tables (not Table 1)
n
number of laboratory that performed the analysis
m
results mean value in log10 cfu/ml (false results and outliers excluded)
s
results standard deviation
F
number of false positive or false negative results
<
number of low outliers
>
number of high outliers
global results for the analysis
values discussed in the text
Figures
Histograms of all analytical results obtained for each mixture are presented. The mean value of
the analysis results is indicated in each histogram.
values within the interval of acceptance (Annex 1)
outliers
false negative results
Results of the PT round April 2013
General outcome
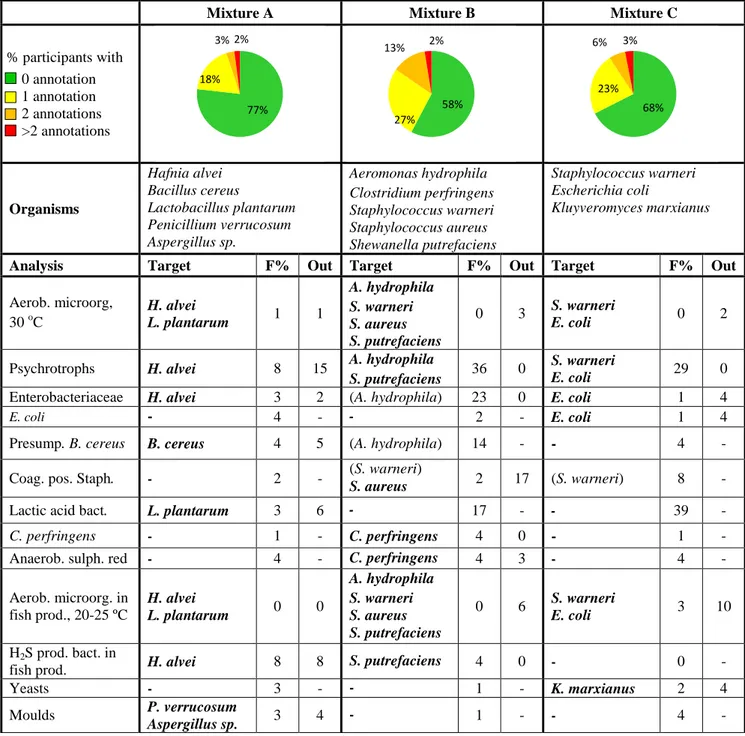
Samples were sent to 202 laboratories, 46 in Sweden, 139 in other European countries,
and 17 outside Europe. 194 laboratories reported results, 110 (57 %) provided at least
one result that received an annotation. In the previous round (April 2012) with similar
analyses, the proportion was 53 %.
Individual results for each analysis of the PT round are listed in Annex 1 and are also
available on the website after logging in:
www.slv.se/absint/index.aspx
.
Table 1 Microorganisms in each mixture and % of deviating results (F%: false positive
or false negative, Out: outliers).
Mixture A
Mixture B
Mixture C
% participants with
0 annotation
1 annotation
2 annotations
>2 annotations
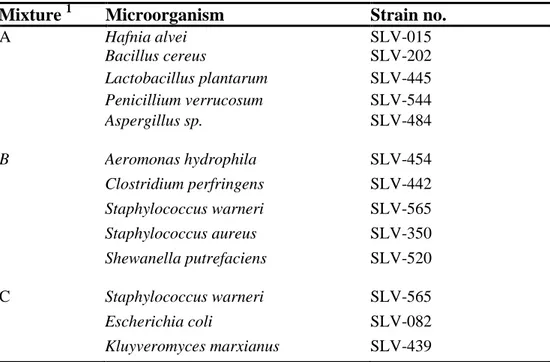
Organisms
Hafnia alvei
Bacillus cereus
Lactobacillus plantarum
Penicillium verrucosum
Aspergillus sp.
Aeromonas hydrophila
Clostridium perfringens
Staphylococcus warneri
Staphylococcus aureus
Shewanella putrefaciens
Staphylococcus warneri
Escherichia coli
Kluyveromyces marxianus
Analysis
Target
F%
Out Target
F%
Out Target
F%
Out
Aerob. microorg,
30
oC
H. alvei
L. plantarum
1
1
A. hydrophila
S. warneri
S. aureus
S. putrefaciens
0
3
S. warneri
E. coli
0
2
Psychrotrophs
H. alvei
8
15
A. hydrophila
S. putrefaciens
36
0
S. warneri
E. coli
29
0
Enterobacteriaceae
H. alvei
3
2
(A. hydrophila)
23
0
E. coli
1
4
E. coli
-
4
-
-
2
-
E. coli
1
4
Presump. B. cereus
B. cereus
4
5
(A. hydrophila)
14
-
-
4
-
Coag. pos. Staph.
-
2
-
(S. warneri)
S. aureus
2
17
(S. warneri)
8
-
Lactic acid bact.
L. plantarum
3
6
-
17
-
-
39
-
C. perfringens
-
1
-
C. perfringens
4
0
-
1
-
Anaerob. sulph. red
-
4
-
C. perfringens
4
3
-
4
-
Aerob. microorg. in
fish prod., 20-25 ºC
H. alvei
L. plantarum
0
0
A. hydrophila
S. warneri
S. aureus
S. putrefaciens
0
6
S. warneri
E. coli
3
10
H
2S prod. bact. in
fish prod.
H. alvei
8
8
S. putrefaciens
4
0
-
0
-
Yeasts
-
3
-
-
1
-
K. marxianus
2
4
Moulds
P. verrucosum
Aspergillus sp.
3
4
-
1
-
-
4
-
- : no target organism or no value; (microorganism): false positive
77%
18%
3% 2%
58%
27%
13%
2%
68%
23%
6% 3%
Aerobic microorganisms, 30 °C
Mixture A
The colonies counted were mainly from Lactobacillus plantarum and Hafnia alvei
present at the highest concentration in the mixture.
Mixture B
Colonies of Aeromonas hydrophila, Shewanella putrefaciens, Staphylococcus warneri
and Staphylococcus aureus were counted for this analysis.
Mixture C
Staphylococcus warneri and Escherichia coli were present at the highest concentration
in mixture C and therefore formed the colonies counted for the analysis.
Results of aerobic microorganisms analysis
Medium
Mixture A
Mixture B
Mixture C
n
m
s
F < >
n
m
s
F < >
n
m
s
F < >
Total
176
4.38 0.24 1 0 1 176
4.78 0.15 0 4 2 177
5.06 0.14 0 1 3
PCA
103
4.39 0.23 0 0 1 103
4.75 0.16 0 4 2 104
5.05 0.14 0 1 3
Petrifilm
™31
4.32 0.33 1 0 0
31
4.85 0.10 0 0 0
31
5.08 0.13 0 0 0
MPCA
20
4.40 0.20 0 0 0
20
4.81 0.08 0 0 0
20
5.07 0.10 0 0 0
TSA
11
4.43 0.15 0 0 0
11
4.80 0.12 0 0 0
11
5.06 0.13 0 0 0
A
A
B
B
C
C
For the three mixtures, there is no obvious difference in results depending on the
medium chosen. However, the results for mixture A were globally more spread, with a
0 15 30 45 60 2 2,5 3 3,5 4 4,5 5 5,5 6
log10 CFU per ml
4,4 ↓ N o o f r e s u lts * 0 15 30 45 60 2 2,5 3 3,5 4 4,5 5 5,5 6 PCA Petrifilm MPCA TSA N o o f r e s u lts
log10 CFU per ml
* 0 20 40 60 80 2 2,5 3 3,5 4 4,5 5 5,5 6
log10 CFU per ml
4,8 ↓ N o o f r e s u lts 0 20 40 60 80 2 2,5 3 3,5 4 4,5 5 5,5 6 PCA Petrifilm MPCA TSA N o o f r e s u lts
log10 CFU per ml
0 20 40 60 80 2 2,5 3 3,5 4 4,5 5 5,5 6
log10 CFU per ml
5,1 ↓ N o o f r e s u lts * 0 20 40 60 80 2 2,5 3 3,5 4 4,5 5 5,5 6 PCA Petrifilm MPCA TSA N o o f r e s u lts log 10 CFU per ml *
Psychrotrophic microorganisms
Mixture A
Hafnia alvei was target-organism of the analysis. At NFA, the other strains present in
mixture A did not form colonies on PCA after 10 days of incubation at 6.5 °C (NMKL
86:2006).
Mixture B
Aeromonas hydrophila and Shewanella putrefaciens can grow at low temperature.
However, after 10 days at 6.5 °C colonies were very small and difficult to count without
magnifier.
Mixture C
The optimal growth temperature of Staphylococcus warneri and Escherichia coli
present in mixture C is 30-37 °C. At lower temperature these strains grow slower and, at
NFA, after 10 days of incubation at 6.5 °C they formed very small colonies difficult to
see without magnifier.
Results of psychrotrophic microorganisms analysis
T °C
Mixture A
Mixture B
Mixture C
n
m
s
F < >
n
m
s
F < >
n
m
s
F < >
Total
13
3.50 0.10 1 0 2
14
3.17 0.71 5 0 0
14
4.11 0.64 4 0 0
6.5
6
3.48 0.08 1 0 0
6
3.17 0.66 3 0 0
6
3.60 0.07 3 0 0
>6.5
7
3.52 0.13 0 0 2
8
3.17 0.80 2 0 0
8
4.34 0.65 1 0 0
A
A
B
B
C
C
0 1 2 3 4 5 2 2,5 3 3,5 4 4,5 5 5,5 6log10 CFU per ml
3,5 ↓ N o o f r e s u lts * 0 1 2 3 4 5 2 2,5 3 3,5 4 4,5 5 5,5 6 6,5 >6,5 N o o f r e s u lts
log10 CFU per ml
* 0 1 2 3 4 5 6 2 2,5 3 3,5 4 4,5 5 5,5 6
log10 CFU per ml
3,2 ↓ N o o f r e s u lts * 0 1 2 3 4 5 6 2 2,5 3 3,5 4 4,5 5 5,5 6 6,5 >6,5 N o o f r e s u lts
log10 CFU per ml
* 0 1 2 3 4 5 6 2 2,5 3 3,5 4 4,5 5 5,5 6
log10 CFU per ml
4,1 ↓ N o o f r e s u lts * 0 1 2 3 4 5 6 2 2,5 3 3,5 4 4,5 5 5,5 6 6,5 >6,5 N o o f r e s u lts
log10 CFU per ml
Only 14 laboratories performed this analysis, most of them used PCA as medium but
different temperature and time of incubation: 6.5°C / 10 days (NMKL 86:2006), 17°C /
20h + 7°C/ 3 days (NMKL 74:2000), or 21°C / 24h (ISO 8552:2004). This raises the
question of the definition of psychrotrophic microorganisms but explains the wide
distribution of the results for the three mixtures. Nevertheless, some trends can be seen:
at higher temperature of incubation, microorganisms present in the mixture grow faster
and might form bigger colonies easier to enumerate. This is reflected by higher values
obtained with incubation temperature higher than 6.5°C (mixture C) and the high
percentage of false negative results reported by laboratories that incubate plates at 6.5°C
during 10 days (mixtures B and C).
Enterobacteriaceae
Mixture A
Hafnia alvei was target-organism for this analysis.
Mixture B
There was no target-organism for this analysis. However, 34 false positive results were
reported. Aeromonas hydrophila formed red colonies on VRBG but is oxidase-positive
and therefore differentiates from enterobacteriaceae.
Mixture C
E. coli was target-organism for this analysis.
Results of Enterobacteriaceae analysis
Medium
Mixture A
Mixture B
Mixture C
n
m
s
F
< >
n
m s
F
< >
n
m
s
F
<
>
Total
149
3.54 0.16
4
0 3 150
- - 34 - -
152
4.67 0.23
2
5
1
VRBG
115
3.55 0.16
3
0 3 116
- - 18 - -
118
4.65 0.23
2
5
1
Petrifilm
™28
3.44 0.13
1
0 0
28
- - 13 - -
28
4.74 0.16
0
0
0
A
A
C
C
0 20 40 60 2 2,5 3 3,5 4 4,5 5 5,5 6log10 CFU per ml
3,6 ↓ N o o f r e s u lts * 0 20 40 60 2 2,5 3 3,5 4 4,5 5 5,5 6 VRBG Petrifilm N o o f r e s u lts
log10 CFU per ml
* 0 10 20 30 40 50 2 2,5 3 3,5 4 4,5 5 5,5 6
log10 CFU per ml
4,7 ↓ N o o f r e s u lts * 0 10 20 30 40 50 2 2,5 3 3,5 4 4,5 5 5,5 6 VRBG Petrifilm N o o f r e s u lts
log10 CFU per ml
Most of the laboratories used VRBG or Petrifilm™ as medium and similar average
results were obtained. For mixture C, many lower values were reported, linked to the
use of VRBG. It is possible that the indicator dye present in Petrifilm™ facilitated the
reading of colonies for mixture C. On the other hand, half of the laboratories that used
Petrifilm™, reported a false positive result for mixture B, indicating that A. hydrophila
could easily be misjudged as enterobacteriaceae using this medium if no confirmation
test was further performed.
Escherichia coli
Mixture A
Even though mixture A did not contain any strain of Escherichia coli, six laboratories
reported a false positive result. Among them, four used an incubation temperature below
44 °C and did not perform any confirmation.
Mixture B
There was no target-organism for this analysis.
Mixture C
Escherichia coli was target-organism for this analysis.
Results of E. coli analysis
Medium
Mixture A
Mixture B
Mixture C
n
m
s
F
< >
n
m
s F < >
n
m
s
F < >
Total
141
-
-
6
- -
141
-
- 3 - -
142
4.70 0.25 1 4 1
Petrifilm
™EC/CC
29
-
-
2
- -
29
-
- 0 - -
30
4.72 0.21 1 0 0
Petrifilm
™SEC
18
-
-
0
- -
18
-
- 1 - -
18
4.69 0.26 0 0 0
TBX
22
-
-
0
- -
23
-
- 0 - -
23
4.60 0.22 0 1 0
TSA/VRB
24
-
-
1
- -
23
-
- 0 - -
24
4.77 0.29 0 0 0
VRB
17
-
-
2
- -
17
-
- 1 - -
17
4.69 0.20 1 0 0
MPN-based
8
-
-
0
- -
8
-
- 0 - -
8
4.70 0.47 0 1 0
C
C
For mixture C, the results distribution is very similar to the one of enterobacteriaceae
analysis where E. coli also was target-organism: many low results were reported, but no
correlation with the use of a medium can be seen.
0 10 20 30 40 2 2,5 3 3,5 4 4,5 5 5,5 6
log10 CFU per ml
4,7 ↓ N o o f r e s u lts * 0 10 20 30 40 2 2,5 3 3,5 4 4,5 5 5,5 6 Petrifilm EC/CC Petrifilm SEC TBX TSA / VRB VRB N o o f r e s u lts
log10 CFU per ml
Presumptive Bacillus cereus
Mixture A
A strain belonging to the Bacillus cereus group was target-organism for this analysis.
Mixture B
There was no target-organism for this analysis. On blood-agar, some atypical colonies
were surrounded by a haemolytic zone on BcS agar. At NFA, Aeromonas hydrophila
formed light blue colonies without precipitation zone, while a few laboratories reported
the presence of colonies with such zone on their plates. This can explain the report of 19
false positive results.
Mixture C
The mixture C did not contain any target-organism for this analysis.
Results of presumptive B. cereus analysis
Medium
Mixture A
Mixture B
Mixture C
n
m
s
F
<
>
n
m s
F
< >
n
m s
F < >
Total
136
3.17 0.21
5
2
5
136
-
-
19 - -
136
-
-
5 - -
BA+BcS
34
3.22 0.17
0
0
0
34
-
-
3
- -
34
-
-
0 - -
BA+MYP
25
3.22 0.23
1
0
1
25
-
-
1
- -
25
-
-
2 - -
MYP
19
3.12 0.19
0
0
0
19
-
-
1
- -
19
-
-
1 - -
BA
17
3.04 0.16
2
1
2
17
-
-
7
- -
17
-
-
1 - -
BA+P
6
3.29 0.22
0
0
1
6
-
-
4
- -
6
-
-
0 - -
Chrom.
9
3.16 0.15
0
1
0
9
-
-
0
- -
9
-
-
0 - -
A
A
No correlation between results and medium can be seen for the analysis of mixture A
and C. For mixture B, almost 60% of the false positive results were reported by
laboratories that used blood-agar with or without polymyxin as only medium. The
NMKL method no 67:2010 describes the confirmation of suspected colonies from
blood-agar plates on BcS agar or Cereus-Ident-Agar (chromogenic medium).
0 10 20 30
1 1,5 2 2,5 3 3,5 4 4,5 5
log10 CFU per ml
3,2 ↓ N o o f r e s u lts * 0 10 20 30 1 1,5 2 2,5 3 3,5 4 4,5 5 BA+BcS BA+MYP MYP BA BA+P Chrom N o o f r e s u lts
log10 CFU per ml
Coagulase-positive Staphylococci
Mixture A
Mixture A did not contain any coagulase-positive strain of staphylococci.
Mixture B
A strain of Staphylococcus warneri and Staphylococcus aureus were included in the
mixture. Only the latter was target-organism for this analysis. At NFA, colonies of S.
warneri were atypical, without precipitation zone, on Baird-Parker with rabbit plasma
fribrinogen. On BP-agar, they were smaller than those of S. aureus and negative when
further tested for coagulase activity. Twelve laboratories reported high outliers that can
result from the counting of colonies of both strains.
Mixture C
The mixture did not contain any coagulase-positive strain of staphylococci, but a strain
of Staphylococcus warneri. Ten laboratories reported a false positive result. Among
them, five had also reported a result identified as high outlier for mixture B. This
suggests that colonies of S. warneri were misjudged as coagulase-positive staphylococci
in both cases.
Results of coagulase-positive Staphylococci analysis
Medium
Mixture A
Mixture B
Mixture C
n
m
s
F < >
n
m
s
F < >
n
m
s
F
< >
Total
125
-
-
2 - -
126
4.12 0.16 3 9 12
125
-
-
10
- -
BP
78
-
-
2 - -
79
4.13 0.16 1 5 12
77
-
-
9
- -
BP+RPF
25
-
-
0 - -
25
4.18 0.13 0 1
0
26
-
-
0
- -
Petrifilm
™14
-
-
0 - -
14
4.01 0.06 1 2
0
14
-
-
1
- -
B
B
Almost all high outliers results of mixture B and false positive results of mixture C were
linked to the use of BP-agar. On this medium, the coagulase reaction is not tested and
colonies of S. warneri can be misjudged as coagulase-positive staphylococci. However,
almost all laboratories that used BP-agar performed a confirmation step, which suggests
that only S. aureus colonies were confirmed (mixture B) and/or that the confirmation
test failed (mixture B/C). Results of mixture B obtained with Petrifilm™ were slightly
lower than the total average. In this case, colonies were counted after 1 day of
incubation instead of 2 days when using traditional plates. This could lead to smaller
colonies, increasing the difficulty of enumeration and resulting in a lower amount of
counted colonies.
0 10 20 30 40 2 2,5 3 3,5 4 4,5 5 5,5 6 log 10 CFU per ml 4,1 ↓ N o o f r e s u lts * 0 10 20 30 40 2 2,5 3 3,5 4 4,5 5 5,5 6 BP BP+RPF Petrifilm N o o f r e s u lts log 10 CFU per ml *Lactic acid bacteria
Mixture A
A strain of Lactobacillus plantarum was target-organism for this analysis.
Mixture B
There was no target-organism for this analysis, but as in previous rounds, many
laboratories reported a false positive result. Both Staphylococcus warneri and
Staphylococcus aureus can form small colonies on MRS and pinpoint colonies on
MRS-aB. Lactic acid bacteria grow well on MRS-aB, forming white or grey colonies
with a diameter of 1,5 ±0,5 mm after 5 days of incubation at 25° C in anaerobiosis.
Mixture C
The mixture did not contain any lactic acid bacteria. Almost 40 % of the laboratories
reported a false positive result corresponding to the concentration of Staphylococcus
warneri present in the mixture. S. warneri can indeed form small colonies on MRS and
even smaller on MRS-aB.
Results of lactic acid bacteria analysis
Medium
Mixture A
Mixture B
Mixture C
n
m
s
F <
>
n
m
s
F
< >
n
m s
F
< >
Total
70 4.38 0.14
2
4
0
69
-
-
12 -
-
69
-
-
27
- -
MRS
40 4.38 0.13
1
3
0
40
-
-
7
-
-
40
-
-
18
- -
MRS-S
10 4.35 0.14
0
0
0
9
-
-
1
-
-
9
-
-
1
- -
MRS-aB
9
4.36 0.14
0
1
0
9
-
-
3
-
-
9
-
-
5
- -
Rogosa
7
4.37 0.18
0
0
0
7
-
-
0
-
-
7
-
-
2
- -
A
A
The enumeration of L. plantarum in mixture A did not cause any difficulties and all
media led to similar results. For the analysis of mixture B and mixture C, one fifth and
half of the laboratories using MRS or MRS-aB reported a false positive result,
respectively. This suggests that these two media might be less selective than MRS-S
and allow the growth of the microorganisms present in the mixtures.
0 10 20 30
2 2,5 3 3,5 4 4,5 5 5,5 6
log10 CFU per ml
4,4 ↓ N o o f r e s u lts * 0 10 20 30 2 2,5 3 3,5 4 4,5 5 5,5 6 MRS MRS-S MRS-aB Rogosa N o o f r e s u lts
log10 CFU per ml
Clostridium perfringens and anaerobic sulphite-reducing bacteria
Mixture A
The mixture did not contain any target-organism for these analyses.
Mixture B
A strain of Clostridium perfringens was target-organism for both analyses
Mixture C
The mixture did not contain any target-organism for these analyses.
Results of C. perfringens analysis
Medium / Method
Mixture A
Mixture B
Mixture C
n
m
s
F < > n
m
s
F < >
n
m s F < >
Total
70
-
-
1 - - 70 3.11 0.22 3 0
0
70 - - 1 - -
TSC
61
-
-
1 - - 91 3.11 0.23 3 0
0
61 - - 1 - -
NMKL 95:2009
40
-
-
0 - - 40 3.13 0.20 1 0
0
40 - - 1 - -
EN ISO 7937:2004
19
-
-
0 - - 19 3.04 0.28 1 0
0
19 - - 0 - -
B
B
Results of anaerobic sulphite-reducing bacteria analysis
Medium
Mixture A
Mixture B
Mixture C
n
m
s
F
< > n
m
s
F < >
n
m s F < >
Total
72
-
-
3
- - 72 3.13 0.22 3 2
0
73 - - 3 - -
ISA
38
-
-
1
- - 37 3.10 0.20 1 1
0
38 - - 0 - -
TSC
14
-
-
0
- - 14 3.13 0.16 1 0
0
14 - - 0 - -
SFP/TSC agar base
19
-
-
2
- - 19 3.22 0.22 1 1
0
19 - - 3 - -
B
B
These analyses did not cause any difficulties and results for mixture B are
approximately the same independently of the method used. For the analysis of C.
perfringens, almost all laboratories used TSC medium, and the method NMKL 95:2009
or EN ISO 7937:2004. The first method describes an incubation at 37 °C for 24h, while
the second at 35 or 37 °C for 20h. This could be the reason for the slight difference of
results between the two methods. For the analysis of anaerobic sulphite-reducing
bacteria, slightly higher results were obtained with the use of SFP/TSC agar base. It has
0 5 10 15 20 1 1,5 2 2,5 3 3,5 4 4,5 5
log10 CFU per ml
3,1 ↓ N o o f r e s u lts * 0 10 20 30 1 1,5 2 2,5 3 3,5 4 4,5 5 TSC NMKL ISO N o o f r e s u lts
log10 CFU per ml
* 0 5 10 15 20 1 1,5 2 2,5 3 3,5 4 4,5 5
log10 CFU per ml
3,1 ↓ N o o f r e s u lts * 0 5 10 15 20 1 1,5 2 2,5 3 3,5 4 4,5 5 ISA TSC Agar base N o o f r e s u lts log 10 CFU per ml *
been shown that SFP agar is less selective than TSC agar but also allows a slightly
higher rate of recovery of C. perfringens than TSC (2). Moreover, at NFA, we have
noticed that the strain of C. perfringens present in mixture B had a lower recovery on
TSC agar with a pH higher than 7.6.
Aerobic microorganisms, 20-25 °C and H
2
S producing bacteria in fish
products
Mixture A
Colonies counted for the analysis of aerobic microorganisms were mainly from the
strains of Lactobacillus plantarum and Hafnia alvei. Hafnia alvei, which forms black
colonies on Iron agar, was also target-organism for the analysis of H
2
S producing
bacteria.
Mixture B
Colonies of Aeromonas hydrophila, Shewanella putrefaciens, Staphylococcus warneri
and Staphylococcus aureus formed the colonies counted for the analysis of aerobic
microorganisms. Only the strain of Shewanella putrefaciens was target-organism for the
analysis of H
2
S producing bacteria.
Mixture C
For the analysis of aerobic microorganisms, colonies counted were mainly from the
strains of Staphylococcus warneri and Escherichia coli. The mixture did not contain any
H
2
S producing bacteria.
Results of aerobic microorganisms in fish products analysis
Medium
Mixture A
Mixture B
Mixture C
n
m
s
F < > n
m
s
F
< >
n
m
s
F < >
Total
31 4.13 0.43 0 0 0 31 4.23 0.37
0
0 2
31
4.93 0.13 1 1 2
Iron agar
26 4.11 0.45 0 0 0 26 4.21 0.34
0
0 1
26
4.92 0.13 1 0 1
Results of H
2
S producing bacteria in fish products analysis
Medium
Mixture A
Mixture B
Mixture C
n
m
s
F < > n
m
s
F <
>
n
m
s
F
< >
Total
26 3.62 0.13 2 2 0 26 3.70 0.22 1
0
0
26
-
-
0
-
-
Aerobic microorganisms, 20-25 °C
H
2
S producing bacteria
A
A
0 3 6 9 12 15 2 2,5 3 3,5 4 4,5 5 5,5 6log10 CFU per ml
4,1 ↓ N o o f r e s u lts 0 3 6 9 12 15 2 2,5 3 3,5 4 4,5 5 5,5 6
log10 CFU per ml
3,6 ↓ N o o f r e s u lts *
B
B
C
C
The 26 laboratories that performed both analyses all used Iron agar, therefore no
distribution of results according to medium is presented here. For the two first mixtures,
results of the analysis of aerobic microorganisms are very spread. For mixture A they
are divided in two peaks corresponding to the concentration of H. alvei (3.6) and L.
plantarum (4.4). The former corresponds to the peak of results obtained for the analysis
of H
2
S producing bacteria. The same trend is visible for mixture B, although the results
of aerobic microorganisms are distributed in wide peak where the lower values reflect
the results obtained for the analysis of H
2
S producing bacteria. Mixture C did not cause
any difficulty.
Yeasts and moulds
Mixture A
The mixture did not contain any yeast. Strains of Penicillium verrucosum and
Aspergillus sp. were target-organisms for the analysis of moulds. P. verrucosum formed
small colonies on DRBC and brick-colored colonies on DG18. Aspergillus sp. formed
blue-green colonies both on DRBC and DG18.
Mixture B
The mixture contained no yeasts or moulds.
Mixture C
The mixture contained no moulds but a yeast strain of Kluyveromyces marxianus which
formed pink colonies on DRBC and small white colonies on DG18.
0 3 6 9 12 15 2 2,5 3 3,5 4 4,5 5 5,5 6 log 10 CFU per ml 4,2 ↓ N o o f r e s u lts 0 3 6 9 12 15 2 2,5 3 3,5 4 4,5 5 5,5 6 log 10 CFU per ml 3,7 ↓ N o o f r e s u lts * 0 3 6 9 12 15 2 2,5 3 3,5 4 4,5 5 5,5 6 log 10 CFU per ml 4,9 ↓ N o o f r e s u lts * *
Results of yeast analysis
Medium
Mixture A
Mixture B
Mixture C
n
m s
F < >
n
m
s
F
< >
n
m
s
F < >
Total
154
-
-
5 -
-
157
-
-
2
- -
159
3.65 0.16 3 3 3
YGC
36
-
-
1 -
-
44
-
-
0
- -
45
3.64 0.16 1 0 1
DRBC/DG18
17
-
-
0 -
-
25
-
-
0
- -
25
3.66 0.14 0 0 0
DG18
13
-
-
1 -
-
20
-
-
0
- -
21
3.66 0.12 0 1 0
DRBC
15
-
-
1 -
-
17
-
-
1
- -
17
3.55 0.26 1 1 0
OGYE
8
-
-
0 -
-
10
-
-
0
- -
10
3.71 0.09 0 0 0
Petrifilm
™5
-
-
0 -
-
8
-
-
0
- -
8
3.70 0.19 1 0 0
C
C
Results of mould analysis
Medium
Mixture A
Mixture B
Mixture C
n
m
s
F < >
n
m
s F < >
n
m
s F < >
Total
156
2.24 0.15 4 4
3
157
-
- 2 - -
157
-
- 7 - -
YGC
42
2.21 0.15 0 1
1
42
-
- 2 - -
42
-
- 2 - -
DRBC/DG18
25
2.28 0.12 0 0
0
25
-
- 0 - -
25
-
- 0 - -
DG18
19
2.22 0.21 0 1
0
20
-
- 0 - -
20
-
- 1 - -
DRBC
16
2.28 0.15 1 1
0
16
-
- 0 - -
16
-
- 1 - -
OGYE
10
2.28 0.12 0 0
0
10
-
- 0 - -
10
-
- 0 - -
Petrifilm
™5
2.21 0.07 1 0
0
7
-
- 0 - -
7
-
- 1 - -
A
A
Most of the laboratories performed yeast and mould analyses according to the method
NMKL 98:2005 / ISO 21527:2008 which describes the use of DRBC, DG18 and/or
OGYE, or according to the method ISO 6811:2004 / IDF:94:2004 which describe the
use of YGC or OGYE. Few laboratories used the method ISO 7954:1987 that has been
replaced by ISO 21527. There is no obvious difference in results depending on the
medium used.
0 10 20 30 40 50 1 1,5 2 2,5 3 3,5 4 4,5 5log10 CFU per ml
3,6 ↓ N o o f r e s u lts * 0 10 20 30 40 50 1 1,5 2 2,5 3 3,5 4 4,5 5 YGC DRBC/DG18 DG18 DRBC OGYE Petrifilm N o o f r e s u lts log 10 CFU per ml * 0 10 20 30 40 50 0 0,5 1 1,5 2 2,5 3 3,5 4
log10 CFU per ml
2,2 ↓ N o o f r e s u lts 0 10 20 30 40 50 0 0,5 1 1,5 2 2,5 3 3,5 4 YGC DRBC/DG18 DG18 DRBC OGYE Petrifilm N o o f r e s u lts log 10 CFU per ml