This is the published version of a paper published in International Journal for Equity in Health.
Citation for the original published paper (version of record):
Darin-Mattsson, A., Fors, S., Kåreholt, I. (2017)
Different indicators of socioeconomic status and their relative importance as determinants of
health in old age.
International Journal for Equity in Health, 16(1): 173
https://doi.org/10.1186/s12939-017-0670-3
Access to the published version may require subscription.
N.B. When citing this work, cite the original published paper.
Open Access
Permanent link to this version:
R E S E A R C H
Open Access
Different indicators of socioeconomic
status and their relative importance
as determinants of health in old age
Alexander Darin-Mattsson
1*, Stefan Fors
1and Ingemar Kåreholt
1,2Abstract
Background: Socioeconomic status has been operationalised in a variety of ways, most commonly as education, social class, or income. In this study, we also use occupational complexity and a SES-index as alternative measures of socioeconomic status. Studies show that in analyses of health inequalities in the general population, the choice of indicators influence the magnitude of the observed inequalities. Less is known about the influence of indicator choice in studies of older adults. The aim of this study is twofold: i) to analyse the impact of the choice of socioeconomic status indicator on the observed health inequalities among older adults, ii) to explore whether different indicators of socioeconomic status are independently associated with health in old age.
Methods: We combined data from two nationally representative Swedish surveys, providing more than 20 years of follow-up. Average marginal effects were estimated to compare the association between the five indicators of SES, and three late-life health outcomes: mobility limitations, limitations in activities of daily living (ADL), and
psychological distress.
Results: All socioeconomic status indicators were associated with late-life health; there were only minor differences in the effect sizes. Income was most strongly associated to all indicators of late-life health, the associations remained statistically significant when adjusting for the other indicators. In the fully adjusted models, education contributed to the model fits with 0–3% (depending on the outcome), social class with 0–1%, occupational complexity with 1–8%,
and income with 3–18%.
Conclusions: Our results indicate overlapping properties between socioeconomic status indicators in relation to late-life health. However, income is associated to late-life health independently of all other variables. Moreover, income did not perform substantially worse than the composite SES-index in capturing health variation. Thus, if the primary objective of including an indicator of socioeconomic status is to adjust the model for socioeconomic differences in late-life health rather than to analyse these inequalities per se, income may be the preferable indicator. If, on the other hand, the primary objective of a study is to analyse specific aspects of health inequalities, or the mechanisms that drive health inequalities, then the choice of indicator should be theoretically guided.
Keywords: Socioeconomic indicators, Education, Social class, Income, Occupational complexity, SES-index, Late-life health
* Correspondence:alexander.darin.mattsson@ki.se
1Aging Research Centre (ARC), Karolinska Institutet & Stockholm University, Gävlegatan 16, 113 30 Stockholm, Sweden
Full list of author information is available at the end of the article
© The Author(s). 2017 Open Access This article is distributed under the terms of the Creative Commons Attribution 4.0 International License (http://creativecommons.org/licenses/by/4.0/), which permits unrestricted use, distribution, and reproduction in any medium, provided you give appropriate credit to the original author(s) and the source, provide a link to the Creative Commons license, and indicate if changes were made. The Creative Commons Public Domain Dedication waiver (http://creativecommons.org/publicdomain/zero/1.0/) applies to the data made available in this article, unless otherwise stated.
Background
Studies of social determinants of health have repeatedly found socioeconomic inequalities in health. People with lower socioeconomic status (SES) have, on average, poorer health and die younger than those with more favourable SES. Socioeconomic inequalities in health persist into old age [1–4]. The results from a compara-tive study showed that the magnitude of inequality in morbidity in eleven European countries varied, however, health inequalities in all age groups were observed in all countries [3]. As most morbidity and mortality occurs in old age, these inequalities may affect a substantial pro-portion of the older population and increase the eco-nomic burden of public spending as the population ages. In studies of health inequalities in later life, SES is most commonly operationalised as either education, so-cial class, or income– and often without providing a ra-tionale for the choice of indicator [5–7].
The overarching aim of this study was to explore how the three most common indicators of SES (education, so-cial class, and income) are associated with health in old age. We also included occupational complexity as an alter-native indicator of SES, as recent research suggests that complexity is a key driver of labour market stratification [8–10]. Education, social class, occupational complexity, and income all have overlapping properties, but they may also be independently associated with health in old age. Therefore, we explored the relation between these vari-ables, a composite measure of the varivari-ables, and change in mobility limitations, activities of daily living, and psycho-logical distress from working ages to old age.
Education, social class, occupational complexity, income, and health in old age
The individuals’ highest attained level of education is gen-erally reached in early adulthood, and serves to bridge so-cioeconomic conditions across generations [11]. Research suggest that the associations between education and health is driven by increases in human capital, psycho-social resources, living conditions, better health care and lifestyle, and selection (direct and indirect) [12]. Studies show that people with lower levels of education tend to have a more rapid health decline in old age [13]. However, educational level often show a weaker association with health in old age than other indices, such as wealth, income, tenure, and deprivation [14–16].
Most often, social class is identified using occupation as the stratifying principle. Many class schemas primarily distinguish occupations depending on ownership (i.e, be-tween employers and employees). Thereafter, groups of employers and employees are distinguished depending on size and type of organization, skill requirements, power relations, and working conditions [17, 18]. Besides being associated with current income, social class is also
associated with: i) income security, ii) short term income stability, and iii) long term income development [19, 20]. Results on the association between social class and late-life health are ambiguous. Duncan et al. [15] did not find any association between social class and mortality in older age, while other studies have [1, 21].
Some research have suggested that skill requirements, productivity and efficiency may provide a better explan-ation of social stratificexplan-ation at the labour market than conventional class theories [8–10]. Using Swedish data, Tåhlin found that the occupational complexity level is more strongly associated to the earned wages than trad-itional social class schemas [9, 10]. Tåhlin further argues that the level of occupational complexity associated with a given occupation can be used as a proxy for efficiency and productivity. Against this background, we have in-cluded a measure of occupational complexity as an alter-native indicator of SES.
Income is often considered to be a straightforward in-dicator of material resources, and income is, robustly and positively, associated with longevity [22, 23]. Income might affect the health of people by enabling those with high income to lead healthy lifestyles, while those at the lower rungs of the income distribution have fewer of these enabling resources [24]. Income has an important role as an enabling resource for health care access and use in the Andersen health behavioural model [25, 26]. On the other hand, poor health can also result in lower incomes [27]. Hence, the association between income and health is likely shaped by bi-directional causal mechanisms. In the literature, measures indicating finan-cial situation is commonly most strongly associated to health and mortality in old age, when compared to e.g. educational level and social class [14–16].
The rationale for including specific indicators of SES in studies of health in old age may vary. It could be to moni-tor, or to understand, how the social patterning of re-sources affect health. In this case, it is important to consider the different pathways and mechanism that edu-cation, social class, income, and occupational complexity might have on health. Another reason could be to merely adjust a model for as much socioeconomic variance as possible, without any specific interest in the mechanisms driving the health inequalities. Research suggest that a composite measures of individual level indicators could be appropriate for this purpose [28]. The findings from a pre-vious study, based on the same data as the present study, suggested that a composite measure of individual level variables of SES was more suitable for this purpose than any of the individual variables [29]. On the other hand, using a composite measure of individual level variables of SES, may obscure the underlying mechanisms and prevent progression in the understanding of how different aspects of SES contributes to health.
Education, social class, occupational complexity, and income are inherently associated, as education is associ-ated with occupational position and complexity, which in turn is associated with income [8, 30]. In addition, so-cioeconomic disadvantage tend to accumulate over the life course, both between and within socioeconomic do-mains [31]. Evidence suggest that there are certain, sen-sitive, periods in life where exposure to socioeconomic disadvantages may have increased and sustained effect on health throughout the life course [32].
Studies of the working age population have showed that different indicators of SES are differently associated with different health outcomes, which suggest that dif-ferent underlying mechanisms may generate these asso-ciations [5, 33]. These findings suggest that the choice of indicator may be of importance for the results and the interpretations, when studying socioeconomic inequal-ities in health. Less is known of how different SES indi-cators relate to health in old age.
A thorough exploration of how the association be-tween SES and health in old age varies by indicator of SES may provide important insights into the mecha-nisms generating socioeconomic inequalities in late-life health. As most commonly used indictors of SES are rooted in educational and occupational stratification, we chose to assess these variables in late working life when people tend to have reached their peak positions, in terms of educational level, social class, and income.
In the present study, late life health is assessed in terms of mobility limitations, limitations in activities of daily living (ADL), and psychological distress. These are all common areas of health problems in later life, and the burden of these afflictions in terms of societal costs is substantial [34]. Mobility limitations and ADL limita-tions are rare among people under the age of 40, but after the age of 40 the prevalence increase with age. Mobility and ADL limitations, and psychological dis-tress are all strong predictors of need for social services and institutionalization [35–37]. Moreover, psycho-logical distress also predict other health outcomes with special relevance for the old age population, such as de-mentia, mortality, cardiovascular diseases, and cerebro-vascular disease [38–40].
Methods
Data
All analyses were conducted on linkages drawn from two data sources: the Swedish Level of Living Surveys (LNU) and the Swedish Longitudinal Study of Living Conditions of the Oldest Old (SWEOLD). Each linkage entail data from one wave of LNU with follow-up in a wave of SWEOLD. LNU and SWEOLD are both longitu-dinal social surveys, based on random samples of the Swedish population. The first wave of LNU was carried
out in 1968 using a nationally representative sample of individuals aged 18 to 75 years. The sample was then followed-up in 1974, 1981, 1991, 2000, and 2010 [41]. The response rates for the waves used in the present study varies between 78.3% and 90.8% (n ≈ 6000–8000). In LNU, respondents were asked about a wide variety of topics, including their present health status, educational achievements, and occupation. SWEOLD is a continu-ation of LNU: it includes those who have ‘aged out’ of the LNU sample (i.e. those who are 75 years or older), and who were previously included in the LNU sample. SWEOLD has been conducted in 1992, 2002, 2004, and 2011; and the response rates varied between 84.4% and 95.4% (n ≈ 600–1000). In the 2004 wave, the age-span included was wider, and included those aged 69 years and older [42].
The independent variables were assessed at baseline and dependent variables in the designated follow-up. Re-spondents from LNU 1968 were followed-up in SWEOLD 1992 (linkage 1), respondents from LNU 1981 were followed-up in SWEOLD 2002 (linkage 2) and SWEOLD 2004 (linkage 3), and respondents from LNU 1991 were followed-up in SWEOLD 2011 (linkage 4).
The four linkages were analysed separately and as pooled data. The magnitude of the associations between the independent variables and the outcomes varied by linkage, but the differences were small and not system-atic. Thus, we present the results from the full sample, with all the linkages pooled.
The study was restricted to people who were 46 to 64 years at baseline, and who were alive and participated in the designated follow-up (n = 2342). The age restriction was based on the possibility to be included in a follow-up in old age (SWEOLD data). Social class and occupational complexity level is based on occupation, therefore we in-cluded only those that were in paid employment (or self-employed) at baseline in the main analyses (n = 2027; 87% of the total sample). However, we performed separate ana-lyses for those who were not in paid employment (or self-employed) at baseline (Table 3).
In the analyses of mobility limitations, the study sample was restricted to people without any mobility limitations at baseline (n = 1772), and in the analyses of psychological distress, to people without psycho-logical distress at baseline (n = 1616). Sensitivity ana-lyses, comparing the estimates to estimates based on the full sample showed similar results. Respondents who did not answer the questions about the out-come variables were excluded, which resulted in a different number of observations in the analyses of mobility limitations (n = 1763) and psychological dis-tress (n = 1596). Since ADL limitations was not assessed in the LNU (baseline) all respondents were analysed studying ADL limitations (n = 2027).
Measurements
Mobility limitationswere assessed by the question:‘Can you walk 100 meters at a fairly brisk pace without prob-lems?’ and ‘Can you climb stairs (up and down) without problems?’ The response alternatives were ‘yes’ and ‘no’. Responses were summarised in an index that ranged from 0 (no problems) to 2 (problems with both tasks).
Limitations in activity of daily living (ADL) were assessed by five questions:‘Can you eat by yourself?’, ‘Can you go to the toilet by yourself?’, ‘Can you dress and un-dress yourself?’,‘Can you get in and out of bed by yourself?’, and ‘Can you wash your hair by yourself?’. The response alternatives were‘yes, manage completely by myself’, ‘yes, with help’, and ‘no, not at all’. The responses were sum-marised in an index from 0 (managed all five tasks without help) to 10 (not able to perform any of the tasks).
Psychological distress was assessed by a general ques-tion: ‘Have you had any of the following diseases or disorders during the last 12 months?’, followed by a multi-item list of symptoms and disorders. We calcu-lated an index based on the responses regarding anxiety and depressive symptoms. The response alternatives were ‘no’, ‘yes, slight’, and ‘yes, severe’. The responses were summarised in an index ranging from 0 (no prob-lems) to 4 (severe psychological distress).
Education was measured as educational attainment. Self-reported educational attainment was divided into three groups: high, medium, or low. Upper secondary school or above was considered a high level of educa-tional attainment. Compulsory school complemented with vocational training was considered a medium level of education. Attending compulsory school only or no schooling was considered as low level of education.
Social class was based on self-reported occupation at baseline, classified in accordance with the Swedish so-cioeconomic index (SEI), which is very similar to the Erikson, Goldthorpe, and Portocarero’s (EGP) schema [43]. The social classes were collapsed into three groups: low (unskilled and skilled blue-collar workers, small farmers and entrepreneurs without employees); medium (lower-level white-collar workers, farmers and entrepreneurs with 1 to 19 employees); and high (inter-mediate and upper-level white-collar workers, farmers and entrepreneurs with 20 or more employees, and aca-demic professionals).
Occupational complexity was assessed by assigning a ‘substantive complexity’ score to each occupational cat-egory. The substantive complexity scores indicate the level of intellectual flexibility, engagement, and skills needed to perform working tasks of greater or lesser complexity. The measure of substantive complexity used in this study was developed by Roos and Treiman [44], and is based on the U.S. Dictionary of Occupational Titles (DOT) and the U.S. Census 1970. The DOT
included 46 worker characteristics, assessed by job ana-lysts. Roos and Treiman performed a principal compo-nent factor analysis and found a factor, including eight of the characteristics (general educational development, specific vocational preparation, complexity of work with data, intelligence aptitude, verbal aptitude, numerical ap-titude, abstract interest in the job, and temperament for repetitive and continuous processes), that they called ‘substantive complexity’. This measure forms the basis for our measure of occupational complexity [44]. These scores have later been matched to Swedish occupational categories. See Andel et al. [45] for a description of the matching procedure and Darin-Mattsson et al. [29] for a more thorough description of occupational complexity. Occupational complexity ranges 0–10, the scale was divided into three categories on the complexity scale: 0– 3.3 = low complexity, 3.4–6.4 = medium complexity, and 6.5–10 = high complexity.
Individual incomewas assessed from Swedish tax reg-isters the year before baseline. Income was standardised to the purchasing power of 1991, log transformed and divided into quintiles. To increase the comparability of the models and to increase model fit, we divided in-come into three categories. We collapsed the two low-est quintiles into category 1 and quintiles three and four into category 2. Category 3 consisted of the fifth quintile, which included those with the highest in-comes. This categorization was data-driven and based on tests of spline lines, which showed that the used categorization gave the best fit of the data.
We also used all of the SES indicators described above to construct a composite measure of SES (the SES-index). We used education, social class, occupa-tional complexity, and income as classified above, and summarized them. The index was then divided into ter-tiles. This was done to investigate whether a composite measure could, statistically, capture as much, or more, of the variance in late-life health as the individual indicators.
Covariates in all analyses were age, sex, and linkage. Age and sex was assessed by self-reports during the interview. Age was measured by birth year and given continuous representation in all analyses. Sex was categorized as either woman or man.
Statistical methods
The results are presented in terms of Average Marginal Effects (AME) multiplied by 100. AMEs are estimated as the average difference in probability of the given out-come across all observations with covariates at their observed values. Thus, the estimates can be interpreted as the differences in the probability of the outcome in percentage points. We use AMEs, rather than odds ra-tios or β-coefficients, as they are comparable across
models, intuitively interpretable, and provide absolute measures of inequality [46]. The AMEs from ordered logistic regression should be interpreted as the differ-ence in the probability of reporting an outcome one-step higher on the scale than the outcome in the reference group. The proportional odds assumption was tested with the gologit2 command in Stata [47], and the assumption was accepted.
In addition, we used McKelvey & Zavoina’s pseudo-R2 to compare estimates of explained variance from different models using the same dataset [48]. To study how each of the main independent variables contrib-uted to model fit, we calculated the change in pseudo-R2 obtained by adding each independent variables (education, social class, income, and occupational complexity) one at a time to a model including only the outcomes and adjustments for sex, age, and link-age. For each indicator of socioeconomic status, we also calculated the change in pseudo-R2 associated to the exclusion of that variable from the full model (model 2).
We also ran all analyses stratified by sex. We found only small, statistically non-significant, differences tween women and men except in the association be-tween social class and mobility limitations (see results).
Our study design allow individuals to be included in several linkages. Thus, 282 people were included in both linkage 2 and 3 (<15% of the sample) and the cators of health in old age could be clustered on indi-vidual level. As this could lead to artificially low standard errors, we used cluster-correlated robust esti-mates of variance in the analyses [49].
We also used multiple imputation to impute missing data on mobility limitations at baseline (113 imputa-tions were included). Sensitivity analyses showed none or small differences between the imputed and non-imputed data. There were no internal non-responses of psychological distress at baseline in the analytical sample. No imputations were made on the outcome variables.
Spearman’s correlations between the independent variables were moderate. The correlation between edu-cation and social class was 0.51; between eduedu-cation and income, 0.38; between education and occupational complexity, 0.29; between class and income, 0.39; tween class and occupational complexity, 0.38; and be-tween income and occupational complexity, 0.22. All correlations were statistically significant (p < 0.001). Correlations between the indicators differed between the linkages, and there was a general trend towards minor, statistically non-significant, increases in the cor-relations over time. Model 2 was tested for multicolli-nearity with the VIF command in Stata, and the result indicated no multicollinearity.
Results
Descriptive statistics are presented in Table 1. There were more women than men among the respondents, and women reported more problems in all three out-comes. Most respondents (around 50%) had low edu-cation and social class, but medium occupational complexity. The mean age at follow-up was 79 years. There were no statistically significant differences in psychological distress by age group. However, limita-tions in mobility and ADL increased with age. In gen-eral, the respondents with the highest level of the SES indicators had the least problems while the lowest group had the worst health outcomes, with one excep-tion – people with medium social class had signifi-cantly lower ADL limitations than people with high or low social class. The association between ADL limita-tions and occupational complexity was not significant, and there were no statistically significant differences in psychological distress by education or social class.
The associations between education, social class, oc-cupational complexity, income, the SES-index, and health in later life were all analysed separately in model 1 (Table 2), adjusted only for age, sex, and link-age. In model 2 (Table 2), all the SES indicators were analysed simultaneously in relation to each health out-come. We also adjusted the associations between each individual SES indicator and each health outcome, by the other indicators of SES one-by-one. For these results, see Additional file 1: Table S1 and Additional file 2: Table S2.
At this point, it is worth noting that the effect sizes in the main analyses are dependent on the scales of the outcome variables. As the health outcomes are scaled differently, this means that the estimates for the different outcomes are not comparable.
Education
Education was significantly and negatively associated with both mobility limitations and psychological dis-tress, but not with ADL limitations (Table 2; model 1). Including education increased the model fit by 12% in the analyses of mobility limitations, 3% for ADL limita-tions, and 15% for psychological distress. However, the inclusion of the variable did not significantly improve the model fit for ADL limitations and psychological distress. Only the high-educated group deviated sig-nificantly from the other groups, with better health. Adjusted for the other SES indicators (Table 2; model 2), education was no longer significantly associated with the health outcomes, and contributed with only 1% to the total model fit for mobility limitations, 0% for ADL limitations, and 3% for psychological distress (Table 2; model 2).
Social class
People with low social class had an increased risk of all outcomes compared to the other two groups (Table 2; model 1). Social class contributed to the model fit with approximately the same magnitude as education. Analyses stratified by sex showed no dif-ferences in the probability of mobility limitations be-tween men from the middle and upper social classes, however, the difference between women from the middle and upper social classes were statistically sig-nificant (AME 4.83, p = 0.002). In the fully adjusted model (Table 2; model 2), social class did not con-tribute to any explained variance at all.
Occupational complexity
People who held occupations with a low complexity level had an elevated risk for mobility limitations and psychological distress in old age, compared to those who held an occupation characterised by high com-plexity. On the other hand, there were no statistically significant differences in ADL limitations, by complex-ity level. However, the inclusion of the variable improved the model fit significantly. Occupational complexity contributed less to the explained variance in the models than education, with the exception of the models for psychological distress. In the fully adjusted model (Table 2; model 2), there were no
Table 1 Descriptive statistics - proportion with no problems in mobility limitations, ADL limitations, and psychological distress and average number of problems for those reporting any problems
Mobility limitations (0–2)1 ADL limitations (0–10) Psychological distress (0–4) All (n = 2036) Mean problems2 n3 Mean problems n Mean problems n
Total % 0.59 1763 0.53 2027 0.38 1596 Sex p = 0.0054 p = 0.325 p < 0.001 Women 41.7 0.69 1000 0.57 1185 0.46 867 Men 58.3 0.48 763 0.48 842 0.27 729 Age at follow-up p < 0.001 p < 0.001 p = 0.797 69–75 19.7 0.34 360 0.13 399 0.36 346 76–82 56.8 0.58 1018 0.47 1153 0.39 884 83–88 23.5 0.85 385 1.02 475 0.37 366 Education p < 0.001 p = 0.011 p = 0.105 High 9.4 0.35 182 0.28 191 0.25 159 Medium 36.1 0.51 668 0.48 730 0.40 584 Low 54.6 0.69 913 0.61 1106 0.38 853 Social class p < 0.001 p = 0.017 p = 0.135 High 24.4 0.44 458 0.62 495 0.32 425 Medium 22.2 0.56 400 0.40 450 0.38 343 Low 53.4 0.67 904 0.59 1078 0.41 826 Occupational complexity p = 0.001 p = 0.144 p = 0.009 High 11.4 0.39 216 0.46 233 0.25 193 Medium 51.3 0.59 897 0.43 1038 0.34 823 Low 37.2 0.65 650 0.71 756 0.48 580 Income p < 0.001 p = 0.031 p < 0.001 High 20.0 0.36 354 0.32 405 0.21 324 Medium 40.0 0.60 705 0.52 810 0.41 646 Low 40.0 0.69 704 0.66 812 0.43 646 SEP-index p < 0.001 p = 0.002 p = 0.017 High 29.9 0.42 558 0.35 606 0.30 503 Medium 36.2 0.61 635 0.49 727 0.41 576 Low 34.0 0.72 569 0.75 690 0.42 515 1
Range of the dependent variable
2
The average number of reported problems
3
The number of observations differ between dependent variables because of internal non-response
4
Table 2 Average marginal effects (AMEs) times 100 of reporting more health problems than the reference group and model fit (R2 change)
Mobility limitations (n = 1763)1 R2 change ADL limitations (n = 2036) R2 change Psychological distress (n = 1596) R2 Change
AME (%) p value AME (%) p value AME (%) p value
Education Model 1
-High (Ref) [0.001]2 12%3 (Ref) [0.236] 3% (Ref) [0.060] 15%
-Medium 7.02 0.039 1.43 0.229 9.46 0.022
-Low 12.16 0.001 1.99 0.103 9.42 0.022
Model 2
-High (Ref) [0.398] 1%4 (Ref) [0.921] 0% (Ref) [0.468] 3%
-Medium 2.53 0.251 0.42 0.933 4.93 0.305
-Low 5.08 0.531 0.12 0.767 2.87 0.568
Social class Model 1
-High (Ref) [0.001] 12% (Ref) [0.021] 5% (Ref) [0.104] 12%
-Medium 5.33 0.052 1.04 0.221 4.52 0.145
-Low 9.10 0.000 2.01 0.007 5.79 0.035
Model 2
-High (Ref) [0.680] 0% (Ref) [0.937] 1% (Ref) [0.949] 1%
-Medium −0.12 0.971 0.54 0.141 −0.83 0.829
-Low 1.96 0.559 1.39 0.583 0.01 0.997
Occupational complexity Model 1
-High (Ref) [0.015] 9% (Ref) [0.043] 4% (Ref) [0.012] 18%
-Medium 8.49 0.004 0.26 0.153 4.95 0.181
-Low 10.15 0.011 1.73 0.806 10.34 0.011
Model 2
-High (Ref) [0.510] 2% (Ref) [0.128] 1% (Ref) [0.094] 8%
-Medium 4.23 0.281 −1.03 0.400 2.42 0.567
-Low 4.79 0.250 0.15 0.914 7.23 0.128
Income Model 1
-High (Ref) [0.000] 13% (Ref) [0.007] 7% (Ref) [0.006] 27%
-Medium 10.37 0.000 2.44 0.002 10.58 0.004
-Low 13.05 0.000 2.30 0.007 9.93 0.002
Model 2
-High (Ref) [0.019] 7% (Ref) [0.102] 3% (Ref) [0.072] 18%
-Medium 7.37 0.005 1.88 0.025 8.70 0.037
-Low 9.31 0.014 1.81 0.058 8.42 0.023
SEP-index Model 1
-High (Ref) [0.000] 16% (Ref) [0.008] 6% (Ref) [0.011] 20%
-Medium 8.53 0.000 6.18 0.021 28.64 0.003
-Low 10.38 0.000 9.56 0.002 20.09 0.044
Results in bold:p < 0.05
Model 1: adjusted for age, sex, and linkage. Model 2: model 1 + all independent variables were analyzed simultaneously
1Outcome variables have different scales: mobility limitations (0–2), ADL (0–10) and psychological distress (0–4) 2Numbers in square brackets [] arep-values for the contribution of the whole variable (likelihood ratio test) 3McKelvey & Zavoina’s pseudo-R2 change compared to a model without that specific indicator of SEP 4Pseudo-R2 change to model 2 attributed to that specific indicator of SEP
statistically significant associations between occupa-tional complexity and late-life health.
Income
Income was statistically significantly associated with all outcomes. The high-income group consequently had the lowest probabilities of adverse health of all income groups. Income contributed to model fit by 13% for mo-bility limitations, 7% for ADL limitations, and 27% for psychological distress (Table 2). Income was the only in-dicator that remained statistically significantly associated with the health outcomes in the fully adjusted models (model 2). In addition, income contributed the most to the model fits in model 2: 7% to mobility limitations, 3% to ADL limitations, and 18% to psychological distress.
SES-index
The high SES-index group had better health than the other groups. The SES-index increased model fit more than any of the other indicators in the models of mobil-ity limitations, about the same as income for ADL limi-tations, and less than income for psychological distress.
Including all the indicators of SES simultaneously in-creased model fit for mobility limitations by 29%, com-pared to a model only adjusted for age, sex, and linkage. The individual contribution of each variable sum up to an increased model fit of 46% (education 12% + social class 12% + occupational complexity 9% + income 13%). The difference between 46 and 29% indicate that the properties of the socioeconomic indicators overlap. The composite measure of the variables (SES-index) ex-plained less variance than simultaneously including all SES indicators. A similar pattern emerged for ADL limi-tations. The contribution, when including all SES indica-tors simultaneously was 12%, while the sum of the individual contributions amounted to 19%, and the SES-index only explained 6%. The same pattern holds when psychological distress is the outcome, the summed in-crease in model fit for all SES indicators was 72%, whereas the combined increase was 37%, and the SES-index increased model fit by 20%. These result suggests that properties of the indicators overlap when analysing psychological distress.
People not in paid employment at baseline
Only people who held a paid occupation at baseline were included in the above analyses (Table 2). In Table 3, we analysed those who did not have a paid occupation in re-lation to those who held a paid occupation at baseline.
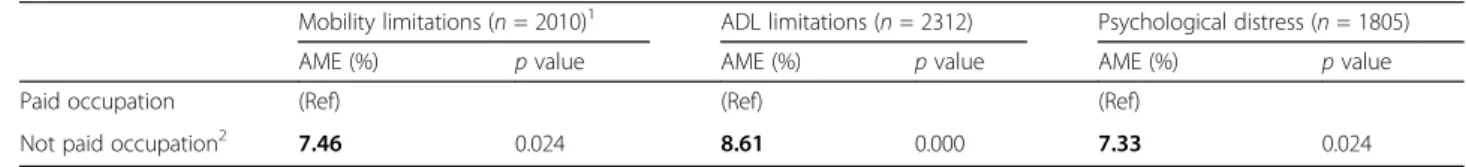
The results show that individuals who did not hold a paid occupation at baseline had higher probabilities of health problems in old age, compared to those who held paid occupations at baseline. The increased probabilities of health problems among those without a paid occupa-tion at baseline was of the magnitude of 7.46 percentage points for mobility limitations, 8.62 percentage points for ADL limitations, and 7.33 percentage points for psychological distress.
Discussion
We found that education, social class, occupational complexity, income, and a composite measure of SES (the SES-index) all were significantly associated with late life health. Income was most strongly associated with adverse health in late life. Income was also the only vari-able that remained statistically significantly associated with health when adjusted for the other separate SES variables. The results also indicate that income captured as much variance in the health outcomes as the compos-ite measure, based on a series of SES indicators.
As with all studies, these results should be interpreted with caution. We explored the independent associations between several interrelated indicators of SES and late-life health in a mid-sized sample. Therefore, it is possible that the study lacked sufficient statistical power to efficiently detect all relevant associations.
As in all studies based on older adults, the results may be affected by selective survival [50]. As we studied in-equality in health among those surviving into old age, inclusion in our target population was contingent on survival into old age. Thus, our estimates might be at-tenuated by the higher mortality rates among those with lower SES than among those with higher SES. Selective survival also implies that the indicators that exhibit the weakest associations with late-life health might be more strongly associated with health and mortality earlier in life, and vice versa. Similarly, there was also a selection into employment in mid-life that may affect our
Table 3 Average marginal effects (AME’s) multiplied by 100 for mobility limitations, ADL limitations, and psychological distress by paid occupation (including farmers and self-employed) or not at baseline
Mobility limitations (n = 2010)1 ADL limitations (n = 2312) Psychological distress (n = 1805)
AME (%) p value AME (%) p value AME (%) p value
Paid occupation (Ref) (Ref) (Ref)
Not paid occupation2 7.46 0.024 8.61 0.000 7.33 0.024
Results in bold:p < 0.05. All models were adjusted for age, sex, and linkage
1
The number of observations differ between dependent variables because of internal non-response
2
findings. This selection is typically stronger among women; as women are less likely than men to be employed in paid occupation. Hence, women were more likely than men to be excluded from our main analyses and end up in the not employed category. Our results show that those who were not employed at baseline were at an increased risk for poorer late-life health compared to those who were employed at baseline.
The study is based on data from social surveys. The health measures used are based on self-reports, rather than clinical examinations. It is not certain that the find-ings from this study can be generalized to other health outcomes. For example, the patterns might differ substantially for lifetime prevalence of coronary heart disease, cancer or diabetes.
We only explored individual-level variables of SES in this study. Previous research has suggested that, under some circumstances, household SES may be a more suit-able indicator of women’s SES than individual SES [51]. As a sensitivity measure, we therefore also ran the models using household social class. The results were similar (all association went in the same direction and were approximately of the same magnitude), possibly be-cause our main analyses were restricted to people with a paid occupation at baseline. We also tested household income for those cases where it was available. The asso-ciations between household income and individual in-come in relation to late-life health were similar.
Unfortunately, we were not able to assess wealth. Wealth is an indicator of financial resources accumu-lated over the life course (including inheritances), and the patterning of wealth in old age might therefore differ substantially from the patterning of incomes.
In 1939, Paul Lazarsfeld found that indices constructed with different information (that is, indices based on whether a person paid income tax, owned a car, or whether a person had a telephone in his or her home) re-sulted in approximately the same distribution of economic status throughout the population. He concluded that it is both theoretically and empirically probable that indices of economic status are interchangeable [52]. Geyer et al. [5] tested Lazarsfeld’s hypothesis using education, social class, and income as predictors of four different health out-comes in two populations aged 25–64 years. They found that each indicator had an independent effect on the out-comes but that the effect sizes and strengths of the associ-ations varied by indicator. Education was the strongest predictor for diabetes and income strongest predicted all-cause mortality, while results were mixed for myocardial infarction morbidity and mortality. Thus, they argued that indicators of SES are not interchangeable in relation to health. In contrast, our results showed no independent ef-fects by education, social class or occupational complexity on health in old age. Only income was independently
associated with health in old age. In addition, Geyer and colleagues found that different indicators were differently associated to different outcomes. In contrast, our results showed that income was most strongly associated to all health outcomes, except compared with the SES-index. Torssander and Erikson [33] found similar results as Geyer and colleagues in relation to mortality risk in the Swedish population aged 35–59. Each indicator of SES was clearly associated with risk of death for both women and men. They suggested that each indicator’s crude asso-ciation with mortality was in line with Lazarsfeld’s hypoth-esis on the interchangeability of indices, only if one assume that these indicators measure a general latent con-struct. On the other hand, the authors argue that if each indicator has an independent function, using them to map a latent construct would result in a loss of information [33]. This idea, that using one of these indicators inter-changeably to indicate a latent concept of SES may result in a loss of information relevant for social stratification and health and policy implications, have been supported by others [6, 53]. Few studies have explored this issue in relation to health in old age, but Avlund et al. [14] found that different indicators of SES were individually associ-ated to different health outcomes in old age. Our results show that income was the only indicator independently associated to late-life health, and that the indicators are otherwise statistically interchangeable. The indicators had approximately the same association to the outcomes, and their contribution to the model fits were comparable.
In line with previous studies [14–16], we also found that the most direct measure of economic differences (in this case, income) was most strongly and robustly asso-ciated with adverse health in old age.
A novel contribution of our study was the introduction of occupational complexity as an alternative indicator of SES in studies of health inequalities in old age. However, our results did not suggest that occupational complexity was a stronger determinant of late-life health than edu-cation, social class, income or a composite measure of SES (the SES-index).
Further research is needed to confirm the robustness of these findings and to explore the causal mechanisms underlying the associations between different aspects of socioeconomic status and late-life health.
Conclusion
This study investigated the most commonly used indica-tors of SES in health research in relation to three health outcomes in old age. We also included a less traditional measure strongly associated with SES (occupational complexity), and a composite measure based on several indicators of SES (the SES-index). The study contributes to the literature by doing an in depth investigation of how the SES indicators relate to each other, and to
late-life health, and by testing the predictive value of two novel measures of SES. In sum, our results suggests that income explain more variance in late-life health than any of the other SES indicators, with a predictive capacity that is equal, or even better, than that of a composite measure in-cluding a range of indicators. In sum, our results suggests that if the primary objective of including an indicator of SES, in studies of health in old age, is to merely adjust the model for socioeconomic differences income may be the preferred choice. If, on the other hand, the primary object-ive of the study is to examine health inequalities or the mechanisms that drive health inequalities in old age per se, then the choice of indicator should be made on the basis of a theoretical model that considers the unique properties of the different indicators.
Additional files
Additional file 1: Table S1. Average marginal effects (AMEs) times 100 of reporting more health problems than the reference group and model fit (R2 change). (DOCX 17 kb)
Additional file 2: Table S2. Average marginal effects (AMEs) times 100 of reporting more health problems than the reference group and model fit (R2 change). (DOCX 17 kb)
Acknowledgements Not applicable. Funding
This research was funded by the Marianne and Marcus Wallenberg (MMW) Foundation (Grant MMW 2011.0036, 2016.0081) and the Swedish Research Council for Health, Working Life, and Welfare (Grant 2012–0761, 2012–1704, and 2016–00241).
Availability of data and materials
It is possible to apply for LNU data at the Swedish Institute for Social Research (http://www.sofi.su.se/english/research/three-research-departments/ lnu-level-of-living/apply-for-lnu-data) and SWEOLD data at Aging Research Center (ARC) (http://www.sweold.se/dataaccessengelsk.htm).
Authors’ contributions
The authors contributed as follows: AD-M: conception and design, analysis and interpretation of data, drafting and revising, and approval; SF: conception and design, interpretation, critical revision, and approval; IK: conception and design, analysis and interpretation of data, critical revision, and approval. All authors read and approved the final manuscript.
Ethics approval and consent to participate
This study was approved by the ethical board in Stockholm (dnr: 2010/403–31/4) and we only analysed non-identifiable data. Written consent to use data for scientific purposes, including publication, was obtained from all survey respondents.
Consent for publication Not applicable. Competing interests
The authors declare that they have no competing interests.
Publisher’s Note
Springer Nature remains neutral with regard to jurisdictional claims in published maps and institutional affiliations.
Author details
1Aging Research Centre (ARC), Karolinska Institutet & Stockholm University, Gävlegatan 16, 113 30 Stockholm, Sweden.2Institute of Gerontology, School of Health and Welfare, Aging Research Network-Jönköping (ARN-J), Jönköping University, Jönköping, Sweden.
Received: 31 January 2017 Accepted: 21 September 2017
References
1. Fors S, Lennartsson C, Lundberg O. Health inequalities among older adults in Sweden 1991–2002. Eur J Pub Health. 2007;18:138–43.
2. Fors S, Thorslund M. Enduring inequality: Educational disparities in health among the oldest old in Sweden 1992-2011. Int J Public Health. 2015;60:91. 3. Huisman M, Kunst AE, Mackenbach JP. Socioeconomic inequalities in morbidity
among the elderly; a European overview. Soc Sci Med. 2003;57:861–73. 4. Hoffmann R. Socioeconomic differences in old age mortality. Springer
Science & Business Media; 2008.
5. Geyer S, Hemström Ö, Peter R, Vågerö D. Education, income, and occupational class cannot be used interchangeably in social epidemiology. Empirical evidence against a common practice. J. Epidemiol. Community Dent Health. 2006;60:804–10.
6. Goldthorpe JH. Analysing social inequality: a critique of two recent contributions from economics and epidemiology. Eur Sociol Rev. 2009;26: 731–44.
7. Ploubidis GB, Benova L, Grundy E, Laydon D, DeStavola B. Lifelong socio economic position and biomarkers of later life health: Testing the contribution of competing hypotheses. Soc Sci Med. 2014;119:258–65. 8. Le Grand C, Tåhlin M. Class, occupation, wages, and skills: The iron law of
labor market inequality. Cl. Stratif. Anal. Emerald Group Publishing Limited. 2013;30:3–46.
9. Tåhlin M. Vertical differentiation of work tasks: conceptual and measurement issues. Empir Res Vocat Educ Train. 2011;3:55–70. 10. Tåhlin M. Class clues. Eur Sociol Rev. 2007;23:557–72.
11. Mirowsky J, Ross CE. Education, social status, and health. New York: Transaction Publishers; 2003.
12. Hayward MD, Hummer RA, Sasson I. Trends and group differences in the association between educational attainment and US adult mortality: Implications for understanding education’s causal influence. Soc Sci Med. 2015;127:8–18.
13. Dupre ME. Educational Differences in Age-Related Patterns of Disease: Reconsidering the Cumulative Disadvantage and Age-As-Leveler Hypotheses∗. J Health Soc Behav. 2007;48:1–15.
14. Avlund K, Holstein BE, Osler M, Damsgaard MT, Holm-Pedersen P, Rasmussen NK. Social position and health in old age: the relevance of different indicators of social position. Scand J Soc Med. 2003;31:126–36. 15. Duncan GJ, Daly MC, McDonough P, Williams DR. Optimal indicators of
socioeconomic status for health research. Am J Public Health. 2002;92:1151–7. 16. Grundy E, Holt G. The socioeconomic status of older adults: How should we
measure it in studies of health inequalities? J Epidemiol Community Health. 2001;55:895–904.
17. Goldthorpe JH. On sociology. 2. Illustration and retrospect. Standford: Stanford University Press; 2007.
18. Rose D, Harrison E. Social class in Europe: An introduction to the European socio-economic classification. NewYork: Routledge; 2010.
19. Goldthorpe JH. The economic basis of social class. 2004;
20. Watson D, Whelan CT, Maître B. Class and poverty: cross-sectional and dynamic analysis of income poverty and life-style deprivation. Social Class in Europe: An Introduction to the European Socio-Economic Classification. London: Routledge; 2009.
21. Enroth L, Raitanen J, Hervonen A, Jylhä M. Do socioeconomic health differences persist in nonagenarians? J. Gerontol. B. Psychol. Sci. Soc. Sci. 2013;68:837–47.
22. Chetty R, Stepner M, Abraham S, Lin S, Scuderi B, Turner N, et al. The association between income and life expectancy in the United States, 2001-2014. JAMA. 2016;315:1750–66.
23. Rehnberg J, Fritzell J. The shape of the association between income and mortality in old age: A longitudinal Swedish national register study. SSM-Popul Health. 2016;2:750–6.
24. Marmot M. The influence of income on health: views of an epidemiologist. Health Aff. (Millwood). 2002;21:31–46.
25. Aday LA, Andersen R. A framework for the study of access to medical care. Health Serv Res. 1974;9:208.
26. Andersen RM. Revisiting the behavioral model and access to medical care: does it matter? J Health Soc Behav. 1995;36:1–10.
27. Muennig P. Health selection vs. causation in the income gradient: What can we learn from graphical trends? J. Health Care Poor Underserved. 2008;19:574–9. 28. Galobardes B, Lynch J, Smith GD. Measuring socioeconomic position in
health research. Br Med Bull. 2007;1:21–37.
29. Darin-Mattsson A, Andel R, Fors S, Kåreholt I. Are Occupational Complexity and Socioeconomic Position Related to Psychological Distress 20 Years Later? J Aging Health. 2015;27:1266–85.
30. Mirowsky J, Ross CE. Education, cumulative advantage, and health. Ageing Int. 2005;30:27.
31. Dannefer D. Cumulative advantage/disadvantage and the life course: Cross-fertilizing age and social science theory. J. Gerontol. B. Psychol. Sci. Soc. Sci. 2003;58:S327–37.
32. Ben-Shlomo Y, Kuh D. A life course approach to chronic disease
epidemiology: conceptual models, empirical challenges and interdisciplinary perspectives. 2002;
33. Torssander J, Erikson R. Stratification and mortality—A comparison of education, class, status, and income. Eur Sociol Rev. 2009;26:465–74. 34. Ratigan A, Kritz-Silverstein D, Barrett-Connor E. Sex differences in the
association of physical function and cognitive function with life satisfaction in older age: The Rancho Bernardo Study. Maturitas. 2016;89:29–35. 35. Ahacic K, Parker M, Thorslund M. Mobility limitations in the Swedish
population from 1968 to 1992: age, gender and social class differences. Aging Milan Italy. 2000;12:190–8.
36. Larsson K, Thorslund M, Kåreholt I. Are public care and services for older people targeted according to need? Applying the behavioural model on longitudinal data of a Swedish urban older population. Eur J Ageing. 2006;3:22–33. 37. Molarius A, Berglund K, Eriksson C, Eriksson HG, Lindén-Boström M,
Nordström E, et al. Mental health symptoms in relation to socio-economic conditions and lifestyle factors–a population-based study in Sweden. BMC Public Health. 2009;9:302.
38. Batty GD, Russ TC, Stamatakis E, Kivimäki M. Psychological distress and risk of peripheral vascular disease, abdominal aortic aneurysm, and heart failure: pooling of sixteen cohort studies. Atherosclerosis. 2014;236:385–8. 39. Russ TC, Stamatakis E, Hamer M, Starr JM, Kivimäki M, Batty GD. Association
between psychological distress and mortality: individual participant pooled analysis of 10 prospective cohort studies. BMJ. 2012;345:e4933.
40. Wilson R, Barnes L, Bennett D, Li Y, Bienias J, De Leon CM, et al. Proneness to psychological distress and risk of Alzheimer disease in a biracial community. Neurology. 2005;64:380–2.
41. Fritzell J, Lundberg O. Health inequalities and welfare resources: continuity and change in Sweden. Bristol: Policy Press; 2007.
42. Lennartsson C, Agahi N, Hols-Salén L, Kelfve S, Kåreholt I, Lundberg O, et al. Data resource profile: the Swedish Panel Study of living conditions of the oldest old (SWEOLD). Int J Epidemiol. 2014;43:731–8.
43. Erikson R, Goldthorpe JH. The constant flux: A study of class mobility in industrial societies. USA: Oxford University Press; 1992.
44. Roos PA, Treiman DJ. 1980. Worker functions and work traits for the 1970 U. S. census classification. In A. Miller (Ed.),Work, jobs and occupations:336–389. Washington, DC: National Academy Press; 1980.
45. Andel R, Crowe M, Pedersen NL, Mortimer J, Crimmins E, Johansson B, et al. Complexity of work and risk of Alzheimer’s disease: a population-based study of Swedish twins. J Gerontol B Psychol Sci Soc Sci. 2005;60:P251–8. 46. Mood C. Logistic regression: Why we cannot do what we think we can do,
and what we can do about it. Eur Sociol Rev. 2010;26:67–82.
47. Williams R. Generalized ordered logit/partial proportional odds models for ordinal dependent variables. Stata J. 2006;6:58.
48. DeMaris A. Explained variance in logistic regression: A Monte Carlo study of proposed measures. Sociol Methods Res. 2002;31:27–74.
49. Hardin JW, Hilbe JM, Hilbe J. Generalized linear models and extensions. Texas: Stata press; 2007.
50. Markides KS, Machalek R. Selective survival, aging and society. Arch Gerontol Geriatr. 1984;3:207–22.
51. Erikson R. Social class of men, women and families. Sociology. 1984;18:500–14. 52. Lazarsfeld PF. Interchangeability of indices in the measurement of
economic influences. J Appl Psychol. 1939;23:33.
53. Deaton A. Policy implications of the gradient of health and wealth. Health Aff (Millwood). 2002;21:13–30.
• We accept pre-submission inquiries
• Our selector tool helps you to find the most relevant journal • We provide round the clock customer support
• Convenient online submission • Thorough peer review
• Inclusion in PubMed and all major indexing services • Maximum visibility for your research
Submit your manuscript at www.biomedcentral.com/submit