INVESTIGATION OF RESIDUAL
STRESSES GENERATION IN ALUMINUM
FLYWHEEL
Afsaridis Kimon
THESIS WORK 2009
PRODUCT DEVELOPMENT AND MATERIALS
ENGINEERING
INVESTIGATION OF RESIDUAL
STRESSES GENERATION IN ALUMINUM
FLYWHEEL
Afsaridis Kimon
This thesis work is performed at Jönköping Institute of Technology within the
subject area Product Development and Materials Engineering. The work is
part of the university’s master’s degree.
The authors are responsible for the given opinions, conclusions and results.
Supervisor: Patrik Cannmo
Credit points: 30 ECTS credits
Date:
... 7
... 8 ... 8 ... 8... 9
... 9 ... 10 ... 15 ... 15 ... 18 ... 19 ... 19 ... 22 ... 22... 27
... 27 ... 27 ... 28 ... 30 ... 32 ... 37 ... 48 ... 48 ... 48 ... 51... 60
... 60 ... 67 ... 69 ... 72... 75
... 77
... 78
... 81
... 82
Figure 2.1 Chainsaw Figure 2.2 Ignition system ... 9
Figure 2.3 Aluminum Flywheel ... 9
Figure 2.4 Cold chamber HPDC machine ... 10
Figure 2.5 Hot chamber HPDC machine... 10
Figure 2.6 Metal ladling Figure 2.7 Filling process ... 11
Figure 2.8 Part ejection ... 11
Figure 2.11 Spraying process ... 12
Figure 2.9 Speed and pressure changes of the plunger during the filling in HPDC ... 12
Figure 2.10 Part Ejection... 12
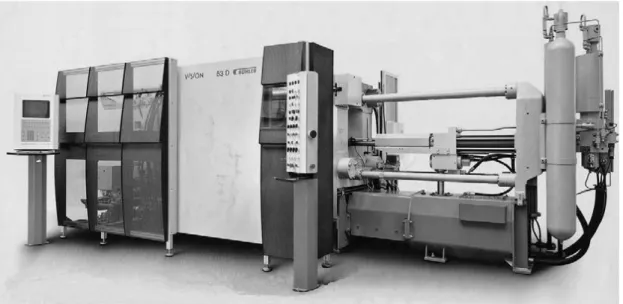
Figure 2.12 The HPDC machine which used by Husqvarna AB to produce the aluminum flywheels is Buhler SC-D42 ... 13
Figure 2.13 Types of residual stresses ... 15
Figure 2.14 A schematic illustration of the contraction of a metal during solidification ... 16
Figure 2.15 Stress lattice... 16
Figure 2.16 Thermal history and stress generation-Thin sections(2) and thick section(1) ... 17
Figure 2.17 Deformation of stress lattice ... 17
Figure 2.18 Mold filling procedure... 19
Figure 2.19 Complete model of the casted component ... 20
Figure 2.20 Basic principle of hole drilling method ... 23
Figure 2.21 Types of strain gages ... 24
Figure 3.1 Geometry of the casted flywheel ... 27
Figure 3.2 Complete casting system ... 27
Figure 3.3 Casting system in pre-processor ... 28
3.4 Control points ... 29
Figure 3.5 Meshed component with 376.401 elements... 30
Figure 3.6 Meshed component with 2.502.512 elements... 30
Figure 3.7 Critical elements of different models- Coarse mesh (left), fine mesh (right) ... 31
Figure 3.8 Material definition ... 32
Figure 3.9 Shot wave profile ... 34
Figure 3.10 Temperature distribution within Ejector and Cover die before spraying ... 37
Figure 3.11 Temperature distribution within Ejector and Cover die after spraying ... 38
Figure 3.12 Temperature of the dies at single cycle process ... 38
Figure 3.13 Temperature distribution at Ejector and Cover die before spraying ... 39
Figure 3.14 Temperature distribution at Ejector and Cover die after spraying ... 39
Figure 3.15 Temperature distribution within Ejector and Cover die before spraying ... 40
Figure 3.16 Temperature distribution within Ejector and Cover die after spraying ... 40
Figure 3.17 Filling procedure ... 41
Figure 3.18 Solidification procedure ... 42
Figure 3.19 Distorted flywheel ... 43
Figure 3.20 Cooling process and stress generation ... 44
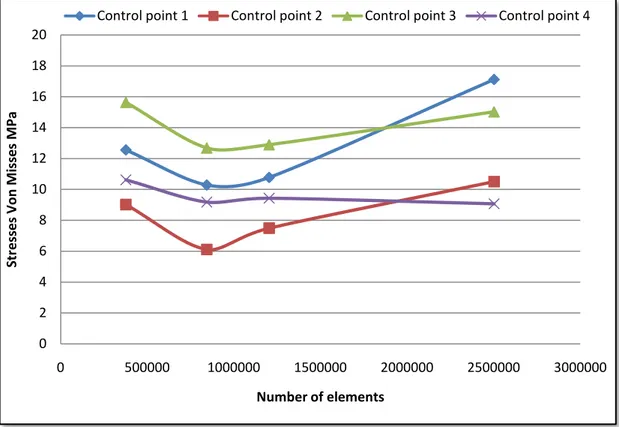
Figure 3.21 Convergence study concerning Von Misses stresses for the first four control points at depth of 0,6mm ... 45
Figure 3.22 Von Misses distribution in ambient temperature ... 46
Figure 3.23 Section where observed maximum stresses ... 46
Figure 3.24 Distribution of Maximum principle stresses ... 47
Figure 3.25 Distribution of Minimum principle stresses ... 47
Figure 3.35 Minimum Principle stresses through the hole depth at position A ... 57
Figure 3.36Maximum Principle stresses through the hole depth at position A ... 57
Figure 3.37 Von Misses stresses through the hole depth at position B ... 58
Figure 3.38Minimum Principle stresses through the hole depth at position B ... 58
Figure 3.39 Maximum Principle stresses through the hole depth at position B ... 59
Figure 4.1 Von Misses stresses through the hole depth at position A. ... 60
Figure 4.2 Von Misses stresses through the hole depth at position B. ... 61
Figure 4.3 Average value and deviation of Von Misses stresses through the hole depth at position A. 61 Figure 4.4 Average value and deviation of Von Misses stresses through the hole depth at position B.. 62
Figure 4.5 Min Principle stresses through the hole depth at position A. ... 62
Figure 4.6 Max Principle stresses through the hole depth at position A. ... 63
Figure 4.7 Min Principle stresses through the hole depth at position B. ... 63
Figure 4.8 Max Principle stresses through the hole depth at position B. ... 64
Figure 4.9 Average value and the deviation of Min and Max Principle stresses through the hole depth at position A... 64
Figure 4.10 Average value and the deviation of Min and Max Principle stresses through the hole depth at position B. ... 65
Figure 4.11 Strains distribution through the hole depth ... 66
Figure 4.12 Distribution of Von Misses stresses in the cross section area ... 67
Figure 4.13 Distribution of Min Principle stresses in the cross section area ... 67
Figure 4.14 Distribution of Max Principle stresses in the cross section area ... 68
Figure 4.15 Experimental measurement of the distorted internal rim of the flywheel ... 70
Figure 4.16 Internal rim’s measured diameter of the simulated flywheel ... 71
Figure 4.17 Von Misses stress distribution within the initial(left) and the optimized(right) model ... 72
Figure 2.1 Chainsaw Figure 2.2 Ignition system
Figure 2.5 Hot chamber HPDC machine
Figure 2.6 Metal ladling Figure 2.7 Filling process
Figure 2.11 Spraying process
Figure 2.9 Speed and pressure changes of the plunger during the filling in HPDC
Figure 2.12
The HPDC machine which used by Husqvarna AB to produce the aluminum
flywheels is Buhler SC-D42
Figure 2.14 A schematic illustration of the contraction of a metal during solidification
Figure 2.16 Thermal history and stress generation-Thin sections(2) and thick section(1)
(1)
(2)
(3)
(4)
o
o
o
o
o
o
o
(6)
(7)
(8)
Figure 3.1 Geometry of the casted flywheel
3.4
Control
points
Figure 3.5 Meshed component with 376.401 elements
Figure 3.8 Material definition
Table 3.3 Heat transfer definition
Table 3.5 Geometrical parameters
Table 3.6 Machine characteristics
Table 3.7 Filling characteristics
Figure 3.11 Temperature distribution within Ejector and Cover die after spraying
After spraying
Figure 3.13 Temperature distribution at Ejector and Cover die before spraying
After Spraying
Figure 3.15 Temperature distribution within Ejector and Cover die before spraying
Table 3.9 Solidification statistics
Figure 3.19 Distorted flywheel
Table 3.11 Convergence study
Figure 3.21 Convergence study concerning Von Misses stresses for the first four control
points at depth of 0,6mm
0 2 4 6 8 10 12 14 16 18 20 0 500000 1000000 1500000 2000000 2500000 3000000 Str e sses Vo n M isses M Pa Number of elements.
Figure 3.22 Von Misses distribution in ambient temperature
Figure 3.24 Distribution of Maximum principle stresses
Table 3.12 Drilled position
Table 3.13 Composition of aluminum alloy
Table 3.15 Process parameters
Table 3.16 Material and strain gage properties
Drilling
Table 3.17 Raw data from measurements at position A
Figure 3.32 Strain distribution through the depth
-80 -60 -40 -20 0 20 40 60 80 0 0,5 1 1,5 2 Str ai n [1E 10 -6] Depth mm Gage 1 Gage 2 Gage 3
Figure 3.33 Strain distribution through the depth
-80 -60 -40 -20 0 20 40 60 80 0 0,5 1 1,5 2 Str ai n [1E 10 -6] Depth mm Gage 1 Gage 2 Gage 3Figure 3.34 Von Misses stresses through the hole depth at position A
0 5 10 15 20 25 30 35 40 45 50 0 0,1 0,2 0,3 0,4 0,5 0,6 0,7 0,8 0,9 1 Vo n M isse s M Pa Depth mmFigure 3.35 Minimum Principle stresses through the hole depth at position A
.
-50 -40 -30 -20 -10 0 10 20 30 40 50 0 0,2 0,4 0,6 0,8 1 Sm in M Pa Depth mmFlywheel 40 Flywheel 42 Flywheel 43 Flywheel 41a Flywheel 48a
-50 -40 -30 -20 -10 0 10 20 30 40 50 0 0,2 0,4 0,6 0,8 1 Sm ax M Pa Depth mm
Figure 3.37 Von Misses stresses through the hole depth at position B
Figure 3.38Minimum Principle stresses through the hole depth at position B
0 5 10 15 20 25 30 35 40 45 0 0,1 0,2 0,3 0,4 0,5 0,6 0,7 0,8 0,9 1 Vo n M isses M Pa Depth mm -50 -40 -30 -20 -10 0 10 20 30 40 50 0 0,2 0,4 0,6 0,8 1 Sm in M Pa Depth mm
Figure 3.39 Maximum Principle stresses through the hole depth at position B
-50 -40 -30 -20 -10 0 10 20 30 40 50 0 0,2 0,4 0,6 0,8 1 Sm ax M Pa Depth mmFigure 4.1 Von Misses stresses through the hole depth at position A
.
0 5 10 15 20 25 30 35 40 45 50 0 0,1 0,2 0,3 0,4 0,5 0,6 0,7 0,8 0,9 1 Vo n M isse s M Pa Depth mmFigure 4.2 Von Misses stresses through the hole depth at position B
.
0 5 10 15 20 25 30 35 40 45 50 0 0,1 0,2 0,3 0,4 0,5 0,6 0,7 0,8 0,9 1 Vo n M isses M Pa Depth mmFlywheel 44 Flywheel 45 Flywheel 46b Flywheel 47 Flywheel 49b
0 5 10 15 20 25 30 35 40 45 50 0 0,1 0,2 0,3 0,4 0,5 0,6 0,7 0,8 0,9 1 Vo n M isses M Pa Depth mm
Figure 4.4 Average value and deviation of Von Misses stresses through the hole depth at
position B
.
Figure 4.5 Min Principle stresses through the hole depth at position A.
0 5 10 15 20 25 30 35 40 0 0,1 0,2 0,3 0,4 0,5 0,6 0,7 0,8 0,9 1 Vo n M isse s M Pa Depth mm -50 -40 -30 -20 -10 0 10 20 30 40 50 0 0,1 0,2 0,3 0,4 0,5 0,6 0,7 0,8 0,9 1 Sm in M Pa Depth mm
Figure 4.6 Max Principle stresses through the hole depth at position A.
Figure 4.7 Min Principle stresses through the hole depth at position B.
-50 -40 -30 -20 -10 0 10 20 30 40 50 0 0,1 0,2 0,3 0,4 0,5 0,6 0,7 0,8 0,9 1 Sm ax M Pa Depth mm
Flywheel 40 Flywheel 42 Flywheel 43 Flywheel 41a Flywheel 48a
-50 -40 -30 -20 -10 0 10 20 30 40 50 0 0,1 0,2 0,3 0,4 0,5 0,6 0,7 0,8 0,9 1 Sm in M Pa Depth mm
Figure 4.8 Max Principle stresses through the hole depth at position B.
Figure 4.9 Average value and the deviation of Min and Max Principle stresses through the
hole depth at position A.
-50 -40 -30 -20 -10 0 10 20 0 0,1 0,2 0,3 0,4 0,5 0,6 0,7 0,8 0,9 1 Sm ax M Pa Depth mm -50 -40 -30 -20 -10 0 10 20 30 40 50 0 0,1 0,2 0,3 0,4 0,5 0,6 0,7 0,8 0,9 1 Pr in ci p le str e sses M Pa Depth mm Smin Smax
Figure 4.10 Average value and the deviation of Min and Max Principle stresses through the
hole depth at position B.
-50 -40 -30 -20 -10 0 10 20 30 40 50 0 0,1 0,2 0,3 0,4 0,5 0,6 0,7 0,8 0,9 1 Pr in ci p le str e sses M Pa Depth mm Smin Smax
Figure 4.11 Strains distribution through the hole depth
-1000 0 1000 2000 3000 4000 5000 0 0,5 1 1,5 2 Str ai n s 1E 10 -6 Depth mm Gage 1 Gage 2 Gage 3Figure 4.12 Distribution of Von Misses stresses in the cross section area
Figure 4.14 Distribution of Max Principle stresses in the cross section area
Table 4.1 Simulated stresses at the position A in depth 0,2 and 0,6mm
Table 4.2 Simulated stresses at the position B in depth 0,2 and 0,6mm
Table 4.3 Calculated stresses from Simulations as well as from Hole drilling measurements at
the position A
Table 4.4 Calculated stresses from Simulations as well as from Hole drilling measurements at
the position B
Figure 4.16 Internal rim’s measured diameter of the simulated flywheel
Figure 4.17 Von Misses stress distribution within the initial(left) and the optimized(right) model
Table 4.5 Calculated stresses from both Simulations at the position A
A
alignment, 67Aluminum alloy AlSi9Cu3, 32 Aluminum flywheel, 2
C
Castings, 2Chainsaw, 9
Chemical composition, 49 Cold chamber machine, 10 Compressive stresses, 71, 75 Control points, 68 Convergence study, 45


![Figure 3.32 Strain distribution through the depth -80-60-40-2002040608000,511,5 2Strain [1E10-6]Depth mmGage 1Gage 2Gage 3](https://thumb-eu.123doks.com/thumbv2/5dokorg/4535438.115083/55.892.207.683.235.677/figure-strain-distribution-depth-strain-depth-mmgage-gage.webp)
![Figure 3.33 Strain distribution through the depth -80-60-40-2002040608000,511,5 2Strain[1E10-6]Depth mmGage 1Gage 2Gage 3](https://thumb-eu.123doks.com/thumbv2/5dokorg/4535438.115083/56.892.203.692.179.577/figure-strain-distribution-depth-strain-depth-mmgage-gage.webp)


