CESIS Electronic Working Paper Series
Paper No. 469
Offshoring and Innovation Capabilities: Evidence from
Swedish Manufacturing
Christopher F Baum Hans Lööf Luis Perez Andreas Stephan June, 2018The Royal Institute of technology Centre of Excellence for Science and Innovation Studies (CESIS) http://www.cesis.se
Offshoring and Innovation Capabilities:
Evidence from Swedish Manufacturing
IChristopher F Bauma,∗, Hans L¨o¨ofb, Luis Perezc, Andreas Stephand
aBoston College and DIW Berlin bKTH Royal Institute of Technology
cUniversity of Minnesota dJ¨onkoping University
Abstract
This paper examines the impact of global value chains on firms’ innovation capabili-ties. Using the United Nations Broad Economic Categories (BEC) system to identify offshoring-related intermediate imports, we study contracting out production over the period 2001–2014 from about 7,000 mainly small Swedish manufacturing firms to six different destinations and test hypotheses on improvements and outcomes of innovation capabilities. Our empirical findings show that the strategy to participate in global value chains increases firms’ innovative capability regardless of firms’ tech-nology intensity. The results are robust to a wide set of controls and in line with predictions in recent models of directed technical change.
Keywords: Offshoring, Innovation Capabilities, Technical Change, Skill Premium,
Panel Data
IDeclarations of interest: None.
∗Corresponding author. Boston College, Department of Economics, 140 Commonwealth
Av-enue, Chestnut Hill MA 02467 USA. tel +1.617.834.4615, fax +1.617.552.2308.
Email addresses: baum@bc.edu (Christopher F Baum), hans.loof@indek.kth.se (Hans L¨o¨of), luis.perez@indek.kth.se (Luis Perez), andreas.stephan@ju.se (Andreas Stephan)
1. Introduction
The existing literature on global value chains has analyzed how offshoring affects productivity, wages and employment. Theory predicts that firms should generate higher productivity due to redistribution of labor and capital, increase wage differ-ences associated with the process of skill-biased technical change, reduce low-skilled jobs and possibly increase high-skilled jobs. A comprehensive empirical literature has largely confirmed several of these hypotheses at the aggregate level. In contrast, the evidences at the firm level are mixed. Several explanations are suggested:
re-searchers cannot systematically identify offshoring at the firm level (Olsen, 2006);
the impact of offshoring might be indirect rather than direct (Akhmetova and
Fer-guson, 2015); or the causality between offshoring and firm performance is difficult
to sort out empirically (Bernard and Jensen,1999).
Innovation is a key driver of the emergence of global value chains and the frag-mentation of production. Research on how how offshoring affects companies’ inno-vation capacity is very limited. Some important key issues discussed in this sparse literature are how spatial separation of manufacturing and R&D affects
innova-tion capability (Narula,2014), and whether outsourcing enables firms to focus their
resources on activities where they have comparative advantage and increase their
innovative activities (Bloom, Draca and Van Reenen, 2016).
Outsourcing of business activities is by no means a new economic phenomenon, as it has been prevalent since the early days of industrial development. The inten-sity, however, increased rapidly in recent decades. With the advent of offshoring in the 1990s, a new phase of the contracting out phenomenon was introduced. Expla-nations for this development consider several key factors: technological advances, institutional developments favoring trade liberalization and competitive pressures
to reduce costs, and improved productivity (Olsen, 2006). The single most
impor-tant factor is the digitalization of the economy, which has opened the potential for conducting business activities in entirely new ways, and in an extended spatial area
in which a supply chain of local, regional and international firms produces various
inputs. Porter(1985) compares this value-chain process with the Ricardian principle
of comparative advantage. In line with the theoretical foundations ofCoase (1937),
he suggests that firms can increase their productivity by focusing on what they do best and outsource the rest.
As noted in the previous literature, it is difficult for the researcher to observe off-shoring at the firm level in a systematic way that allows for comparison across firms and across time. As offshoring is part of firms’ imports, it is possible take advantage of the United Nations Broad Economic Categories (BEC), which is a three-digit classification system grouping transportable goods according to their main end use: capital goods, consumer goods and intermediate goods. The latter has been applied as a proxy for offshoring. A main challenge for offshoring research based on the BEC system is that revisions imply that unique products might be classified differently over time. To account for the re-classification, we apply the algorithm suggested by
Pierce and Schott(2012) and further developed byVan Beveren, Bernard and
Van-denbussche(2012) for concording trade and production data over time, and consider
an imported product as offshored if it is classified as an intermediate good.
The aim of this paper is to contribute to the literature on the impact of global value chains on firm innovation. To do so, we examine the relationship between offshoring defined by the BEC and firms’ technological innovation capabilities. Fol-lowing prior studies, we consider these capabilities as a set of special assets includ-ing knowledge, technology, products, processes, experience, and organization that
facilitates and supports innovation (Yam, Guan, Pun and Tang, 2004). We study
offshoring to six different destinations and test hypotheses on improvements and outcomes of innovation capabilities. We first estimate the marginal effect of in-creased offshoring on skill composition and return on skills. Next, we examine the relationship between offshoring and patents and technical change, respectively.
global value chains. We also document heterogeneity in the results with respect to offshoring destinations and categories of innovation capability.
The rest of the paper is structured as follows. Section 2 briefly surveys the
relevant literature and sets forth the hypotheses of interest. Section 3 presents the
data and the outcome variables. Section4 details the empirical strategy, Section 5
reports the results, and Section6 concludes.
2. Literature Review and Hypotheses
The economic literature on the relationship between global value chains and in-novation is dominated by studies on R&D and productivity. Many studies focus on multinational firms (MNE) and foreign direct investments (FDI). For example,
Kuemmerle (1999), uses data from 136 laboratory investments in 32 MNEs to
ex-plore determinants to FDI in R&D. He finds that the relative market size and rel-ative strengths of the scientific base are important in improving existing innovation capabilities or for building new firm-specific capabilities.
Steinberg et al.(2017) distinguishes between R&D offshoring to foreign affiliates
and external foreign parties and finds that both offshoring strategies eventually harm
firms’ innovation performance when excessively employed. The analysis of
Hurtado-Torres, Arag´on-Correa and Ortiz-de Mandojana (2017) considers how geographical
diversification of firms’ R&D offshoring affects their innovation performance. Using data from 110 MNEs in the energy industry, the authors suggest that an inverted U-shape pattern exists.
An empirical issue when trying to assess the impact of contracting out research or production activities on innovation performance is how innovation can be ob-served. Prior studies often used R&D as a proxy, while the increased availability of extensive firm-level data allows for other alternatives. Successful innovation per-formance can be related to firms’ innovation capability which consists of several
the capacity of developing new products satisfying market needs, (2) the capacity of applying appropriate process technologies to produce these new products, (3) the capability of satisfying future needs by developing and introducing new products and new process technology, and (4) the capability to respond to an unanticipated technological change brought about by competitors and unforeseen circumstances. With this definition, innovation capabilities include a broad set of factors that range from supporting innovative activities to innovative outcomes.
By focusing on innovation capabilities instead of innovation, the analysis of the effects of offshoring can be extended to include a broad set of factors that support innovative activities and innovative outcomes. One of them is total factor productiv-ity (TFP), which can be considered as the ultimate outcome measure of innovation
capabilities (Hall, 2011). The relationship between offshoring and TFP has been
studied in a number of papers (see Feenstra and Hanson, 1999, Egger and Egger,
2001, Head and Ries, 2002, Kimura, 2002, Hijzen, Grg and Hine, 2003, Tomiura,
2005,Hijzen, 2007).
Innovation capabilities can also be linked to the growing literature on
directed-and trade-induced technical change (DTC) (see Acemoglu, 1998, 2002, Acemoglu
and Zilibotti,2001,Acemoglu, Gancia and Zilibotti,2015,Burstein and Vogel,2010,
Bloom, Draca and Van Reenen, 2016). This literature argues that technical change
is not neutral, but rather biased towards certain factors of production.
More recent DTC frameworks have placed offshoring at the center of the model in order to explore how it affects not only the direction and the bias of technical
change but also inequality within and across countries. For example, Burstein and
Vogel (2010) construct a model of international trade and offshoring that features
the Stolper–Samuelson effect, implying that the skill premium in skill-abundant countries increases while it is reduced in skill-scarce countries. The latter is coun-teracted by a skill bias of technology that ultimately increases the skill premium in developing, skill-scarce countries.
A recent contribution to the literature on DTC and trade is Bloom, Draca and
Van Reenen (2016), who argue that trade with less-developed countries such as
China induces technological change, diffusion and upgrading across firms. In a
broad sense, increased import competition forces domestic firms to be more produc-tive in order to ensure survival in an environment in which firms from developing countries benefit from cheaper factors of production: in this case unskilled labor. In a more subtle sense, increased self-inflicted trade may have substantial effects
within firms. Bloom et al. (2016) argue that if firms can liberate “trapped” factors
of production through offshoring, they can concentrate on innovation, which may have compositional effects in the labor force. Other channels through which trade may induce technical change include the diffusion of knowledge which is embodied in intermediate capital goods.
In summary, the prior literature on offshoring and innovation is largely focused on issues around multinational firms, foreign direct investment and the separation of research and production. More recent studies provide a richer theoretical framework for the analysis which also motivates researchers to broaden the perspective from innovation to innovation capabilities. Guided by this literature, our paper studies how global contracting out of production processes influences the skill composition of workers, the skill premium, patents and technical change expressed by total factor productivity. To do this, we test the following hypotheses:
H1: There are compositional effects on employment associated with offshoring. Offshoring allows firms to increase the relative abundance of skilled labor. H2 There is a positive association between offshoring and the skill premium. This
hypothesis corresponds to the case of Acemoglu, Gancia and Zilibotti (2015)
in which, for initial low levels of offshoring, the skill premium increases as a consequence of higher offshoring, which reinforces the bias of technical change in the direction of skilled labor.
H3: Offshoring is positively associated with innovation capabilities. As suggested
byBloom, Draca and Van Reenen(2016), offshoring may translate into higher
innovation levels when firms free up labor from production and are able to more intensively concentrate on innovation.
H4: Offshoring is positively associated with total factor productivity at the firm level. By contracting out certain less-efficient tasks, firms can increase pro-ductivity.
3. Data
The data come from two sources. The combined employer-employee dataset is ob-tained from Statistics Sweden, and covers the population of Swedish manufacturing firms (2-digit NACE Rev.2 codes 10-37) and their employees for 2001–2014. Similar to most other studies using Swedish trade data, we only consider firms with 10 or more employees, since the information provided for smaller firms is likely to be less reliable.
The employer dataset contains information on sales, value added, exports, im-ports, capital stock, corporate ownership structure and number of employees at the firm level. Continuous variables are deflated using deflators for exports, imports and producer prices provided by Statistics Sweden. Firm-level data are matched with patent data retrieved from the European Patent Office (EPO) and the OECD. By further merging these data with the employee dataset, we can access information on employees’ level of education, occupation and income levels.
We calculate our offshoring measures based in the UN Broad Economic Cat-egories (BEC) classification system to distinguish intermediate goods from other imports. Similar to the prior literature, intermediate imports are used as a proxy for offshoring.
We use two measures of offshoring. The first is intermediate imports normalized by sales, while the other is the nominal value of offshoring. We apply the first
mea-sure when estimating the impact on skill composition, skill premium and patenting. In the TFP estimation we apply the second definition.
To mitigate possible bias due to spurious correlation, we control for the potential
trends that may make jobs more likely to be offshored,1 using the Blinder index on
offshorability.2 Applying the classification method proposed byBlinder and Krueger
(2013), we first consider 430 job titles in the Swedish labor market and estimate their
offshorability. Each occupation is then classified according to whether it has a high risk of being moved abroad. We then calculate a firm-specific offshorability measure, defined as the ratio of offshorable jobs to total employment.
We also include the Osborne–Frey index (Frey and Osborne, 2017) in our
anal-yses. This index is supposed to capture the likelihood for each occupation to be replaced by computers or robots in the near future. The computed Osborne–Frey index is also firm-specific.
The main challenge in estimating total factor productivity (TFP) is that due to positive productivity shocks, firms tend to respond by expanding their level of output and by demanding more inputs, and vice versa for a negative shock. The positive correlation between the observable input levels and the unobservable productivity shocks is a source of bias in TFP.
Recent years have seen a number of methodological development of TFP
com-putation addressing this bias (Olley and Pakes, 1996, Levinsohn and Petrin, 2003,
Ackerberg, Caves and Frazer,2006, 2015,Manjn and Maez, 2016). Olley and Pakes
(1996), Levinsohn and Petrin (2003), and Ackerberg et al. (2006) contributed to
the literature proposing two-step estimation procedures, while Wooldridge (2009)
showed how to perform a consistent estimation within a single-step GMM
frame-1A wide variety of national occupations in both manufacturing and services are vulnerable to
offshoring to foreign countries. For instance, Blinder and Krueger (2013) estimate the potential offshorability to be about one-quarter of all jobs in the 2004 US workforce.
2Blinder and Krueger(2013) find that jobs that can be broken down into simple routine tasks
are easier to offshore in comparison to other more complex, non-routine tasks. The common characteristic of offshorable occupations is the lack of face-to-face contact with end users.
work. Most recently Mollisi and Rovigatti (2017) proposed a new estimator, based
on the Wooldridge approach, using dynamic panel instruments as used in the
Blun-dell and Bond (1998) methodology. In this paper, we apply the Wooldridge TFP
approach.
To control for heterogeneous levels of ability, we estimate residuals from a fully-saturated Mincer equation, defined over traditional individual variables such as age, age squared, education and gender. We take this measure as our proxy for ability and calculate the average ability of the firm’s workforce.
A growing number of studies shows the importance of corporate ownership struc-tures on productivity and managerial practices. There are not only potential differ-ences between foreign and domestic multinational firms, but also among the various categories of domestic firms. Our study separates firms in four ownership categories: non-affiliated domestic firms, uninational domestic firms (UNE), and domestic and foreign multinational firms (MNEs).
Other controls included in our regressions are measures of firm size,
industry-specific effects for 18 two-digit industries and time-industry-specific effects. Table 7 in the
Appendix lists all variables used in the analyses and provides detailed definitions for each of them.
3.1. Descriptive Statistics
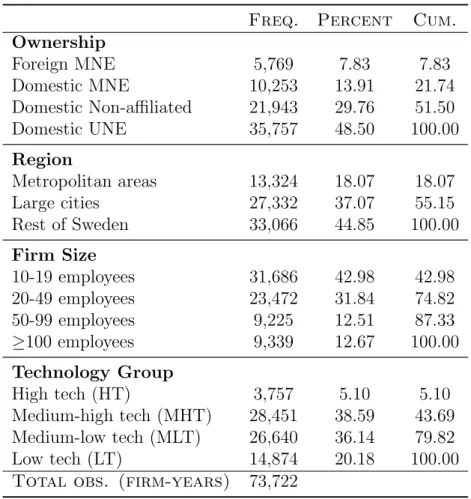
As shown in Table 1, the average annual number of firms observed is about 7,500,
which amounts to a total of 73,722 firm-year observations. There is substantial at-trition, approximately 20%, in the sample, from 8,219 firms in 2001 to 6,569 firms in 2014. Most firms in our sample are domestic non-affiliated or independent compa-nies (83%) located in non-metropolitan areas (82%), have fewer than 30 employees (60%) and are categorized as low or medium-low technology companies (57%). Only 18% of the firms are multinationals, have fifty or more employees and are located in metropolitan areas.More interestingly, only about 5% are high-technology firms.
Table 1: Descriptive Statistics for Swedish Manufacturing Firms, 2001–2014
Freq. Percent Cum.
Ownership Foreign MNE 5,769 7.83 7.83 Domestic MNE 10,253 13.91 21.74 Domestic Non-affiliated 21,943 29.76 51.50 Domestic UNE 35,757 48.50 100.00 Region Metropolitan areas 13,324 18.07 18.07 Large cities 27,332 37.07 55.15 Rest of Sweden 33,066 44.85 100.00 Firm Size 10-19 employees 31,686 42.98 42.98 20-49 employees 23,472 31.84 74.82 50-99 employees 9,225 12.51 87.33 ≥100 employees 9,339 12.67 100.00 Technology Group High tech (HT) 3,757 5.10 5.10 Medium-high tech (MHT) 28,451 38.59 43.69 Medium-low tech (MLT) 26,640 36.14 79.82 Low tech (LT) 14,874 20.18 100.00
Total obs. (firm-years) 73,722
Table notes: MNE stands for multinational enterprise and UNE for uni-national enterprise. Metropolitan areas are Stockholm, Gothenburg and M¨almo, and large cities are those with more than 100,000 residents. Technology groups were defined according to the OECD classification by taking information on R&D- and human capital intensity.
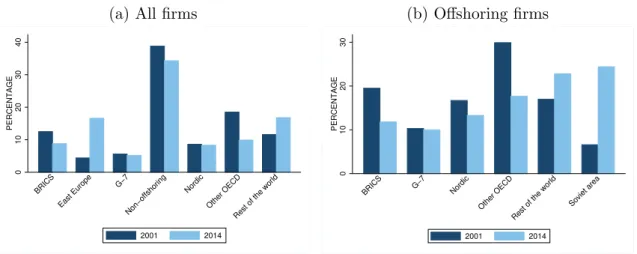
About two out of three manufacturing firms in our samples carry out offshoring
(see panel (a) in Figure1). Most firms offshore to OECD countries, (excluding the
G7), other Nordic countries and the BRICS at the beginning of the sample (see Panel
(b) in Figure1). There is, however, a substantial shift towards Eastern Europe3 and
other less-developed countries which jointly account for 50% of all offshoring in 2014, in comparison to the 20% recorded at the beginning of the sample period. When we consider the relative size of offshoring insted of fraction of offshoring firms, Table 2 shows that the OECD countries have a dominant role.
Figure2 provides a snapshot of offshoring patterns and intensity across regions
for the four different ownership categories. The relative importance of regions
(a) All firms 0 10 20 30 40 PERCENTAGE BRICS East Europe G−7 Non−offshoring Nordic Other OECD Rest of the world
2001 2014 (b) Offshoring firms 0 10 20 30 PERCENTAGE BRICS G−7 Nordic Other OECD
Rest of the world Soviet area
2001 2014
Figure 1: Offshoring Prevalence and Destination
Figure notes: BRICS are Brazil, Russia, India, China and South Africa. G-7 includes Canada, France, Germany, Italy, Japan, the United Kingdom, and the United States. Nordic Countries are Denmark, Finland, Iceland and Norway. Other OECD countries are all OECD countries except those in G-7. Soviet area considers all former members of the Soviet Union with the exception of Russia.
pears to be heterogeneous overall, but homogeneous across groups (MNEs vs. non-MNEs). Most noticeable is the relative growth of offshoring to Eastern Europe for all firms, although other less-developed countries have also benefited, as captured by “rest of the world”. Offshoring intensity varies from 93% in foreign MNEs to 42% in domestic non-affiliated companies.
Related to the potential impact of offshoring on labor market outcomes such
as income inequality, visual inspection of Figure 3 suggests that as offshoring has
increased, there has an increase in the Swedish skill premium. Another relevant observation is that about 50% of all jobs in Swedish manufacturing are potentially offshorable and only a small fraction of firms (approximately 5%) innovate.
4. Empirical Strategy
We study the impact of offshoring destination on the share of workers with higher education and also on the skill premium, which is measured as the ratio of average wages of workers with a university education relative to workers with lower educa-tion. Both variables, human capital and skill premium, are censored at 0, but only human capital is censored at 1 as skill premium has values above 1. Given the
cen-(a) Domestic MNEs 0 10 20 30 PERCENTAGE BRICS East Europe G−7 Non−offshoring Nordic Other OECD Rest of the world
2001 2014 (b) Foreign MNEs 0 10 20 30 PERCENTAGE BRICS East Europe G−7 Non−offshoring Nordic Other OECD Rest of the world
2001 2014 (c) Non-affiliated firms 0 20 40 60 PERCENTAGE BRICS East Europe G−7 Non−offshoring Nordic Other OECD Rest of the world
2001 2014 (d) Independent companies 0 10 20 30 40 50 PERCENTAGE BRICS East Europe G−7 Non−offshoring Nordic Other OECD Rest of the world
2001 2014
Figure 2: Offshoring Patterns by Destination and Ownership
.46
.48
.5
.52
.54
FRACTION OF FIRMS OFFSHORING
2001 2002 2003 2004 2005 2006 2007 2008 2009 2010 2011 2012 2013 2014 YEAR 1.1 1.12 1.14 1.16 1.18 1.2 SKILL PREMIUM 2001 2002 2003 2004 2005 2006 2007 2008 2009 2010 2011 2012 2013 2014 YEAR
Figure 3: Offshoring and the skill premium in Sweden
Figure notes: The left panel depicts the fraction of firms in Swedish manufacturing that offshore. The right panel plots the skill premium, defined as the wage ratio between university-educated and non-university educated workers, for the 75thpercentile. Both of these figures are based on firms with at least 10 employees.
are estimated as random effects Tobit models:
yit? = f (offshoring destinationit, potential offshorabilityit, workers’ abilityit,
automation potentialit, controlsit, µi, λt) + uit (1)
where
yit = yit? if y ?
it > 0 and yit = 0 otherwise.
In order to estimate how the offshoring destination affects the likelihood of in-novation, proxied by making a patent application, we specify the following model:
P r(patentit= 1) = f (offshoring destinationit, potential offshorabilityit, workers’
abilityit, automation potentialit, controlsit, µi, λt) (2)
where µi is a firm-specific error term and λtis a year effect. This model is estimated
as a random effects probit model.
Finally, we estimate the impact of offshoring on firm’s productivity, expressed as log TFP, in a dynamic specification. This model is specified as
log TFPit = f (log TFPi,t−1, log offshoringit, potential offshorabilityit, automation
potentialit, workers’ abilityit, controls, µi, λt) (3)
To estimate this dynamic panel model specification, we employ the first-difference
GMM estimator developed by Arellano and Bond (1991). This framework is
con-venient because it is relatively easy to allow for endogeneity of offshoring, which is instrumented with both its own lagged level values and external instruments to-gether with other covariates.
5. Results
In this section, we present summary statistics and estimates for the models specified
in equations (1)-(3). We employ different estimation techniques in order to gauge
the importance of offshoring on different aspects of firms’ innovation strategies.
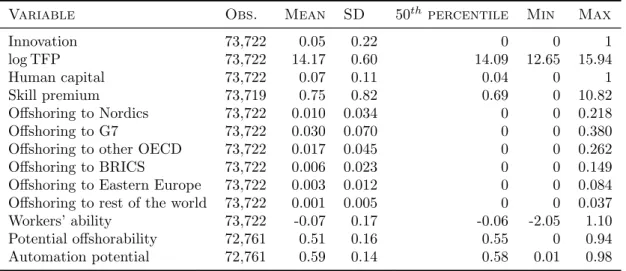
Table 2 reports summary statistics for key variables in the analysis. Only five
percent of the firms are defined as innovative according to the patent application statistics. Total factor productivity is expressed in logarithms. We define employees with three years of university education as skilled employees, and those with a lower level of education as unskilled. On average, the firms have 7% skilled employees, and the mean skill premium is 0.75.
Our main offshoring measure is reported for all six destinations in the study. The most prevalent destinations are the G7 countries and other OECD countries when offshoring is normalized by sales. We estimate a Mincer residual for each employee, assuming it can be used as a proxy for ability as a complement to human capital.
Approximately 50% of jobs are potentially offshorable as expressed by the Blin-der index, and the Osborne–Frey index suggests that 60% of the jobs in Swedish manufacturing can potentially be replaced by machines or robots. We denote this measure as Automation potential, assuming that a high value of this index reflects unexploited efficiency potential.
5.1. Labor Market Outcomes
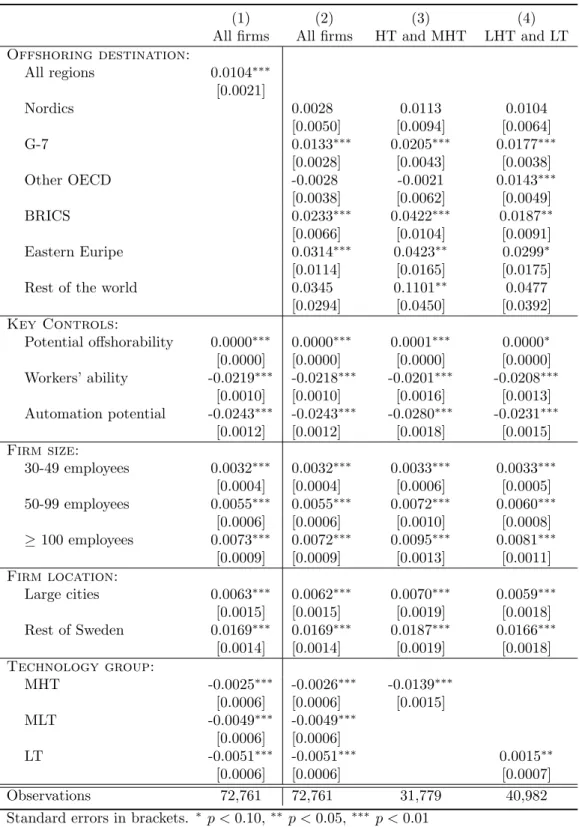
Tables3 and 4report results in four columns. The first column shows estimates for
all firms, not differentiating between offshoring destination. Columns (2)-(4) distin-guish between offshoring destination and report results for all firms, firms classified as high-technology (HT) and medium-high technology (MHT), and medium-low technology (MLT) and low technology (LT) firms, respectively.
In Table3we test hypothesis H1: whether offshoring influences employment
Table 2: Summary statistics
Variable Obs. Mean SD 50thpercentile Min Max
Innovation 73,722 0.05 0.22 0 0 1 log TFP 73,722 14.17 0.60 14.09 12.65 15.94 Human capital 73,722 0.07 0.11 0.04 0 1 Skill premium 73,719 0.75 0.82 0.69 0 10.82 Offshoring to Nordics 73,722 0.010 0.034 0 0 0.218 Offshoring to G7 73,722 0.030 0.070 0 0 0.380 Offshoring to other OECD 73,722 0.017 0.045 0 0 0.262 Offshoring to BRICS 73,722 0.006 0.023 0 0 0.149 Offshoring to Eastern Europe 73,722 0.003 0.012 0 0 0.084 Offshoring to rest of the world 73,722 0.001 0.005 0 0 0.037 Workers’ ability 73,722 -0.07 0.17 -0.06 -2.05 1.10 Potential offshorability 72,761 0.51 0.16 0.55 0 0.94 Automation potential 72,761 0.59 0.14 0.58 0.01 0.98
Table notes: Innovation is a indicator of patent application activity. Human capital is defined as the share of university-educated workers in total employment. The skill premium is the ratio of wages of university-educated to non-university educated workers. Offshoring to destination r is proxied by the value of imported intermediate goods relative to sales. Workers’ ability is the fully-saturated Mincer residual. Potential offshorability and automation potential are the computed Blinder and Frey–Osborne indexes, respectively.
and skill-biased employment composition for all firms. Column (2) presents esti-mates for all firms when distinguishing between offshoring destination, and shows a positive and significant association for the G7, BRICS and Eastern Europe. Split-ting the sample in two groups based on technology intensity, column (3) reports similar results for HT and MHT as for the entire sample, with the exception that the estimate for Rest of the world is positive and significant. The difference between columns (4) and (2) is that the estimate for other OECD countries is positive and significant in the former but not in the latter, i.e. only for LMT and LT firms.
Regarding the other covariates, all four columns are reporting that the higher is workers’ ability, as measured by the Mincer residual, the less prone firms are to increase their fraction of university-educated employees. We also see that an increased fraction of employees working with routine tasks are candidates for being replaced by automation. This fraction is associated with a decreased ratio of skilled
versus non-skilled employees. Larger firms, firms outside metro areas and high
technology firms are likely to employ relatively more skilled employees than other firms.
mea-Table 3: Occupational structures, average marginal effects
(1) (2) (3) (4)
All firms All firms HT and MHT LHT and LT Offshoring destination: All regions 0.0104∗∗∗ [0.0021] Nordics 0.0028 0.0113 0.0104 [0.0050] [0.0094] [0.0064] G-7 0.0133∗∗∗ 0.0205∗∗∗ 0.0177∗∗∗ [0.0028] [0.0043] [0.0038] Other OECD -0.0028 -0.0021 0.0143∗∗∗ [0.0038] [0.0062] [0.0049] BRICS 0.0233∗∗∗ 0.0422∗∗∗ 0.0187∗∗ [0.0066] [0.0104] [0.0091] Eastern Euripe 0.0314∗∗∗ 0.0423∗∗ 0.0299∗ [0.0114] [0.0165] [0.0175] Rest of the world 0.0345 0.1101∗∗ 0.0477
[0.0294] [0.0450] [0.0392] Key Controls: Potential offshorability 0.0000∗∗∗ 0.0000∗∗∗ 0.0001∗∗∗ 0.0000∗ [0.0000] [0.0000] [0.0000] [0.0000] Workers’ ability -0.0219∗∗∗ -0.0218∗∗∗ -0.0201∗∗∗ -0.0208∗∗∗ [0.0010] [0.0010] [0.0016] [0.0013] Automation potential -0.0243∗∗∗ -0.0243∗∗∗ -0.0280∗∗∗ -0.0231∗∗∗ [0.0012] [0.0012] [0.0018] [0.0015] Firm size: 30-49 employees 0.0032∗∗∗ 0.0032∗∗∗ 0.0033∗∗∗ 0.0033∗∗∗ [0.0004] [0.0004] [0.0006] [0.0005] 50-99 employees 0.0055∗∗∗ 0.0055∗∗∗ 0.0072∗∗∗ 0.0060∗∗∗ [0.0006] [0.0006] [0.0010] [0.0008] ≥ 100 employees 0.0073∗∗∗ 0.0072∗∗∗ 0.0095∗∗∗ 0.0081∗∗∗ [0.0009] [0.0009] [0.0013] [0.0011] Firm location: Large cities 0.0063∗∗∗ 0.0062∗∗∗ 0.0070∗∗∗ 0.0059∗∗∗ [0.0015] [0.0015] [0.0019] [0.0018] Rest of Sweden 0.0169∗∗∗ 0.0169∗∗∗ 0.0187∗∗∗ 0.0166∗∗∗ [0.0014] [0.0014] [0.0019] [0.0018] Technology group: MHT -0.0025∗∗∗ -0.0026∗∗∗ -0.0139∗∗∗ [0.0006] [0.0006] [0.0015] MLT -0.0049∗∗∗ -0.0049∗∗∗ [0.0006] [0.0006] LT -0.0051∗∗∗ -0.0051∗∗∗ 0.0015∗∗ [0.0006] [0.0006] [0.0007] Observations 72,761 72,761 31,779 40,982 Standard errors in brackets. ∗ p < 0.10,∗∗ p < 0.05,∗∗∗ p < 0.01
Table notes: Estimation is using panel-data random-effects tobit models. Dependent variable is a measure of human capital, defined as the share of university-educated workers to total employment, censored between 0 and 1. Firms with 10-29 employees, foreign MNEs, high-tech firms and firms located in Metropolitan areas are the reference groups. The measure for potential offshorability is the firm-specific Blinder index. The measure for ability is the firm-specific, fully-saturated Mincer residual. The measure for automation potential is the firm-specific Frey–Osborne index. Measures of offshoring are winsorized to exclude the 1% extreme values of the upper tail of the distribution. All regressions include ownership, firm and time fixed effects.
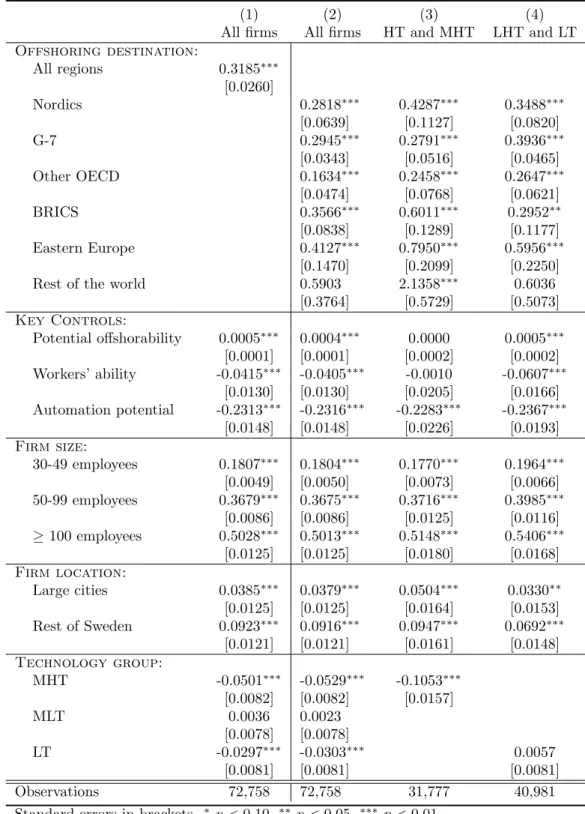
sured as the ratio of average wages of university-educated to non-university edu-cated workers. All four columns report a highly significant and positive relationship between offshoring and the skill premium. The only exception is less technology intensive firms offshoring to rest of the world, which has a positive but not statis-tically significant estimate. We conclude that the hypothesis is supported by the estimates.
5.2. Innovation and technical change
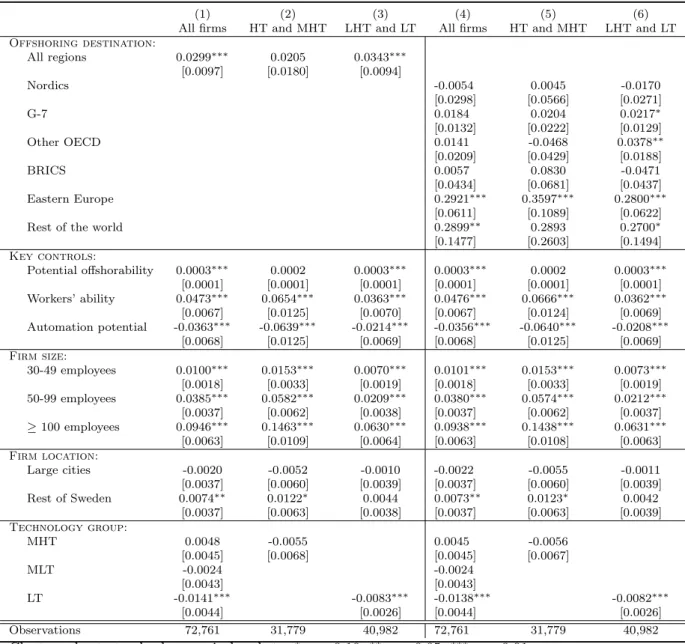
Table 5 reports average marginal effects of the propensity to apply for patents. A
priori, we assume that offshoring allows firms to switch resources from production to research. Hypothesis H3 predicts that this should be manifested through increased
innovation capabilities. The hypothesis is confirmed for offshoring to low wage
destinations, and partly for offshoring to other OECD countries (MTL and LT). Our final analysis considers total factor productivity which can be considered as a broad measure of technical change, reflecting, amongst other things, innovation capabilities. The prior literature has mainly reported a positive relationship between offshoring and TFP and this is what we test in hypothesis H4. However, what distinguishes our analysis from the existing literature is that we observe mainly small firms over a lengthy period.
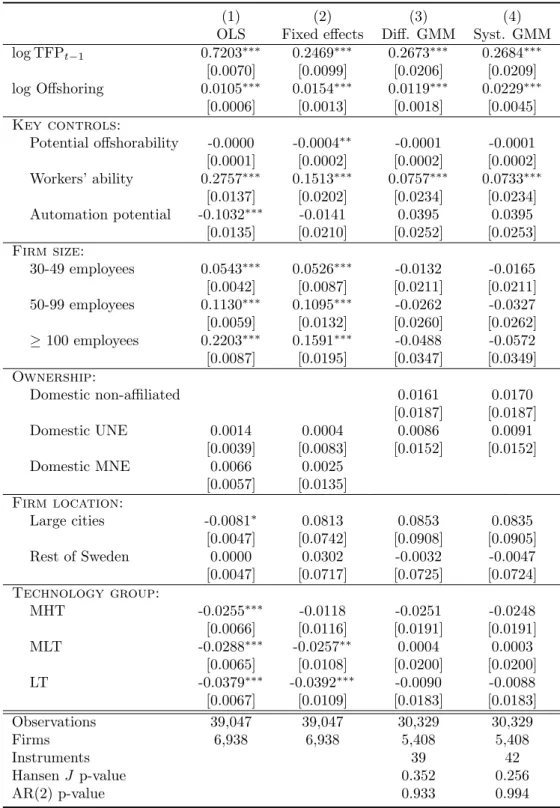
Table 6 presents results from four different dynamic models: pooled OLS, fixed
effects, difference GMM and system GMM. The two latter are estimated by the Arellano–Bond approach. In this analysis, we measure offshoring by the logarithm of its nominal value.
The two first approaches presented in columns (1) and (2) show a positive and highly significant association between offshoring and TFP. However, both the pooled OLS and fixed effects estimates are potentially biased in a dynamic setting. Columns (3) and (4) presents results from the Arellano–Bond instrumental variable estima-tor for the dynamic panel setting which allows for a causal interpretation of the estimates. Both columns show positive and highly significant coefficients on the
off-Table 4: Skill premia, average marginal effects
(1) (2) (3) (4)
All firms All firms HT and MHT LHT and LT Offshoring destination: All regions 0.3185∗∗∗ [0.0260] Nordics 0.2818∗∗∗ 0.4287∗∗∗ 0.3488∗∗∗ [0.0639] [0.1127] [0.0820] G-7 0.2945∗∗∗ 0.2791∗∗∗ 0.3936∗∗∗ [0.0343] [0.0516] [0.0465] Other OECD 0.1634∗∗∗ 0.2458∗∗∗ 0.2647∗∗∗ [0.0474] [0.0768] [0.0621] BRICS 0.3566∗∗∗ 0.6011∗∗∗ 0.2952∗∗ [0.0838] [0.1289] [0.1177] Eastern Europe 0.4127∗∗∗ 0.7950∗∗∗ 0.5956∗∗∗ [0.1470] [0.2099] [0.2250] Rest of the world 0.5903 2.1358∗∗∗ 0.6036
[0.3764] [0.5729] [0.5073] Key Controls: Potential offshorability 0.0005∗∗∗ 0.0004∗∗∗ 0.0000 0.0005∗∗∗ [0.0001] [0.0001] [0.0002] [0.0002] Workers’ ability -0.0415∗∗∗ -0.0405∗∗∗ -0.0010 -0.0607∗∗∗ [0.0130] [0.0130] [0.0205] [0.0166] Automation potential -0.2313∗∗∗ -0.2316∗∗∗ -0.2283∗∗∗ -0.2367∗∗∗ [0.0148] [0.0148] [0.0226] [0.0193] Firm size: 30-49 employees 0.1807∗∗∗ 0.1804∗∗∗ 0.1770∗∗∗ 0.1964∗∗∗ [0.0049] [0.0050] [0.0073] [0.0066] 50-99 employees 0.3679∗∗∗ 0.3675∗∗∗ 0.3716∗∗∗ 0.3985∗∗∗ [0.0086] [0.0086] [0.0125] [0.0116] ≥ 100 employees 0.5028∗∗∗ 0.5013∗∗∗ 0.5148∗∗∗ 0.5406∗∗∗ [0.0125] [0.0125] [0.0180] [0.0168] Firm location: Large cities 0.0385∗∗∗ 0.0379∗∗∗ 0.0504∗∗∗ 0.0330∗∗ [0.0125] [0.0125] [0.0164] [0.0153] Rest of Sweden 0.0923∗∗∗ 0.0916∗∗∗ 0.0947∗∗∗ 0.0692∗∗∗ [0.0121] [0.0121] [0.0161] [0.0148] Technology group: MHT -0.0501∗∗∗ -0.0529∗∗∗ -0.1053∗∗∗ [0.0082] [0.0082] [0.0157] MLT 0.0036 0.0023 [0.0078] [0.0078] LT -0.0297∗∗∗ -0.0303∗∗∗ 0.0057 [0.0081] [0.0081] [0.0081] Observations 72,758 72,758 31,777 40,981 Standard errors in brackets. ∗ p < 0.10,∗∗ p < 0.05,∗∗∗ p < 0.01
Table notes: Estimation is by panel-data, random-effects tobit models. Dependent variable is the skill premium, defined as the wage ratio of university-educated to non-university educated workers. Firms with 10-29 employees, foreign MNEs, high-tech firms and firms located in Metropolitan areas are the reference groups. The measure for ability is the firm-specific, fully-saturated Mincer residual. The measure for potential offshorability is the firm-specific computed Blinder Index. The measure for automation potential is the firm-specific Frey–Osborne index. Measures of offshoring are winsorized to exclude the 1% extreme values of the upper tail of the distribution. All regressions include ownership, firm and time fixed effects.
Table 5: Innovation capabilities, average marginal effects
(1) (2) (3) (4) (5) (6)
All firms HT and MHT LHT and LT All firms HT and MHT LHT and LT Offshoring destination: All regions 0.0299∗∗∗ 0.0205 0.0343∗∗∗ [0.0097] [0.0180] [0.0094] Nordics -0.0054 0.0045 -0.0170 [0.0298] [0.0566] [0.0271] G-7 0.0184 0.0204 0.0217∗ [0.0132] [0.0222] [0.0129] Other OECD 0.0141 -0.0468 0.0378∗∗ [0.0209] [0.0429] [0.0188] BRICS 0.0057 0.0830 -0.0471 [0.0434] [0.0681] [0.0437] Eastern Europe 0.2921∗∗∗ 0.3597∗∗∗ 0.2800∗∗∗ [0.0611] [0.1089] [0.0622] Rest of the world 0.2899∗∗ 0.2893 0.2700∗
[0.1477] [0.2603] [0.1494] Key controls: Potential offshorability 0.0003∗∗∗ 0.0002 0.0003∗∗∗ 0.0003∗∗∗ 0.0002 0.0003∗∗∗ [0.0001] [0.0001] [0.0001] [0.0001] [0.0001] [0.0001] Workers’ ability 0.0473∗∗∗ 0.0654∗∗∗ 0.0363∗∗∗ 0.0476∗∗∗ 0.0666∗∗∗ 0.0362∗∗∗ [0.0067] [0.0125] [0.0070] [0.0067] [0.0124] [0.0069] Automation potential -0.0363∗∗∗ -0.0639∗∗∗ -0.0214∗∗∗ -0.0356∗∗∗ -0.0640∗∗∗ -0.0208∗∗∗ [0.0068] [0.0125] [0.0069] [0.0068] [0.0125] [0.0069] Firm size: 30-49 employees 0.0100∗∗∗ 0.0153∗∗∗ 0.0070∗∗∗ 0.0101∗∗∗ 0.0153∗∗∗ 0.0073∗∗∗ [0.0018] [0.0033] [0.0019] [0.0018] [0.0033] [0.0019] 50-99 employees 0.0385∗∗∗ 0.0582∗∗∗ 0.0209∗∗∗ 0.0380∗∗∗ 0.0574∗∗∗ 0.0212∗∗∗ [0.0037] [0.0062] [0.0038] [0.0037] [0.0062] [0.0037] ≥ 100 employees 0.0946∗∗∗ 0.1463∗∗∗ 0.0630∗∗∗ 0.0938∗∗∗ 0.1438∗∗∗ 0.0631∗∗∗ [0.0063] [0.0109] [0.0064] [0.0063] [0.0108] [0.0063] Firm location: Large cities -0.0020 -0.0052 -0.0010 -0.0022 -0.0055 -0.0011 [0.0037] [0.0060] [0.0039] [0.0037] [0.0060] [0.0039] Rest of Sweden 0.0074∗∗ 0.0122∗ 0.0044 0.0073∗∗ 0.0123∗ 0.0042 [0.0037] [0.0063] [0.0038] [0.0037] [0.0063] [0.0039] Technology group: MHT 0.0048 -0.0055 0.0045 -0.0056 [0.0045] [0.0068] [0.0045] [0.0067] MLT -0.0024 -0.0024 [0.0043] [0.0043] LT -0.0141∗∗∗ -0.0083∗∗∗ -0.0138∗∗∗ -0.0082∗∗∗ [0.0044] [0.0026] [0.0044] [0.0026] Observations 72,761 31,779 40,982 72,761 31,779 40,982 Cluster-robust standard errors in brackets. ∗ p < 0.10,∗∗ p < 0.05, ∗∗∗ p < 0.01
Table notes: Estimation is for panel-data, random-effects probit models. Dependent variable is a dichotomous variable for patenting. Non-offshoring firms, firms with 10-29 employees, foreign MNEs, firms located in Metropolitan areas and High-tech firms (HT) constitute the reference groups. The measure for potential offshorability is the firm-specific computed Blinder index. The measure for ability is the firm-specific, fully-saturated Mincer residual. The measure for automation potential is the firm-specific Frey–Osborne index. Measures of offshoring are winsorized to exclude the 1% extreme values of the upper tail of the distribution. Regressions include ownership, firm and time fixed effects.
shoring variable. The size of the coefficient estimate is 0.011 in the difference GMM model and 0.022 in the system GMM model.
The test statistics in the foot of the table show that the instruments are valid in both Arellano–Bond estimators and that there is no serial correlation in the
differenced error terms. We therefore conclude that the estimates in Table6support
hypothesis H4.
The overall picture is that there is a clear positive link between global value chains, as reflected by an increased reliance on offshoring and different measures of improved innovative capability. In this study, we can only interpret this relationship in terms of causality with regard to the effect on total factor productivity, but the results generally support the proposition that global value chains contribute to increasing firms’ capacity for innovation.
6. Conclusion
Most prior studies on the impact of offshoring on firm innovation are based on large multinational enterprises and have a focus on research and development. The main issues are the effects of separation between R&D and production, and contracting out of innovation activities. Our study takes a different approach and examines how offshoring of production processes to six global destinations influence firms’ innovation capabilities. Guided by the literature, we consider these capabilities as a set of special assets including knowledge, technology, products, processes, experi-ence, organization that facilitates and supports innovation. The paper uses the skill composition of the workforce, the skill premium, patenting and technical change as indicators on different aspects of a firm’s innovation capability.
We exploit Swedish manufacturing data for unique firms and individuals over the period 2001–2014. More than 60% of the about 7,500 firm have less than 30 employees, fewer than 20% are MNEs, and six out of ten are classified as low-technology or low-medium low-technology firms.
Table 6: Offshoring and total factor productivity (log TFP)
(1) (2) (3) (4)
OLS Fixed effects Diff. GMM Syst. GMM log TFPt−1 0.7203∗∗∗ 0.2469∗∗∗ 0.2673∗∗∗ 0.2684∗∗∗ [0.0070] [0.0099] [0.0206] [0.0209] log Offshoring 0.0105∗∗∗ 0.0154∗∗∗ 0.0119∗∗∗ 0.0229∗∗∗ [0.0006] [0.0013] [0.0018] [0.0045] Key controls: Potential offshorability -0.0000 -0.0004∗∗ -0.0001 -0.0001 [0.0001] [0.0002] [0.0002] [0.0002] Workers’ ability 0.2757∗∗∗ 0.1513∗∗∗ 0.0757∗∗∗ 0.0733∗∗∗ [0.0137] [0.0202] [0.0234] [0.0234] Automation potential -0.1032∗∗∗ -0.0141 0.0395 0.0395 [0.0135] [0.0210] [0.0252] [0.0253] Firm size: 30-49 employees 0.0543∗∗∗ 0.0526∗∗∗ -0.0132 -0.0165 [0.0042] [0.0087] [0.0211] [0.0211] 50-99 employees 0.1130∗∗∗ 0.1095∗∗∗ -0.0262 -0.0327 [0.0059] [0.0132] [0.0260] [0.0262] ≥ 100 employees 0.2203∗∗∗ 0.1591∗∗∗ -0.0488 -0.0572 [0.0087] [0.0195] [0.0347] [0.0349] Ownership: Domestic non-affiliated 0.0161 0.0170 [0.0187] [0.0187] Domestic UNE 0.0014 0.0004 0.0086 0.0091 [0.0039] [0.0083] [0.0152] [0.0152] Domestic MNE 0.0066 0.0025 [0.0057] [0.0135] Firm location: Large cities -0.0081∗ 0.0813 0.0853 0.0835 [0.0047] [0.0742] [0.0908] [0.0905] Rest of Sweden 0.0000 0.0302 -0.0032 -0.0047 [0.0047] [0.0717] [0.0725] [0.0724] Technology group: MHT -0.0255∗∗∗ -0.0118 -0.0251 -0.0248 [0.0066] [0.0116] [0.0191] [0.0191] MLT -0.0288∗∗∗ -0.0257∗∗ 0.0004 0.0003 [0.0065] [0.0108] [0.0200] [0.0200] LT -0.0379∗∗∗ -0.0392∗∗∗ -0.0090 -0.0088 [0.0067] [0.0109] [0.0183] [0.0183] Observations 39,047 39,047 30,329 30,329 Firms 6,938 6,938 5,408 5,408 Instruments 39 42 Hansen J p-value 0.352 0.256 AR(2) p-value 0.933 0.994
Cluster-robust standard errors in brackets. ∗ p < 0.10,∗∗ p < 0.05,∗∗∗ p < 0.01
Table notes: Estimation method is reported underneath the column number. Dependent variable is total factor productivity (TFP), calculated `a laWooldridge(2009). The difference between columns (3) and (4) is that offshoring is treated as endogenous in the latter. Firms with 10-29 employees, foreign MNEs, high-tech firms and firms located in Metropolitan areas are the reference groups. Important to note is that we estimate with an absolute measure of offshoring (this avoids having productivity shocks artificially caused by sales movements). The measure for potential offshorability is the firm-specific computed Blinder index. The measure for ability is the firm-specific, fully-saturated Mincer residual. The measure for potential offshorability is the firm-specific computed Blinder index. The measure for automation potential is the firm-specific Frey-Osborne index. All regressions include firm- and time-specific effects, with the sole exception of OLS which does not include firm-specific effects.
A major challenge in longitudinal analysis of offshoring at the firm level is to observe production processes contracted out, consistently for unique firms over time. In this paper, we take advantage of the opportunity offered by the United Nations Broad Economic Categories (BEC). Using this three-digit classification system we are able to group each transportable good entering each firm according to their main end use; capital goods, consumer goods and intermediate goods. The latter is applied as our proxy for offshoring intensity.
The empirical analysis tests four different hypotheses. The first two state that offshoring allows firms to increase the relative abundance of skilled labor, and predict a positive association between offshoring and the skill premium.
Our first results show that increased offshoring is associated with a change in the skill composition of the workforce, favoring skilled workers. This result is true for offshoring to both R&D-intensive regions (G7 countries), low-cost regions (Eastern Europe) and remote countries (BRICS). The link between offshoring and skills is even stronger when we estimate the skill premium. Offshoring to all regions, except the residual ”rest of the world”, is associated with increased returns for highly educated employees relative to other employees.
Our third analysis considers patent applications and tests the prediction that contracting out may allow firms to increase their resources for innovation. The hypothesis cannot be rejected regarding offshoring to destinations characterized by relatively low wages. For other destinations, we find no significant link between offshoring and patent applications with the exception of less technology-intensive firms. Here we find a positive and significant point estimate for offshoring to other OECD countries, except the G7 and Nordic neighbors.
Finally, we provide dynamic IV estimates for total factor productivity, using both internal and external instruments. The hypothesis we test: that firms are able to increase their TFP by moving inefficient in-house activities to efficient production abroad is supported by our empirical findings.
Our results show that the strategy of participating in global value chains increases the innovative capability of Swedish manufacturing firms. The results are robust to a wide set of controls and in line with both standard economic theory and recent models of directed technical change.
6.1. Managerial relevance
What management outcome can be deduced from this study? Our data sample
is dominated by small businesses. Many smaller companies that link to global
value chains tend to trade primarily with neighboring countries, both for cost and knowledge reasons. But the results we present suggest that these companies can benefit from more distant global production, although the impact on innovation capability increases with firm size as well as technology intensity.
Acknowledgements
We use confidential research data provided by Statistics Sweden. Given strict pri-vacy regulations asssociated with these datasets, the individual-level information is not publicly available. We thank Vardan Hovsepyan at KTH Royal Institute of Technology for help with the data management, Joonas Tukhuri at MIT and Petri Rouvinen at ETLA, Helsinki for transforming the Blinder and Frey–Osborne in-dices for U.S. occupations to the Swedish context. We also thank participants at the AFSE meeting in Nice (June 2017), the ISGEP workshop at Henley Business School in London (October 2017), and the economic seminar at KTH Royal Institute of Technology in Stockholm (May 2018) for helpful comments on earlier versions of this paper.
References
Acemoglu, D. (1998), ‘Why do new technologies complement skills? Directed tech-nical change and wage inequality’, Quarterly Journal of Economics 113(4), 1055– 1089.
Acemoglu, D. (2002), ‘Directed technical change’, Review of Economic Studies 69(4), 781–809.
Acemoglu, D., Gancia, G. and Zilibotti, F. (2015), ‘Offshoring and directed technical change’, American Economic Journal: Macroeconomics 7(3), 84–122.
Acemoglu, D. and Zilibotti, F. (2001), ‘Productivity differences’, Quarterly Journal of Economics 116(2), 563–606.
Ackerberg, D. A., Caves, K. and Frazer, G. (2015), ‘Identification Properties of Recent Production Function Estimators’, Econometrica 83, 2411–2451.
Ackerberg, D., Caves, K. and Frazer, G. (2006), Structural identification of produc-tion funcproduc-tions, MPRA Paper 38349, University Library of Munich, Germany. URL: https://ideas.repec.org/p/pra/mprapa/38349.html
Adler, P. S. and Shenhar, A. (1990), ‘Adapting your technological base: The orga-nizational challenge’, MIT Sloan Management Review 32(1), 25.
Akhmetova, Z. and Ferguson, S. (2015), Offshoring, Total Factor Productivity and Skill-Biased Technological Change, Working Paper Series 1074, Research Institute of Industrial Economics.
URL: https://ideas.repec.org/p/hhs/iuiwop/1074.html
Arellano, M. and Bond, S. (1991), ‘Some Tests of Specification for Panel Data: Monte Carlo Evidence and an Application to Employment Equations’, Review of Economic Studies 58(2), 277–297.
Bernard, A. B. and Jensen, J. (1999), ‘Exceptional exporter performance: cause, effect, or both?’, Journal of International Economics 47(1), 1–25.
Blinder, A. S. and Krueger, A. B. (2013), ‘Alternative measures of offshorability: A survey approach’, Journal of Labor Economics 31(S1), S97–S128.
Bloom, N., Draca, M. and Van Reenen, J. (2016), ‘Trade Induced Technical Change? The Impact of Chinese Imports on Innovation, IT and Productivity’, Review of Economic Studies 83(1), 87–117.
URL: http://dx.doi.org/10.1093/restud/rdv039
Blundell, R. and Bond, S. (1998), ‘Initial conditions and moment restrictions in dynamic panel data models’, Journal of Econometrics 87(1), 115–143.
Burstein, A. and Vogel, J. (2010), Globalization, technology, and the skill premium: A quantitative analysis, Technical Report 16459, National Bureau of Economic Research.
Coase, R. H. (1937), ‘The nature of the firm’, Economica 4(16), 386–405.
Egger, H. and Egger, P. (2001), Market concentration and international outsourcing, Technical report, WIFO Working Papers.
Feenstra, R. C. and Hanson, G. H. (1999), ‘The impact of outsourcing and high-technology capital on wages: Estimates for the United States, 1979–1990’, Quar-terly Journal of Economics 114(3), 907–940.
Frey, C. B. and Osborne, M. A. (2017), ‘The future of employment: How suscep-tible are jobs to computerisation?’, Technological Forecasting and Social Change 114, 254 – 280.
URL: http://www.sciencedirect.com/science/article/pii/S0040162516302244 Hall, B. H. (2011), Innovation and productivity, Technical Report NBER Working
Paper No. w17178, National bureau of economic research. URL: https://ssrn.com/abstract=1879040
Head, K. and Ries, J. (2002), ‘Offshore production and skill upgrading by Japanese manufacturing firms’, Journal of international economics 58(1), 81–105.
Hijzen, A. (2007), ‘International outsourcing, technological change, and wage in-equality’, Review of International Economics 15(1), 188–205.
Hijzen, A., Grg, H. and Hine, R. C. (2003), International Fragmentation and Rel-ative Wages in the UK, IZA Discussion Papers 717, Institute for the Study of Labor (IZA).
URL: https://ideas.repec.org/p/iza/izadps/dp717.html
Hurtado-Torres, N. E., Arag´on-Correa, J. A. and Ortiz-de Mandojana, N. (2017),
‘How does r&d internationalization in multinational firms affect their innovative performance? the moderating role of international collaboration in the energy industry’, International Business Review .
Kimura, F. (2002), Subcontracting and the performance of small and medium firms in Japan, in ‘Small Firm Dynamism in East Asia’, Springer, pp. 163–175.
Kuemmerle, W. (1999), ‘The drivers of foreign direct investment into research and development: an empirical investigation’, Journal of international business studies 30(1), 1–24.
Levinsohn, J. and Petrin, A. (2003), ‘Estimating Production Functions Using Inputs to Control for Unobservables’, Review of Economic Studies 70(2), 317–341. Manjn, M. and Maez, J. (2016), ‘Production function estimation in Stata using the
AckerbergCavesFrazer method’, Stata Journal 16(4), 1046–1059. URL: https://ideas.repec.org/a/tsj/stataj/v16y2016i4p1046-1059.html
Mollisi, V. and Rovigatti, G. (2017), Theory and Practice of TFP Estimation: the Control Function Approach Using Stata, CEIS Research Paper 399, Tor Vergata University, CEIS.
URL: https://ideas.repec.org/p/rtv/ceisrp/399.html
Narula, R. (2014), ‘Exploring the paradox of competence-creating subsidiaries: Bal-ancing bandwidth and dispersion in MNEs’, Long Range Planning 47(1-2), 4–15. Olley, G. S. and Pakes, A. (1996), ‘The Dynamics of Productivity in the
Telecom-munications Equipment Industry’, Econometrica 64(6), 1263–1297.
Olsen, K. B. (2006), Productivity Impacts of Offshoring and Outsourcing: A Re-view, OECD Science, Technology and Industry Working Papers 2006/1, OECD Publishing.
URL: https://ideas.repec.org/p/oec/stiaaa/2006-1-en.html
Pierce, J. R. and Schott, P. K. (2012), ‘A concordance between ten-digit us har-monized system codes and sic/naics product classes and industries’, Journal of Economic and Social Measurement 37(1, 2), 61–96.
Porter, M. E. (1985), Competitive advantage: Creating and sustaining superior per-formance, Free Press, New York and London.
Steinberg, P. J., Procher, V. D. and Urbig, D. (2017), ‘Too much or too little of r&d offshoring: The impact of captive offshoring and contract offshoring on innovation performance’, Research Policy 46(10), 1810–1823.
Tomiura, E. (2005), ‘Foreign outsourcing and firm-level characteristics:
Evi-dence from Japanese manufacturers’, Journal of the Japanese and International Economies 19(2), 255–271.
and production data over time, Technical report, National Bureau of Economic Research.
Wooldridge, J. M. (2009), ‘On estimating firm-level production functions using proxy variables to control for unobservables’, Economics Letters 104(3), 112–114. Yam, R. C., Guan, J. C., Pun, K. F. and Tang, E. P. (2004), ‘An audit of
techno-logical innovation capabilities in chinese firms: some empirical findings in beijing, china’, Research policy 33(8), 1123–1140.
T able 7: V ariable definitions V ariable Me a sure Definition Inno v ation dumm y Dic hotomous v ariable of p ate n ting (paten ting= 1; 0, otherwise ) TFP con tin uous Calculated according to W o oldridge ( 2009 )’s approac h Human capital con tin uous, relativ e Ratio of univ ersit y-educated w ork ers to total emplo yme n t Skill premium con tin uous, relativ e Avg. w age ratio of un iv ersit y-educate to non-univ ersit y educated w ork ers Offshoring con tin uous Monetary v alu e of the in termediate go o ds imp orted Offshoring to r con tin uous, relativ e Ratio of the monetary v alue of the imp orted in termediate go o ds from region r to total in termediate imp orts P oten tial offshorabilit y con tin uous F raction of offshorable jobs, calculated as the Blinder an d Krueger ( 2013 ) index W ork ers’ abilit y con tin uous Avg. w orkforce abilit y, calculated as th e Mincer residual Automation p oten tial con tin uous F raction of p oten tially automated jobs, calculated as the F rey-Osb orne index Firm size discrete Defined o v er fiv e groups dep ending on the n um b er of emplo y e es Ownership category discrete Defined o v er four categories attending to o wnership’ s origin (domestic vs. foreign) and typ e of business e n tit y (non-affiliated, UNE, M NE) T ec hnology group discrete Defined o v er four categories (high, medium-high, medium-lo w, lo w) attending to R&D and h uman capital in tensit y Firm lo cation discrete Defined o v er three categories attending to p opulation densit y (Metrop olitan area, large cities, rest of Sw eden) T able notes: Con tin uous v ariables are absolute measures except indicated otherwise.