Volvo Group Trucks Operations Logistics Services
Analysis of material- & tied-up capital
flow in Inbound
Master Thesis
Advanced level, 30 hp
Product- and process development, Innovative production
Anna Askri
School of Innovation, Design and Engineering
Rapport nr:
Handledare, företag: Gerhard Kjellberg
Handledare, Mälardalens högskola: Antti Salonen Examinator: Sabah Audo
I ABSTRACT
This master thesis is performed on behalf of Volvo Group Trucks Operations Logistics Services in Eskilstuna, which is also the final part of the Master in Engineering program – Innovation, production and logistics at Mälardalen University.
Logistics Services central warehouse in Eskilstuna ensures that parts are available all over the world, material is transported to the production facilities, packaging is available and vehicles are distributed to the dealers. The current need is to reduce costs and improve the production process at the Inbound department. The aim of this project has been to analyze the current flow of materials and tied-up capital in the inbound flow and give improvement suggestions on reducing lead times and the tied-up capital, as well as give suggestions on common performance metrics for all the sub departments at Inbound.
The report is based on theoretical and empirical study, where the theory concerns the topics; logistics, lean philosophy and supply chain management. The empirical study was carried out by data collection through time measurements in the plant and by BEAT-report, observations and discussions with the operators, and interviews with production managers and process developers. The collected data was analyzed and the products in the flow were divided into groups, where the inbound material flow was mapped by the VSM tool. Product groups were analyzed by amount of received material reports, quantity, value and lead time, and the product groups that tied the highest value were defined as well as where in the flow the value was located. For each sub department calculations on production capacity and utilization were performed to analyze the current state and be able to compare the departments with each other. The interviews contributed with knowledge to create a reliable and valid SWOT analysis for each sub department at Inbound, where common factors could be defined concerning deviations, performance metrics and other hidden problems, but also opportunities.
Finally, in this report the current state in the Inbound department has been analyzed. Products have been categorized into groups and the materials flow mapped. It has been defined where in the flow and how much value that is tied up, and by which product groups. Hidden problems and deviations have been brought up to surface. Improvement suggestions have been given concerning decreasing of lead times and the tied up value, and also suggestions on common performance metrics for all the sub departments have been given.
II SAMMANFATTNING
Detta examensarbete är utfört på uppdrag av Volvo Group Trucks Operations Logistics Services i Eskilstuna, och är också det sista momentet inom Civilingenjörsprogrammet – Innovation, produktion och logistik på Mälardalens högskola.
Logistics Services centrallager I Eskilstuna försäkrar att delar är tillgängliga över hela världen, material transporteras till produktionsanläggningar, förpackning är tillgängligt och fordon distribueras till försäljarna. Det nuvarande behovet är att reducera kostnader och förbättra produktionsprocessen på Inbound avdelningen. Syftet i detta projekt har varit att analysera det nuvarande materialflödet och flödet av bundet kapital på Inbound avdelningen och ge förbättringsförslag för reduktion av ledtider och bundet kapital, samt ge förslag på gemensamma mätetal för alla underavdelningar på Inbound.
Rapporten baseras på teoretisk och empirisk studie, där teorin berör ämnena; logistik, lean filosofi och supply chain management. Den empiriska studien utfördes genom data insamling genom tidmätning i anläggningen och genom BEAT-rapport, observationer och diskussioner med operatörer, och intervjuer med produktionsledare samt processutvecklare. Den insamlade datan analyserades och produkterna i flödet delades in i grupper, där materialflödet i Inbound kartlades genom användning av VSM verktyget. Produktgrupperna analyserades efter antal inkommande material rapporter, kvantitet, värde och ledtid, och produktgrupperna som binder högst värde definierades samt var i flödet värdet befinner sig. För varje underavdelning genomfördes beräkningar på produktionskapacitet och utnyttjandegrad för att analysera nuläget och kunna jämföra avdelningarna med varandra. Intervjuerna bidrog med kunskap till att skapa en SWOT analys för varje underavdelning på Inbound, där gemensamma faktorer kunde definieras gällande avvikelser, mätetal och andra dolda problem, men även möjligheter. Slutligen, i denna rapport har nuläget på Inbound avdelningen analyserats. Produkter har kategoriserats i grupper och materialflödet har blivit kartlagt. Det har definierats var i flödet och hur mycket värde som är bundet, samt genom vilka produktgrupper. Dolda problem och avvikelser har förts till ytan. Förbättringsförslag har getts på reduktion av ledtider och bundet värde, och även förslag på gemensamma mätetal för alla underavdelningar.
III PREFACE
This master thesis is the last part in the Engineering degree of Innovation, production and logistics at Mälardalen University. The thesis work is executed on the behalf of Volvo Group Trucks Operations in Eskilstuna.
I would like to thank all the people that has been involved in this project and have been helpful by taking their time and answering questions and providing information. I would especially like to thank Björn Bohman and my supervisor Gerhard Kjellberg who has given me this opportunity to perform my master thesis at the Volvo Group, and also thank my supervisor for the guidance, Kim Gabrielson for the support, the production managers and process developers Lars Ekendahl, Andreas Sweström, Anders Eklund, Per-Eric Klingstedt, Sara Bäckman, Åsa Göhlman, Rickard Kindlund for the support and accommodating, and Rolf Possmark for assistance with the data collection. I would also like to thank all the people involved for showing great interest and optimism in this project.
Finally I would like to thank my mentor Antti Salonen at Mälardalen University for the guidance through this project.
Eskilstuna, 31 May 2013
Anna Askri
IV ABBREVIATION LIST
B Binning
BEAT Business Evaluation and Analysis Tool
DC Distribution Center
DMAIC Six Sigma tool; Define Measure Analyze Implement Control
EDI Electronic Data Interchange
ERP Enterprise Resource Planning
GR Goods reception
Lean Lean production, philosophy and tools for improvements
MR Material Report; see Appendix 3
PC Production Capacity
PP Pre-pack
SCM Supply Chain Management
SPIS Volvo System; Spare Parts Information System
SWOT Analysis tool; Strengths Weaknesses Opportunities Threats
VPS Volvo Production System
VSM Lean tool; Value Stream Mapping
VTC Volvo Trucks Operations
WIP Work in Process
V
T
ABLE OF CONTENTS
1. INTRODUCTION ... 1
1.1. Background ... 1
1.2. Problem statement ... 1
1.3. Aim of project and research questions ... 1
1.4. Project limitations ... 2 1.5. Company description ... 3 2. METHODOLOGY ... 6 2.1. Choice of Method ... 6 2.2. Approach ... 7 2.3. Data collection ... 8 2.4. References ... 10
2.5. Reliability and validity ... 10
3. THEORETICAL BACKGROUND ... 11
3.1. Logistics ... 11
3.2. Process mapping ... 13
3.3. Tied-up capital & logistics cost ... 15
3.4. Materials management ... 19
3.5. Information flow ... 22
3.6. Lean ... 26
3.7. Production concepts and mathematical models ... 33
3.8. Flow related metrics ... 35
3.9. Automation strategies ... 37
3.10. Analysis tools ... 38
4. CURRENT STATE ANALYSIS ... 39
4.1. Production planning ... 39
4.2. Inbound Production process ... 41
4.3. Visualization tools ... 47
4.4. Product Flows ... 48
4.5. Data collection ... 48
4.6. Flow mapping ... 77
4.7. Spaghetti diagrams of Service forklift activities ... 81
4.8. SWOT Analysis ... 84 5. RESULT ... 85 5.1. Deviations ... 87 5.2. Improvement work ... 88 5.3. Metrics ... 88 5.4. Improvement suggestions ... 89 6. CONCLUSION ... 96
7. SUGGESTIONS FOR FUTURE STUDIES ... 98
8. LIST OF REFERENCES ... 99 9. APPENDICES... I
VI
L
IST OF
F
IGURES
Figure 1 – Volvo Group production facilities. Volvo Group intranet ... 3
Figure 2 – Volvo Group Organization. GTO Presentation 2013 ver 1.0 s.5 ... 3
Figure 3 – Group Trucks Operations. GTO Presentation 2013 ver 1.0 s.12 ... 4
Figure 4 - Volvo Production System Matrix. Volvo Group intranet ... 5
Figure 5 – Logistics management process. Christopher M, 2005. S. 15. ... 11
Figure 6 - The value chain. Christopher M, 2005. S. 14 ... 12
Figure 7 - Integrated logistics. Bowersox, et al., 2010. S. 27. ... 12
Figure 8 - Mapping symbols. Oskarsson, et al., 2011. S. 175. ... 13
Figure 9 - Flow chart example. Oskarsson, et al ., 2011. S. 176. ... 13
Figure 10 - Material flow chart example. Jonsson P, 2008. S.112. ... 14
Figure 11 - VSM steps. Krajewski, et al., 2007. S. 360. ... 14
Figure 12 - VSM example. Krajewski, et al., 2007. S. 361. ... 15
Figure 13 - Value flow example. Jonsson P., 2008. S. 113. ... 19
Figure 14 - Push and pull based management. Jonsson P., 2008. S. 269. ... 20
Figure 15 - ERP application modules. Krajewski, et al., 2007. S. 625. ... 22
Figure 16 - EAN streckkod.se ... 26
Figure 17 - PDF417 streckkod.se ... 26
Figure 18 - The 4P model. Liker, 2004. S. 13 ... 27
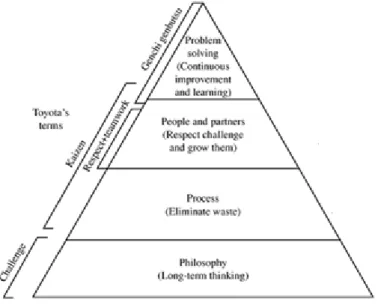
Figure 19 - The TPS house. Liker, 2004. S. 33. ... 27
Figure 20 - Single-card Kanban system. Krajewski, et al., 2007. S. 357. ... 32
Figure 21 – SWOT matrix ... 38
Figure 22 - IT landscape at GTO. SPIS System, 2013. Pp. 4. ... 39
Figure 23 - System overview at GTO. SPIS system, 2013. Pp. 7. ... 40
Figure 24 - Warehouse layout map, Sandell Tomas, 2013. ... 41
Figure 25 - Diagram of the materials flow at Inbound ... 42
Figure 26 - Layout of Goods reception department ... 43
Figure 27 - Layout of Pre-pack department ... 44
Figure 28 - Layout of Binning department ... 45
Figure 29 – Pallets in racking in IS ... 46
Figure 30 - Pallet labels ... 47
Figure 31 - Pallet label ... 47
Figure 32 – Inbound VSM Current state ... 78
Figure 33 – Rough by Pre-pack VSM Current state ... 79
Figure 34 – Fine (2, 2A, 5, 5A) by Pre-pack VSM Current state ... 80
Figure 35 - Spaghetti diagram of service forklift activities at Goods reception ... 81
VII
L
IST OF
T
ABLES
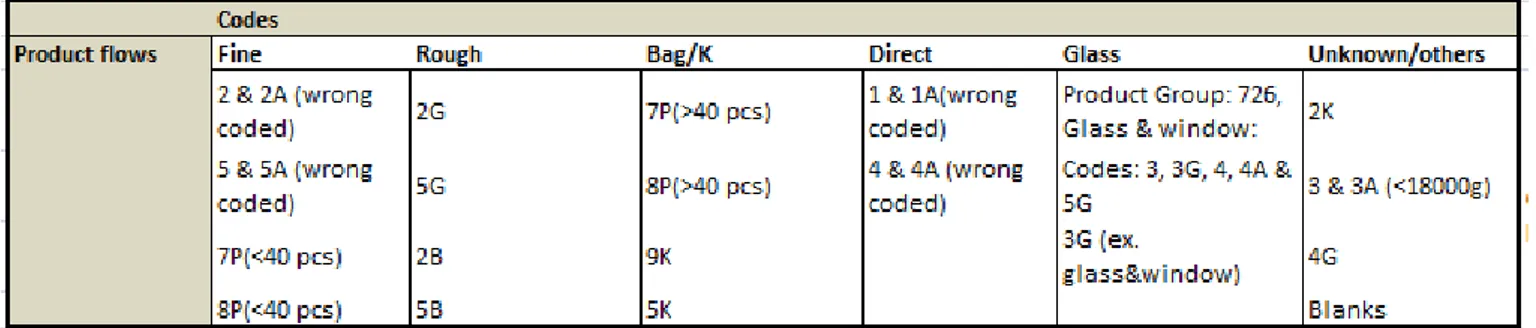
Table 1 - Table of packaging codes divided into product groups ... 48
Table 2 – Table of codes ... 48
Table 3 – GR leaving to storage ... 49
Table 4 – GR Line 1 ... 49
Table 5 – GR Line 2 ... 49
Table 6 – GR Bulky ... 49
Table 7 – PP Fine line ... 50
Table 8 – PP Rough stations ... 50
Table 9 – PP Rough Preparing ... 50
Table 10 – PP Glass station ... 50
Table 11 – Binning GH forklift S square ... 51
Table 12 – Binning GA forklift L square ... 51
Table 13 – Binning GA forklift GA square ... 51
Table 14 – GR Available hours per week ... 52
Table 15 – GR Calculations ... 52
Table 16 – PP Available hours per week ... 53
Table 17 – PP Calculations ... 53
Table 18 – Binning Available hours per week ... 54
Table 19 – Binning Calculations ... 54
Table 20 – Total value during period Oct (-12) – Jan (-13) ... 55
Table 21 – Distributed value, product groups ... 56
Table 22 – Product groups detailed data ... 61
Table 23 – Product groups value data ... 62
Table 24 – Direct flows Lead time ... 65
Table 25 – Flows by Pre-pack Lead times ... 66
Table 26 - Flows between GR and PP Lead times ... 66
Table 27 - Flows between PP and B Lead times ... 67
Table 28 – Product group flows by value ... 68
Table 29 – Product flows Tied-up value ... 69
Table 30 – Tied-up value and Lead times for the two defined product flows ... 70
Table 31 – Value comparison between departments ... 70
Table 32 - Quantity comparison between departments ... 71
Table 33 - MR comparison between departments ... 73
Table 34 - Value comparison between departments – by Pre-pack ... 74
Table 35 – Quantity comparison between departments – by Pre-pack ... 74
VIII
L
IST OF
D
IAGRAMS
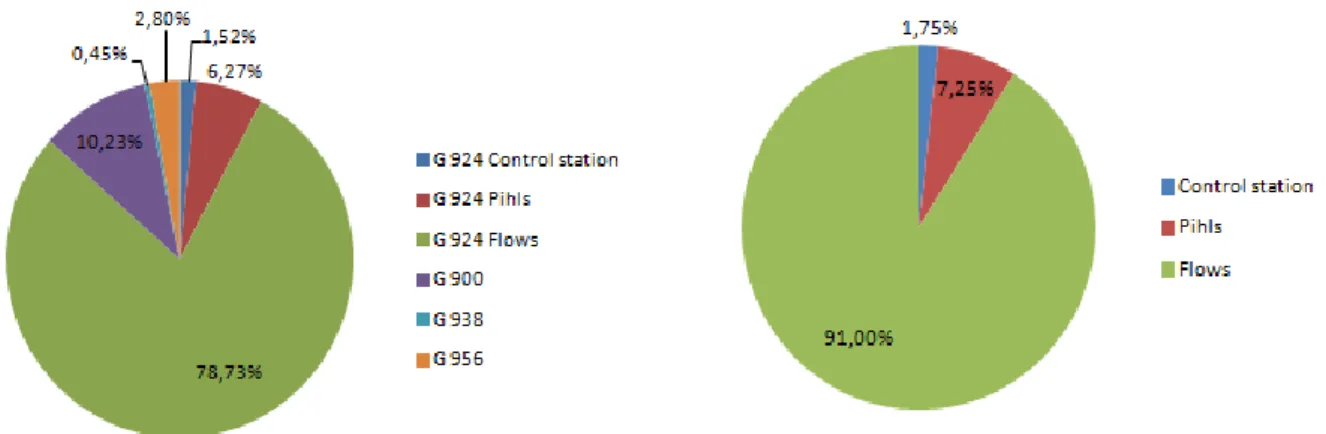
Diagram 1 - Circle diagram of total value ... 55
Diagram 2 - Circle diagram of total value ... 57
Diagram 3 - Circle diagram of value at Gate 924 ... 57
Diagram 4 – Pareto chart - Value ... 63
Diagram 5 – Pareto chart - Quantity ... 64
Diagram 6 – Pareto chart – Material reports ... 64
Diagram 7 – Pareto chart – Direct flows Lead time ... 65
Diagram 8 – Pareto chart – Flows by Pre-pack Lead times ... 66
Diagram 9 – Pareto chart – Flows between GR and PP Lead times ... 67
Diagram 10 – Pareto chart – Flows between PP and B Lead times ... 67
Diagram 11 – Product flows Tied-up value Pareto chart ... 69
Diagram 12 – Monthly Value comparison between departments ... 71
Diagram 13 – Daily Value comparison between departments ... 71
Diagram 14 – Monthly Quantity comparison between departments ... 72
Diagram 15 – Daily Quantity comparison between departments ... 72
Diagram 16 - MR comparison between departments in months ... 73
Diagram 17 - MR comparison between departments in days ... 73
Diagram 18 - Value comparison between departments in months – By Pre-pack ... 74
Diagram 19 - Quantity comparison between departments in months – by Pre-pack ... 75
Diagram 20 - MR comparison between departments in months – by Pre-pack ... 75
IX
L
IST OF
A
PPENDICES
Appendix 1 – Interviews
Appendix 2 – Data collection template
Appendix 3 – Material report reading instruction Appendix 4 – BEAT-report data sorting
Appendix 5 – Codes
Appendix 6 – Time measurements data Appendix 7 – SWOT Analysis
1
1. INTRODUCTION
In this report an empirical study is performed at the Volvo Group Truck Operations in Eskilstuna, where the general aim is to analyze the flow of materials and tied-up capital in the inbound flow and give improvement suggestions.
1.1.
B
ACKGROUNDCompanies of today gain more and more interest in lean philosophy as it is proven to provide more advantages in increased productivity but also in the competitiveness with other companies. There is focus on making production systems more efficient by balancing material flows but also the information flows in the supply chain and within the own company. (Bellgran & Säfsen, 2005; Powell, et al., 2013) There is an increased pressure on European Union manufacturers to be more flexible and innovative as result of rapid growth of low-cost economies. Surveys performed on manufacturing improvements state that the two most important strategies for competition of sales and profits in global markets are; lean production and Enterprise Resource Planning (ERP) systems. (Powell, et al., 2013) A survey performed by Hofer, et al. (2012) states that lean practices directly contributes to improved financial performance by decreasing the operating costs, as well as improved inventory leanness. (Hofer, et al., 2012) The focus of lean is continuous flow of materials and eliminating waste, however to achieve valuable future improvements it is significant to evaluate the current state and bring all problems to the surface. (Liker, 2004)
1.2.
P
ROBLEM STATEMENTToday Volvo Group has general projects with focus on reduction of tied-up capital in the supply chain. Volvo Group Truck Operations Logistic Services Eskilstuna has a need of cost reduction and better methods for following up the capital that is tied up in the chain, especially in the Inbound department. Due to the economy crises that arose in EU in the first decade of 2000 there became a need to make improvements with small means and the company is developing and improving their approach based on lean philosophy. In order to make improvements in the production process, the company needs to map and analyze the current state of materials flow. Currently the central warehouse in Eskilstuna stores 75 000 unique articles and there is a lot of value that is handled daily, which makes it important to map the flow in order to be able to reduce tied-up value.
1.3.
A
IM OF PROJECT AND RESEARCH QUESTIONSThe aim of the project is to analyze the material flow and tied-up capital in the inbound flow, to develop valuable measurements for daily management and monitoring of the tied-up capital. Through the measurements identify the development, deviations and suggest solutions that will reduce lead time and also the tied-up capital by 20%.
2
Research questions that are to be investigated in this project are following;
What is efficient material flow and how is it achieved?
What problems/deviations are there?
How is improvement work operated?
What kinds of metrics are used in the current state?
Which product flow groups stand out in terms of value, quantity, amount of material reports and lead time?
How is the value proportion between the three sub departments in Inbound?
For how long is the capital tied up in the flow and where is it tied-up?
1.4.
P
ROJECT LIMITATIONSThe project includes; from that the goods passes the gate at Distribution Center (DC) in Eskilstuna to that the article is physically in stock and reported in the system SPIS. The project is limited to 20 weeks of full-time work, which comprises 40 hours per week.
Since the warehouse in Eskilstuna handles a huge amount of different products that involves several different handling procedures such as outsourcing, control, extern warehouses etc. the project needed to be narrowed down to a more reasonable size concerning time of the project and capability. The project does not include following:
The Procurement process
The Outbound flow
Third part suppliers (e.g. Pihls)
Articles at extern warehouses
Articles on the yard
The transportation process
The kit process
The Buy back process
Delivery notes/remarks
3
1.5.
C
OMPANY DESCRIPTIONThe company was founded by Assar Gabrielsson and Gustaf Larsson in 1927 with the vision of constructing a Swedish car that could withstand the weather and the roads in Sweden. Ever since, durability has been one important part in the design of the products. Volvo cares a lot for quality, safety and the environment, thus the vision is to be the leader in sustainable transport solutions. Today the Volvo Group is one of the largest suppliers in the world regarding buses, trucks, industrial engines, construction equipment and marine. The company has established sales and marketing channels on all continents, having 115 thousand employees in twenty countries. Figure 1 shows a world map where the Volvo Group has established production facilities.
Figure 1 – Volvo Group production facilities. Volvo Group intranet
The Figure 2 shows the Volvo Group Organization. This report is based on empirical studies at the Group Trucks Operations (GTO) Logistics Services in Eskilstuna. GTO is built upon eight different units; North America Trucks Operations, Volvo Trucks Global Manufacturing, Renault Trucks Manufacturing, Asia Trucks Operations, Volvo Logistics, Volvo Powertrain Operations, Parts Logistics and Remanufacturing in Volvo Parts, Volvo Production System (VPS) and Operational Development (OD) from Volvo Technology.
4
Figure 3 shows the function of GTO in the Volvo Group. The GTO has 81 distribution centers and 50 plants, manufactures cabs and trucks for the Volvo, Renault, Mack and UD Trucks (former Nissan Diesel) brands, produces engines and transmissions of the Group, remanufactures components, provides logistics services and spare parts management for the entire Group, and provides VPS and OD support for the entire Group.
Figure 3 – Group Trucks Operations. GTO Presentation 2013 ver 1.0 s.12
The Logistics Services are world-leading supplier concerning logistics services for global vehicle-, transport- and air industry, having 5 000 employees at more than 60 locations world-wide. It is about design, handling and optimization of the supply chain concerning all brands in the Volvo Group and selected automotive industry. Logistics Services ensure that parts are available all over the world, material is transported to the production facilities, packaging is available and vehicles are distributed to the dealers. Volvo GTO has three central warehouses in Europe which are located in; Eskilstuna Sweden, Gent Belgium and Lyon France.
1.5.1. VOLVO PRODUCTION SYSTEM (VPS)
The focus of VPS is to create customer value and eliminate waste in the processes, striving to achieve sustainable profitability and operational excellence while maintaining the values of the Volvo Way. The VPS integrates the whole value chain and involving all areas and individuals to commit to the Volvo principles, helping to contribute to Volvo Group Transformation.
The VPS are principles and practices that are customer driven and people oriented to help the company achieve their best performance. The main principles are; Built-in-Quality, continuous improvement, Just-in-Time, Process stability, teamwork and The Volvo Way. The Built-in-Quality involves having a zero-defects mindset, not tolerating bad quality and eliminating the root causes. The continuous improvement is based on standardization a desired future state vision, being a driving force in the company. Producing the right thing, in the right amount and at the right time is the vision of Just-in-Time, aiming for shortest
5
possible lead times and minimal inventory. The Process stability is about understanding the operations and reducing waste and variations in the processes, by standardized work, production leveling and 5S. The Volvo Way is the company’s values, culture and leadership.
Figure 4 - Volvo Production System Matrix. Volvo Group intranet
6
2. METHODOLOGY
In order to define a scientific method it is important to define the research approach of this thesis, whether it is deductive, inductive or abductive. The deductive approach focuses on theoretical study and comparing previous theories, the inductive approach bases the research on practical knowledge and the abductive focuses on completely new hypotheses and are also the one that is least common to use. Since this project aims to investigate a real problem at a real company where a lot of practical study is required before knowing what theory to search for, this thesis will follow an inductive research approach. (Kovacs & Spens, 2006)
There are several different scientific methods that can be used when writing a thesis, the chosen methods are to be described and motivated for this particular project. To ensure the scientific credibility of the research a great awareness should be put in thought when choosing the method. (Ejvegård, 2003)
2.1.
C
HOICE OFM
ETHODA method implies to scientifically approach the subject that is chosen to be written about and how to handle it. The chosen methods will affect the whole essay. Following are four methods that has been used in this project.
2.1.1. DESCRIPTION
This method is the easiest one and simply explains how something appears or is being monitored, e.g. how an organization works or how a decision has been made. When using this method all the information that has been gathered must be categorized and sorted, and the most important information to be selected. It is important that there is a context in what is to be written, this is to be decided in the thesis object, and that the information is relevant to the subject. Often this method is empirical and being used in general issues; however it was initialized by appraising reasons. (Ejvegård, 2003)
In this case the aim of the project has been clear and all gathered information has been critically analyzed by the means of the project aim and research questions.
2.1.2. CASE STUDY
Case study aims to describe the reality by investigating a small part of multiple events. The difficulty is that one event cannot itself describe the reality and therefore it is important to be careful when drawing conclusions. The benefits of this method are that the problem statement can be unknown or be postponed to a later stage in the study, and the aim then becomes to understand rather than explain something. (Ejvegård, 2003)
In this project I have been studying the material flow at the inbound department by observations, documentation, data collections & interviews.
2.1.3. CLASSIFICATION
Classification is a method to analyze the gathered data and there are many different ways to do a classification. Examples of common classifications are genres, interests, social groups etc. To be able to analyze and draw conclusions the classification must meet certain
7
requirements. These requirements are that the classes must be reliable, valid, collectively exhaustive, mutually exclusive and there should not exist empty classes. (Ejvegård, 2003) The main classification has been by dividing products into different product flows, doing this by using the company’s own packaging codes and by this being able to categorize and separate different products from each other, making the information more manageable.
2.1.4. QUALITATIVE AND QUANTITATIVE RESEARCH
There are two types of scientific approaches, quantitative and qualitative. Quantitative research investigates how much or how many of something there is. In order to define the quantity classification must be defined. Doing a quantitative research means going through a process that involves planning-, collection- and analysis phase which in their turn involves different stages with requirement of disciplinarily. (Hartman, 2004) Something that is quantified can be calculated, expressed in digits or terms corresponding digits. Quantified data is hard data and can be expressed statistically, and with help of computer programs easily be analyzed. The hard data is easily presented by diagrams and tables. (Ejvegård, 2003) The aim of the project was very clear, based on research questions it was defined what data to investigate. The quantitative approach was collecting hard data, both primary and secondary, about lead times, products, product value etc. The qualitative approach has been interviewing the people that have been involved in the inbound department for a long time who had good knowledge, but also by observations and discussions with operators.
This project has involved a lot of hard data partly through; time measurements on production floor and partly through BEAT-reports where the company’s system stores information about all the products such as; costs, delivery times, packaging codes etc. The measured time data has been analyzed and evaluated together with Kim Gabrielson who performs measurements for Value Stream Mapping, to state its validity. The systems data has been carefully analyzed and sorted in an excel file both manually and in some extent automatically by pivot tables, with help by Rolf Possmark and my supervisor Gerhard Kjellberg.
2.2.
A
PPROACHIn combination with earlier mentioned methods it will be suitable to use the Six Sigma improvement model DMAIC, which stands for;
Define: Defining the process by flowcharts and process charts and finding the critical parts in the processes output.
Measure: Collecting data of the process by quantifying the work. Define what to measure and prepare a data collection plan.
Analyze: Analyze the data that has been collected in order to improve the process, using different analysis tools such as Pareto charts, cause and effect diagrams etc.
Improve: Adjust or redesign current methods in order to improve the process.
Control: Monitor the process in order to control the new performance levels, by using the analysis tools. (Krajewski, 2007)
8
Following the DMAIC steps will help taking control over the project and combined with Gantt-chart planning, milestones in the project have been set to get an organized and structured project time plan.
2.3.
D
ATA COLLECTIONThere are two types of data; primary and secondary. Primary data concerns measurements and quantifications, where three typical strategies are observations, interviews and surveys. The primary aim is to gain basis for the research analysis. Secondary data implies information that has been previously collected for other purposes, but can be relevant for the current research. (Befring, 1994)
Primary data includes time measurements on the floor and BEAT reports about product information. Secondary data concerns company presentation, daily measurements data and diagrams, process maps and directives, some time measurements done by Kim Gabrielsson and previous Value stream maps.
2.3.1. LITERATURE STUDY
Literature study implies studying all written material such as books, articles, reports, essays etc. The most appropriate is to use library databases and search for information with different keywords. Researchers always use references in their works and these references may be interesting to use as well. (Ejvegård, 2003)
Literature such as books has been partly collected at the University’s library and partly from previous courses included in the study program. Some books have been found by checking references in similar literatures. Scientific articles have been collected by using the university’s database Discovery that searches through a wide range of other scientific databases. Main key word for finding appropriate literature has been; lean production, supply chain management, logistics, tied-up capital, logistics management, scientific thinking- and methods.
9
2.3.2. INTERVIEWS
An interview aims to find out the characteristics of what is being investigated by the knowledge of the person that is being interviewed. An interview can be quantitative by doing surveys where the answers often are yes or no, or are expressed as a value on a scale. A qualitative interview does not involve leading questions and strives for open answers. (Hartman, 2004) It is important to be careful when choosing who to interview and carefully prepare the interview, since interviews takes a lot of time to process. The best way to perform an interview is by using a recorder and then be able to calmly go through the interview afterwards. The interview can always be documented by taking notes, however it has shown to have an inhibitory impact on the interviewer. (Ejvegård, 2003)
The interviews have been documented partly by using recorder and taking notes and partly by email. The persons interviewed are all deeply involved with the inbound processes and flow as they are production managers and process developers. The questions asked are of qualitative value that encourages individual answers where there are no rights or wrongs. The aim was to find valuable information of both negative as well as positive aspects at inbound. Equalities in point of view of the processes states the importance in that specific problem or question as well as differences rises up questions that may not have had as big focus.
2.3.3. OBSERVATIONS
Observation can appear in two ways; either to gain knowledge of behaviors and events, or as physical measurements to investigate reactions and actions. The advantage of observations is that the reality may be different to what has been said during an interview. The memory can be deceptive and then the answers become invalid. By observing it is easier to find out how something really appears, and for example find the root cause of a problem. A negative aspect of observing is that it is time consuming. (Hartman, 2004) The researcher performs the observations by listening, watching, feeling, experiencing and registering the impressions. Since the researcher is in himself a measuring instrument he must be aware of errors, preconceptions and expectations. Using a structured observation- and assessment scheme will help the process to become systematic. (Befring, 1994)
The observations have been performed during the whole project by discussing with workers, managers, developers and when measuring times. Many times it has been obvious that some people that have worked to long with a specific task were somewhat blind to why some specific things occurred, and they did not reflect on whether it was in their favor or disadvantage. Also discussing with people sometimes only gave parts of information, while after observing the information gaps were filled. Observations are time consuming indeed, however it was a natural activity while measuring times and easily documented in the notebook.
2.3.4. DOCUMENTATION
Documentation data is very important for the current state analysis in the project. (Befring, 1994) During the project information from the company’s intranet and database has been used to collect secondary data such as graphs, layout maps, measured times, presentations etc. and
10
also primary data that has been compiled for this specific project and also the measuring of production times.
2.4.
R
EFERENCESWhen gathering information through literature study it is important to be critical against the reliability of the source and the validity of the information. The information must be objective, if something seems strange it must be controlled. Critically studying information there must be a consideration if the material is; genuine, independent, recent and contemporaneous. (Ejvegård, 2003) Source criticism aims valuing the information by the relevance and usability to the current research. (Befring, 1994)
The literature used in this report has been collected carefully, by starting out with relevant course literature and then searching for literature recommended from these books. Also searching for relevant key words at the University’s library and database, and checking if the year of the book is of validity and reliability to this project.
2.5.
R
ELIABILITY AND VALIDITYEjvegård describes reliability as credibility and usability of measuring instruments and unit of measurements. If a measuring tape shows different measuring units when measuring twice e.g. the same box then it is not reliable, neither is a rubber band a reliable tool for measuring. It is important to be critical concerning whether the measurements are reliable or not, if something seems strange it should be controlled. Validity refers to whether the measurements are what really need to be measured. There should be clear measurement methods and units of measurement e.g. if ranking countries by size of population or square kilometers. It is important to know what the unit stands for and if it is consistent. (Ejvegård, 2003)
Time measurements have been performed by using timekeepers, performed together with Kim Gabrielson. Before staring measuring we decided a standard of what to measure and how to do it, also using a specifically developed template. The measurements were compared to each other and also to previously measurements from another project.
The data from the company’s system were compiled from a BEAT-report by Rolf Possmark who is the IT coordinator and daily works with developing different kind of data reports. By careful analysis errors occurring was identified and adjusted easily, and data such as costs were compared to another system by Gerhard Kjellberg to state the reliability of the numbers.
11
3. THEORETICAL
BACKGROUND
3.1.
L
OGISTICSLogistics can be described as the efficient flow of materials from raw material to end user, but also the reversed flow of material that comes with defected products, recycling etc. Figure 5 illustrates this. (Jonsson, 2008; Christopher, 2005) During the past twenty years logistics has developed from having focused on dealing with transports and storage to become an important part of a company’s competitive strategy. One way of describing a modern logistics point of view quoted by Oskarsson, et al. (2006) is that “logistics is an important factor when it comes to creating competitiveness and profitability for many companies”. The goal of logistics is to deliver the desired product to the customer at the right place and the right time at a reasonable cost. Logistics covers planning and implementing, but also controlling that the output was a desired result. (Oskarsson, et al 2006)
Figure 5 – Logistics management process. Christopher M, 2005. S. 15.
An important part of the logistics is the total cost, which is effected by the decisions that are made e.g. when wanting to implement a change in a process. The most general logistics costs are; transportation-, handling-, inventory-carrying- and administrative costs, these will be described further on in the report. Another important part of logistics is the delivery service which can be divided into six delivery service elements (Oskarsson, et al 2006);
1. Lead time – time from order to delivery
2. Delivery reliability - the reliability in the lead time
3. Delivery dependability – the right product at the right time with the right quality 4. Information – the importance of the information flow between all parties involved 5. Flexibility – the ability of customization
6. Stock availability - the amount of orders that can be delivered directly (Oskarsson, et al 2006)
The link between the total logistics cost and delivery service is achieving high delivery service at low costs. (Oskarsson, et al 2006; Christopher, 2005) In practice the level of delivery service is set and the costs are reduced accordingly. However there is a limit of how high the delivery service can be, since it sometimes doesn’t provide any further value to the total products profitability. There is a “highest delivery service” that is profitable that falls
Suppliers Procurement Operations Distribution Customers
Materials flow
12
between 95-99%. Being able to deliver in all types of situations will lead to endless costs. (Oskarsson, et al 2006)
3.1.1. SUPPLY CHAIN MANAGEMENT
Supply chain management (SCM) is a wider concept than logistics and builds on the logistics framework of creating a plan for the product and information flow, seeking a link and coordination between all the parts in the chain such as customer and supplier and the own organization. The management thinking has developed during the past two decades and in the search for new strategies of providing great customer value Michael Porter developed the concept of value chain. The value chain can be divided into two activity categories; the primary (operations, inbound logistics, outbound logistics, service, marketing and sales) and support activities (human resource
management, infrastructure, procurement and technology development), illustrated in Figure 6. The competitive advantages arise depending on how these activities are organized by a company within the value chain, by performing them efficiently or uniquely a greater differentiation can be made against the rivals. (Christopher, 2005)
According to SCM the purpose of logistics is to move and position inventory at the right time, place and cost. Until the inventory is positioned it has limited value and does not support value-added creation. To realize the maximum strategic logistics benefits there must be integration between all the functional works. A successful implementation of integrated logistics management is challenged by the interrelation of functions. Figure 7 shows the five areas of logistics work that by integration creates value capabilities are; order processing, inventory, transportation, warehousing and material handling, and facility network. (Bowersox, et al., 2005)
Figure 7 - Integrated logistics. Bowersox, et al., 2010. S. 27.
13
3.2.
P
ROCESS MAPPINGIn order to find an alternative solution and improvement a current state analysis must be done. The first step is to map the material- and information flow to clarify the amount of activities, storage etc. that is in the flow and what alternatives there is, and also departments and people that are involved. (Oskarsson, et al., 2006)
The mapping of flow can be performed in many ways. The most common symbols that are used in the mapping process are seen in Figure 8. The rectangles represent something that is being performed, which can be refined operations or activities or departments. The triangles represent stocks that are in the flow which can be material stock, output buffer or finished goods inventory. The decision points can help when describing alternative flow directions and the computer system and paper documents are sometimes necessary to show a clear picture of the information flow. It is important to use symbols and draw maps in a way that is distinct, understandable and sufficiently comprehensive to those who will use the maps. Figure 9 shows an exapmle of a simple flow chart. (Oskarsson, et al., 2006)
Figure 8 - Mapping symbols. Oskarsson, et al., 2011. S. 175.
Figure 9 - Flow chart example. Oskarsson, et al ., 2011. S. 176.
Flow mapping can be more or less detailed and a lot of time is required if it is to be done thoroughly. Since time is often limited it is important to focus on the right parts. In order to avoid spending time on the wrong things a refinement of the most interesting parts in the flow is necessary, which is determined by metrics. If the aim is to decrease the time and speed up the flow then it is interesting to find the most time consuming activity and then other details are therefore less interesting in this case. (Oskarsson, et al., 2006)
3.2.1. MATERIAL FLOW MAPPING
A good way of starting analyzing tied-up capital and logistics costs is to map the materials flow, which can be done with different charts. This is a good basis for the work of reducing throughput time in order to lower the tied-up capital costs. (Jonsson, 2008) However Value
14
Stream Mapping can be a better way to map the material flow since it takes in account more factors in the chain. (Krajewski, et al., 2007) Figure 10 illustrates an example of a material flow chart.
Figure 10 - Material flow chart example. Jonsson P, 2008. S.112.
3.2.2. VALUE STREAM MAPPING
Value stream mapping (VSM) is a qualitative tool that aims of eliminating waste, which sometimes can be up to 60 percent high. The tool gives a visual picture as a map of the processes involved in the material flow. The VSM shows the whole value chain from the ordering receipt to delivery of finished products. The VSM offers more information than the usual flowchart which helps identifying waste time activities. The VSM consists of current state drawing, future state drawing and an implementation plan. The information for the VSM can be collected at the shop floors such as cycle time, batch size, number of operators etc. (Krajewski, et al., 2007) The first step in value stream mapping is breaking down the full range of products into managable groups (Bicheno, 2004), Figure 11 illustrates the process of value stream mapping. An example of a value stream map is shown in Figure 12.
Product family Current state drawing Future state drawing implementation Work plan and
15
Figure 12 - VSM example. Krajewski, et al., 2007. S. 361.
3.2.3. SPAGHETTI DIAGRAM
The spaghetti diagram is a simple tool for mapping products flow or material handling routes. Using a layout diagram of the plant and tracing the physical flow of the product, it is easy to mark storage locations and draw flow paths. The total length of the flow should be calculated including travel length. Using this tool it is easy to identify poor layout and wasteful movement. Parts are not supposed to be outspread in many locations, lean layout inventory should be grouped into supermarkets driven by pull. The spaghetti diagram is a good tool to shape type of routes. (Bicheno, 2004)
3.3.
T
IED-
UP CAPITAL&
LOGISTICS COSTThe profitability of a company and it costs are directly affected by the tied-up capital. A supply chain or logistics system can use logistics cost and tied-up capital as performance variables. In order to measure and control the existing performance, the existing costs must be identified. It is also important to compare the logistics cost with other logistics goals. (Jonsson, 2008)
3.3.1. LOGISTICS COST
Logistics costs are linked to the logistics activities and can be divided into direct and indirect costs. Direct costs are e.g. costs of physical handling, storage and transportation of materials as well as tied-up capital and administration costs. Indirect costs are e.g. capacity and shortage costs. The logistics cost can be defined for a specific process, organization or a network of companies. The total logistics costs can be described by following (Jonsson, 2008);
Transportation and handling costs
Packaging costs
Inventory-carrying costs
16
Ordering costs
Capacity-related costs
Shortage and delay costs
Environmental costs
Since many partial costs can be included in more than one of the eight above mentioned cost types, it is important to be careful and not to count the costs more than once. The total logistics costs size vary depending on the definition of logistics costs, which industry and what country the company operates in, but also the structure of the network and the role of the company in the logistics network. For a manufacturing company the direct logistics costs lies between 10 to 30 percent of the turnover. (Jonsson, 2008)
3.3.1.1. Transportation and handling
These costs relate to the moving of goods and are divided into internal and external transportation. The internal transportation refers to material handling activities such as packaging, picking and internal movements and these costs can be included in the inventory carrying or storage costs. The external costs refer to loading, moving, reloading and unloading goods to and from the supplier and customer or within the company’s own plants. The external transportation can be handled by internal or external resources. Sometimes when delivery is free it may be hard to break down the transportation costs since they are hidden in the price of the product. The goods that are being transported represent tied-up capital and are therefore a part of total transportation costs. In general the transportation cost makes a small part of the total logistics cost, but can be higher in industries where dealing with high value goods. (Jonsson, 2008)
3.3.1.2. Packaging
These costs include all the material packaging, packing and marking costs. For reusable packages there are also costs for administration, storage, transportation and reconditioning. (Jonsson, 2008)
3.3.1.3. Inventory carrying
These costs are the costs for having goods in stock and depend on the stored quantity. They are consisting of financial, physical and uncertainty costs. The financial costs are the required return the company puts on capital which is tied up in stock. The physical are the operating costs for the storage and the uncertainty is associated with the risk of keeping materials in stock. In many companies the inventory carrying costs are the largest part in the logistics cost. To estimate inventory carrying costs there must first be an estimation done of the capital, storage- and uncertainty costs. (Jonsson, 2008)
Capital costs - To evaluate the inventory carrying costs the materials in stock can be treated as investment in current assets which means it is required return for capital tied up in stock. If it would not have been tied up in stock it could have been an investment for the company in another way. (Jonsson, 2008)
Storage costs - These costs are cost for personnel, energy, internal transportation, administration, equipment and depreciation. (Jonsson, 2008)
17
Uncertainty costs - There are uncertainties and risk of keeping materials in storage. Large volumes lead often to more broken items since the handling increases, and also to longer storage times. Items that cannot be sold or are outdated must be scrapped or sold at a reduced price. Another uncertainty is missing articles that the company cannot gain money from and loss of stock may depend on poor administration and storage system. Costs will then occur due to wrong delivery of items or quantities in terms of error correction such as extra picking, freight transport and administration. Sometimes the wrong delivered items may even disappear when arrived to the customer, and never be returned. When storing in different regional warehouses shortage may occur which results in items having to be transferred between the warehouses. The most common reason for this is that demand allocation did not follow the forecasts. Re-localization is also a cost of the total uncertainty costs. (Jonsson, 2008)
3.3.1.4. Administrative
These costs refer to longtime planning material flows operative management. The primary costs are for the personnel of administration, but it also includes costs of communication systems and procurement. (Jonsson, 2008)
3.3.1.5. Ordering
These costs refers to the processing of purchase and manufacture orders. When deciding of lot sizing it is the incremental cost that is interesting, and can be divided into four parts:
Re-tooling set up costs - The time it takes to change the manufacturing process from one to another.
Costs for capacity losses - How large costs are depends on the utilization of capacity in the production process and purchasing organization. The time spent at full capacity leads to increased costs due to personnel and consumables, and could have been used for something more value-adding.
Material-handling costs – E.g. the arrival controls, goods reception, placing in stores & transportation.
Order processing costs - If it is a purchasing situation these costs involves all the costs for processing orders for the planning department, accounts department and purchasing department, transferring the order to a supplier. If it is a manufacturing situation the costs refers to the planning, order release and recalling.
(Jonsson, 2008)
3.3.1.6. Capacity-related
Capacity costs refer to the personnel, machines and plants, the costs of operation and maintenance. The costs may be influenced by the degree of utilization of the equipment and as they are fixed costs a high degree of utilization can reduce items cost price. If the utilization of capacity is high it automatically will lead to higher costs due to e.g. shifts, overtime work, more transportation and subcontracting. (Jonsson, 2008)
18
3.3.1.7. Shortage and delay
If a delivery cannot take place due to a customer’s wishes a shortage cost arise, and it has direct connection with customer services which aims to creating value and generating revenues. The worst thing that could happen is that due to a delivery loss also the customer is lost, otherwise in a less serious situation the customer remains but sale is lost. Items that are more difficult to replace leads to more costs such as overtime work and express transportation, even extra cost due to damage may occur. (Jonsson, 2008)
3.3.1.8. Environmental
Environmental costs are hard to estimate since the effect is long term and many factors affect the environment indirectly. Selection of transportation affects the environment in different ways, but also the packaging of goods affects the choice of transportation. (Jonsson, 2008)
3.3.2. TIED-UP CAPITAL
The assets of a company consist of fixed and current assets and when doing investments the capital is tied up. This affects the cash flow of the company and its ability to pay. A part of the current assets is the material flow in the supply chain and influences affects the total tied up capital in the company. It is required to calculate the amount tied up capital in order to measure and analyze the logistics performance. The average tied up capital shows the amount of capital tied up in the material flow, work in process, stores, transportation and stocks etc. (Jonsson, 2008)
The tied up capital can be expressed in inventory turnover (ITR), absolute figures or average throughput time in current storage points. If the need is to compare tied up capital between different stocks or departments, the absolute figures is not recommended, also the same applies to comparing tied up capital over time periods. A better way is to use ITR, which is easy to measure and easily compares different measurement points. The ITR shows how many times per years the stock turn over and it shows the value of materials during a specific time period, usually a year in relation to the average capital during the same time period that was tied up in material flows. (Jonsson, 2008)
However it is more interesting to calculate the ITR for a group of items or for all items in stock. The turnover is then expressed as the outbound delivery value for a period of time and average tied-up capital. A problem when calculating the ITR is that the annual turnover often is expressed by the goods value based on the sales price, while the tied up capital is expressed as the value in stock based on the cost price. To correct this when calculating the same valuation is required for the turnover and capital tied up, which is the costs for goods sold. One way to notice if the calculation is based on different valuations is that the ITR increases if the sales price increases, despite the fact that the average stock remains the same – which is incorrect. (Jonsson, 2008)
The average ITR is calculated by:
ITR =
19
An alternative to ITR is to calculate the average stock throughput time, if ITR increases the stock throughput will decrease and otherwise.
The average throughput time is calculated by:
Average throughput time = =
The factor 52 stands for the throughput time expressed in weeks, otherwise it will be expressed in years. (Jonsson, 2008)
3.3.2.1. Tied-up capital mapping
Tied-up capital exists along the entire flow from supplier to customer and occurs in stocks of raw material, work in process, stocks of finished goods and distribution stores. To be able to reduce the tied-up capital, mapping is required in order to study the flow in a structured way. In order to do the mapping it is needed to collect relevant information about which items that moves in which sub-flows, and in which stocks, transportations and operations. Another important information is the size of flow for each item per time period (can be measured as consumption over time), the value of items in the flow and average stock quantities. For internally produced items flows and stocks can be valued at standard costs and for purchased items at an average purchase price. (Jonsson, 2008) Figure 13 illustrates an example of value flow mapping.
Figure 13 - Value flow example. Jonsson P., 2008. S. 113.
3.4.
M
ATERIALS MANAGEMENTThe flows of materials are initiated by different orders, which are defined by the quantity that will be transported from a supplying to a consuming unit and the time for availability. Stocks increase due to the material from inbound flows from the supplying units and decrease due to consumption. (Jonsson, 2008)
The purpose of purchasing and manufacturing orders is to initiate the flow of materials and to satisfy the current requirements. The aim of materials management is to determine the time and quantities for all items order, and the goal is to do as efficiently as possible taking in
20
consideration the tied-up capital, utilization of resources and delivery service. Four questions materials management should be able to answer are (Jonsson, 2008);
1. Which items are the orders planned for? (item question) 2. What is the item quantity? (quantity question)
3. When must the order for each item be delivered to production, customer or stock? (delivery time question)
4. When must the order for each item be transferred to supplier or internal production? (start time question)
To understand how the materials flow are connected, being able to choose the right materials planning method it is good to separate the independent and dependant demand. Independent demand items have no connection with other items demand and are stocked for delivery to customers, usually being standard products. Dependant demand is the opposite of independent demand and means that one items demand is possible to trace from another items demand e.g. items that are input in other items production. It is very common that dependent demand items also have an independent demand, where the item is sold separately as well as a part of another product. (Jonsson, 2008)
In materials management it is important to as cost-efficiently as possible balance the materials requirements with availability. If the demand is higher than the supply then the materials flow must be increased by planning new orders, if the demand is lower than the supply then the inbound deliveries of the planned and released order must be delayed. The effect of bad balance between demand and supply results in; large stocks if the supply is too high, or poor delivery capacity and shortage if the demand is too high. (Jonsson, 2008)
The current supply is represented by the stocks while the future supply is represented by the planned inbound delivery. The demand is expressed as forecasts, customer allocations, allocations for manufacturing orders and aggregate gross requirement. Allocation represents the most certain information of future requirements while forecasts represent the least reliable and certain information. (Jonsson, 2008)
Materials management can be based on push or pull factors, illustrated by Figure 14, where pull material flow is based on the initiative of a consuming unit in the flow and push is rather based on the supplying or planning unit. Pull based planning is directly initiated by the customer orders and the quantities are small and as closely as possible correspond to direct or immediate material requirement. It is the use of material planning methods that determines whether material flows are
of push or pull type, rather the method in itself.
Figure 14 - Push and pull based management. Jonsson P., 2008. S. 269.
21
A method for re-order point can be either used by a consuming unit for replenishment of material - pull, or be used by a central materials management department to order for manufacturing to stock for future sales – push. (Jonsson, 2008)
3.4.1. STOCK TYPES
The ideal flow of materials is a continuous movement from suppliers to customers in the supply chain. However it is not possible to achieve ideal flows since the speed in sub flow parts varies in the total flow, due to the difference between supply and consumption rate. In general there are often interruptions in the movement of materials and the different sub-flows must be separated from each other to not disrupt the movement of other sub-flows. The function of different types of stocks is to help achieving this and stocks become integrated in the materials flow. The different types of stocks are following (Jonsson, 2008);
Cycle stocks - These stocks arise when inbound deliveries occur at different rates and have larger quantities than the consumption. Every order, delivery and transportation is associated with ordering costs no matter the size of the quantity. The larger the order quantity the less ordering cost per unit. (Jonsson, 2008)
Safety stocks - It is not possible to avoid disruptions in stock replenishment since deliveries can be delayed or the wrong amount of quantities to be received. It is also hard to predict the perfect future consumption. To avoid stocks being depleted to early if the demand may be higher than expected, safety stocks are used. (Jonsson, 2008)
Leveling stocks - Sometimes the consumption of goods is dependent on seasons where there is more consumption during certain time period. However there is still in interest to have an even production flow. This type of stock is to decouple the production rate from the consumption rate, where the plan for production and sales is leveled. (Jonsson, 2008)
Work in process - This stock of materials is in the process and are either being manufactured or in between two successive production resources. WIP is used to limit production disruptions and enables to separate the production rate between different parts in the production system. (Jonsson, 2008)
Co-ordination stocks - This stock arise when simultaneous ordering of several items occur and when the delivery or ordering is regulated by a timetable. The purpose of this stock is to couple parallel flows of material. (Jonsson, 2008)
Synchronization stocks - This stock arises due to imperfections in synchronizing demand, supply and material flows. An example is when items have to wait for other items concerning assembly. (Jonsson, 2008)
Speculation stocks - This stock is a type of cycle stock, however its turnover I decoupled from expected short term consumption. The purpose with this stock is if there will be shortage of raw material or if future price increases. (Jonsson, 2008)
Obsolescence stocks - This stock can be referred to as an inactive stock, where the goods in it are no longer expected to be consumed and are considered as scrap. (Jonsson, 2008)
22
3.5.
I
NFORMATION FLOWIn order of making good decisions it is significant to have up-dated, complete and correct information. This is important in materials management, use of resources and generally managing industrial activities. There are four main groups of information systems that are used as tools for collecting and processing information; Planning-, communication-, identification systems and electronic marketplace. The three first mentioned are to be explained, the electronic marketplace concerns communication and transactions between purchasing and selling parties which is not included in this project. (Jonsson, 2008)
3.5.1. PLANNING SYSTEM
The planning system consists of two main types; the enterprise resource planning system (ERP) and other specialized and advanced types of systems such as; warehouse management systems (WMS), transport management systems (TMS) and advanced planning and scheduling systems (APS). The specialized systems does not have their own databases, instead they use data in a parallel ERP system. Recently the advanced and specialized types of systems have developed as integrated parts of ERP. (Jonsson, 2008)
3.5.1.1. ERP
This system provides and process information that is required for administrative management in a company as a database and a collection of software programs. The database is an integrated system; it is shared between all the program functions that give information for all business processes. (Jonsson, 2008) The value of the system is that it connects all the information flows within the company. (Fawcett et al 382) This provides every user to have access to the information that they need. (Jonsson, 2008) ERP enables organizations to view the operations as a whole instead of trying to put together pieces of different information by various functions. Figure 15 shows the functions of ERP. (Krajewski, et al., 2007)
23
3.5.1.2. Warehouse management system (WMS)
ERP supports planning and execution of materials flow, however sometimes some detail support is missing and therefore the system can be supplemented with a special designed system such as the WMS. The WMS contains support for storage activities, the most common functions are following (Jonsson, 2008);
Goods reception – Incoming goods registration and automatic matching of purchase orders and advance shipment notice. Keeps track of whether goods should go to storage or as backorders.
Putting in stores – Identification of optimal location for each product made by calculations
Stock management – Updating of stock balance and enables tracking of goods
Order reception and order picking – Automatic generation of picking orders and advance shipment notices when other parties signal demands
Dispatch – picking orders generated by the system, labels and other documentation are printed for the goods that are to be delivered
Materials management – re-order point calculations and generation of purchase orders (Jonsson, 2008)
For optimal efficient use of WMS there are generally integration with systems for automatic data capture such as; bar codes, RFID and EDI, to be explained in the Communication system section. (Jonsson, 2008)
3.5.1.3. Transport management systems (TMS)
TMS is another type of special designed software. This system supports the transport planning with aim of optimizing total costs and delivery services. The functions in TMS are; design of transport network, transport optimization, route planning, load planning, manifesting and tracking and tracing. (Jonsson, 2008)
3.5.1.4. Advanced planning and scheduling systems (APS)
APS is a development of ERP that includes new knowledge about planning, logistics, IT etc. The aim is to support the materials flow planning through the entire supply chain. (Jonsson, 2008) The APS system includes plants, customers, warehouses, transportation etc. incorporating both temporal and spatial considerations. The major components of APS are; resource management, demand management, resource allocation and resource optimization. (Bowersox, et al., 2010) Several different terms are used to determine advanced planning and scheduling such as; advanced planning and optimization, advanced planning systems and supply chain planning. Following are the basic principles (Jonsson, 2008);
Frequent re-planning in order to adapt to changes
Priority and capacity planning in order to identify feasible plans
Advanced mathematics and logical algorithms
Optimization tools for the planning and decision making in order to identify the most feasible plans