Andrew Borg Cardona
Center for ComputerGames Research IT University of Copenhagen
Rued Langaards Vej 7, 2300 Copenhagen, Denmark
aboc@itu.dk
Aske Walther Hansen
Center for ComputerGames Research IT University of Copenhagen
Rued Langaards Vej 7, 2300 Copenhagen, Denmark
aswa@itu.dk
Julian Togelius
Center for Computer Games Research IT University of Copenhagen
Rued Langaards Vej 7, 2300 Copenhagen, Denmark
julian@togelius.com
Marie Gustafsson
Friberger
Department of Computer Science Malmö University Östra Varvsgatan 11A, 211 19 Malmö, Swedenmarie.friberger@mah.se
ABSTRACT
We present Open Trumps, a version of the popular card game Top Trumps with decks that are procedurally gen-erated based on open data. The game is played among multiple players through drawing cards and selecting the feature that is most likely to trump the same feature on the other players’ cards. Players can generate their own decks through choosing a suitable dataset and setting cer-tain attributes; the generator then generates a balanced and playable deck using evolutionary computation. In the exam-ple dataset, each card represents a country and the features represent such entities as GDP per capita, mortality rate or tomato production, but in principle any dataset organ-ised as instances with numerical features could be used. We also report the results of an evaluation intended to investi-gate both player experience and the hypothesis that players learn about the data underlying the deck they play with, since understanding the data is key to playing well. The results show that players enjoy playing the game, are enthu-siastic about its potential and answer questions related to decks they have played significantly better than questions related to decks they have not played.
1.
INTRODUCTION
The increasing amount of data means that there is an in-creased need to understand and make sense of data. One category of data that is becoming increasingly available is that of open government data (OGD), where governmen-tal and other organisations release their data in a format and license so that others can understand it and potentially
reuse it. The main reasons for doing this are to increase transparency and enable innovation. Government data is commonly released using data portals such as that of the US1and UK2governments. Other organisations include the United Nations3and the World Bank4, as well as cities, such as London5. Visualisations, mashups, and decidated appli-cations are means of making use of open data. Examples include the GapMinder tool [7] for visualising world devel-opment, mobile apps for comparing general practitioners, and mashups for seeing where bike accidents happen. It is evident that the release of such quantities of impor-tant data in a structured form represents a major opportu-nity, but the opportunity comes with its own set of chal-lenges relating to how to access, select, visualise and inter-pret the data. Common methods to enable understanding and overview of data are through tables, diagrams, and in-teractive visualizations.
There is clearly a need for more engaging and usable meth-ods for exploring and visualising such data. It has previously been proposed that another means of making sense of data is through games, an approach called data games. As pro-posed in [5] “Data games are games where gameplay and/or game content is based on real-world data external to the game, and where gameplay supports the exploration of and learning from this data.”
In most cases, the raw data in itself does not make for good game content, but it needs to be transformed in some way. Procedural content generation (PCG) refers to the algorith-mic creation of game content (levels, rules, items etc) with limited human input [8]. Part of the data games concept is that PCG techniques are used to create the content of games 1 data.gov 2data.gov.uk 3 data.un.org 4data.worldbank.org 5 data.london.gov.uk
based on real-world data.
Data games can be seen as a form of serious games [1], as the primary purpose is not entertainment but rather assist-ing the player in understandassist-ing and engagassist-ing with data [5]. However, they should be distinguished from educational games that aim to teach the player a particular curriculum; instead, data games focus on enabling player-guided exploration of data.
Building games on real world data is both an opportunity and a challenge. We identify four themes of research ques-tions in [5]: (1) Exploration, learning and playability, (2) Data selection and access, (3) Game design and develop-ment, and (4) evaluation, necessary to inform the previous three. In this paper, we examine research questions related to the first, third and fourth themes:
1. Is it possible to automatically create a balanced, playable Trumps deck based on open data?
2. Do participants enjoy playing Open Trumps?
3. Do participants score quiz questions significantly bet-ter when having been exposed to related data through Open Trumps than when they have not?
In [5], we also provide several examples of data games, such as: Open Data Monopoly (where the player generates a Monopoly board by selecting and weighing indicators for UK municipalities, which then form the “streets” of the game board), Bar Chart Ball (where a bar chart makes a platform game, and game movement is done through changing the indicator visualized), and Open Street Racer (racing games generated based on open street maps).
In this paper, we describe and evaluate Open Trumps, which is based on the game of Top Trumps (Section 2) and data sets from the UN and the World Bank describing different nations. Top Trumps has the benefit of being mappable to these types of data sets, as well as being a game that is highly accessible to many types of players. The first part of this paper is description of the Top Trumps game design (Section 3) and the card generator (Section 4). The second part of the paper describes an evaluation of Open Trumps through a focus group and user tests, methodology (Sec-tion 5) and results (Sec(Sec-tion 6). Finally, discuss the game and its evaluation (Section 7) as well as conclude and look forward (Section 8).
2.
TOP TRUMPS
Top Trumps is a card game where the deck of cards is based on a theme, such as cars, aircrafts, or characters from a film. Each card in the deck, such as a specific car model, aircraft or film character includes an image and description, and most importantly, specific values for a handful of at-tributes (such as speed, size, mental ability, as relevant to the theme). For example, cards may represent car mod-els (example attributes: top speed, engine capacity, price) or football players (example attributes: height, years of in-ternational experience, caps). See Figure 1 for an example card.
2 D. Top Trumps
Top Trumps is a popular card game with its roots originating from the game of Quartets back to the 1960s (EnJay Solutions, 2005-2012). It is played by 2 or more people and the aim is to win all other players’ cards. Players take it in turns to call out one of several features (such as speed, size, strength, etc…) on a card, and the player with the highest value for that feature wins the cards and puts them at the back of their deck. Figure 1 left shows an example of a top trump card, while a typical template is shown on the right.
Key/Name Picture Optional Description Feature 1 Feature 2 Feature N Value 1 Value 2 Value N Figure 1 - Left: An example top trump card in an aircraft deck.
Right: A template of a top trump card, displaying the fields or values a card typically has.
There are a number of reasons why Top Trumps was chosen for the purpose of this research. First and foremost, to our knowledge, there has been no attempt yet to procedurally generate Top Trumps card decks based on open data. Secondly, the game is very simple and especially flexible, allowing easy integration of open data, where statistical indicators and any quantitative values can be directly mapped into features on a card. The game also benefits from intrinsic educational values, since during gameplay, players get an idea of which cards have the winning values. In 2011, a national Top Trumps tournament was organized in the UK for some participating schools. The tournament was evaluated by conducting surveys with both teachers and children after the tournament was over, and received positive feedback, with pupils having fun while improving reading, mathematical, decision and social skills (Rice, Blades, & Gibb, 2011).
Through such initiatives and positive results, Top Trumps games offer a great potential within the educational world when paired with the possibilities of open data.
II. RELATED RESEARCH &APPLICATIONS
A. Open Data Monopoly
Marie G. Friberger and Julian Togelius (Friberger & Togelius) have researched the potential uses of open data in games, taking the game of Monopoly to generate game boards based on local governmental data in the UK. They have emphasized that the major role of data visualization and exploration lies in the generation of the board itself as opposed to the actual gameplay.
They have identified several steps to generate the board game, starting from the fundamental preprocessing of a physical Excel file, allowing user input and going through weighting and selection using an evolutionary algorithm. One downside which we will tackle in Top Trumps is the dependency of the physical data. The current version of the Open Data Monopoly retrieves local UK governmental data. The Top Trumps game generator will offer extensibility features to allow the use of virtually any available data.
B. Top Trumps as a Visualization Tool
Although not directly relating to games, in 2009, Hendrik Strobelt used Top-Trumps style cards to visualize large documents (Strobelt, Oelke, Rohrdantz, Stoffel, Keim, & Deussen, 2009). The aim was to use the so called document cards as a way to provide a suitable and less spacious view of a document’s essential content. It uses data mining and image processing techniques to create cards with images and features that are easily displayed on portable or handheld devices.
Figure 1: An example of a Top Trumps card from an aircraft-themed edition of the game.
The game is played with at least two players. All cards are dealt among the players, each receiving an equal number of cards. The starting player (the one next to the dealer) draws a card from their deck, selects an attribute and reads its value. The other players read out their values for this attribute, and the player with the ‘best’ (usually the highest) value wins all of the cards, which are placed at the bottom of the winner’s stack. Due to the way in which the card decks for Open Trumps are generated, the highest value is always taken as the winner. The next attribute is selected by the winner of the previous round. When a player has no more cards, they drop out, until the winner has collected all cards.
3.
DESIGNING OPEN TRUMPS
The design task we set ourselves was to create a generator for Top Trumps-style games, that would generate card decks (games) based on a data set chosen and according to further criteria (such as deck size) set by the users. This means that we need to extract data in such form that an instance of the data could correspond to a potential card, and an attribute of the data set could correspond to a potential card attribute. It also means that we should provide an easy way for the user to specify their criteria for deck creation, for example a graphical user interface.
Furthermore, we need the card sets to be playable, and preferably also enjoyable to play. To do this we need to understand the Top Trumps game dynamics, in particular what constitutes a good and a bad card deck. Arguably, a good deck rewards skill, so that a player that knows which feature to play does better than a player that picks random features. Therefore, a good deck does not contain cards that beat all (or most) other cards regardless of which feature is chosen, or cards that lose to most cards regardless of chosen feature. (In the language of optimisation, as many cards as possible should be close to the non-dominated front.)
There-fore, we formulated the following criteria for a good Open Trumps deck: As many cards as possible should be able to win against as many cards as possible. Note that this im-plicitly means that each card will also lose to as many cards as possible, if the wrong feature is played. This definition was directly used in our generator, as described below.
4.
THE OPEN TRUMPS GENERATOR
The Open Trumps generator software takes one or several data sources and generates a complete, playable card deck in the form of a table where the rows represent the individual cards and the columns represent the attribute. The current version does not generate a graphical layout of the cards or any images, but this can easily be done manually and would be straightforward to do mechanically. The software is writ-ten in C# and controlled from a graphical user interface that allows for user control of key steps of the process. The software has two parts: the preprocessor and the gen-erator. The preprocessor aggregates and preprocesses data into a format which can be used by the generator, namely rows which represent potential cards and columns containing potential features. The generator selects a subset of cards and features that is interesting and playable. Through this modular approach, the generator can always assume the ex-pected format of the data and the procedural content gen-eration can proceeed without taking data formatting issues into account.
4.1
Preprocessor
The preprocessor is a simple but extensible module that caters for varying data sources as long as an appropriate library is provided. To demonstrate this feature, two li-braries were developed, one handling United Nations pub-lished open data (United Nations Statistics Division) and another handling the World Development Indicators from the World Bank Group (The World Bank Group).
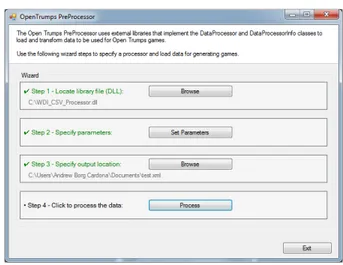
The general program flow is as follows. First, the user browses for the library file used for the data format of the particular data source, and then manually selects the loca-tion of the input and output files. The interface for pe-forming this can be seen in Figure 2. Depending on what is specified in each library, the preprocessor can read e.g., XML or CSV files, and handle common preprocessing tasks such as normalisation. The output of the preprocessor is a sin-gle CSV file where each line represents a possible card (e.g., a country) and each column represents a possible attribute (e.g., GDP). It is not guaranteed that values are specified for all features on all cards in the current implementation of the preprocessor.
4.2
Generator
The more interesting part of the framework is the generator, which generates decks of cards. Simply put, the generator selects a subset of all rows (cards) and columns (attributes) in the CSV file, and generates a new, smaller file from these. What is interesting is how it does this.
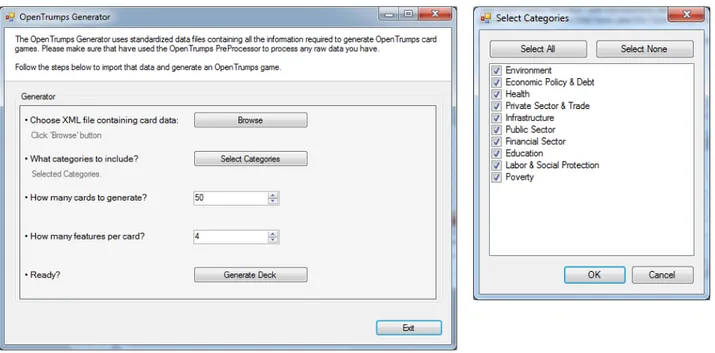
The interface to the generator is shown in Figure 3. The user can select how many cards to generate (50 in the example) and how many attributes to use per card (4 in the example).
Figure 5 - Left: The user interface for the preprocessor, reflecting the sequential steps involved in the process. Right: The parameters window, where the value consists of plain text input by the user.
C. Library 1 – World Development Indicators (The World Bank Group)
The World Data Bank Group provides global statistics and estimates in different sectors such as health, environment and education. The package is retrievable in a comma separated value format (CSV) and consists of six files, although only two are of interest. One file contains all the actual figures for all countries, while another file contains additional information on the indicators including a long description and the category they fall into. Therefore, the processor expects two parameters, defining the physical path to the two required files.
Each row in the data corresponds to one indicator for one country. A row consists of several columns corresponding to the years and ranging from 1960 to 2012. However, not every column is filled with figures. The processor therefore scans these columns starting from the latest date and retrieves the first (hence latest) figure found.
The data from the two CSV files are read and joined to produce the required format, containing the key (country name), and all its features with their names (indicator names), categories, year, description and the actual value. The data is passed to the output layer which is eventually handled by the Preprocessor to persist the game-ready data.
D. Library 2 – United Nations Open Data (United Nations Statistics Division)
The United Nations Statistics Division publishes statistics gathered by the United Nations and other partners, through a single interface. The numerous data sets can be browsed online by topic, dataset or the source. In fact, one of the data sources found here is The World Bank that was previously mentioned. There is however a difference in the data presented through the UN data service site.
The site allows users to browse the indicators one at a time with the possibility of downloading the data into a file of various formats, including CSV and XML. This means that to gather sufficient data for Top Trumps cards, many different files are required. In addition, some other data sources contain other columns and rows that are unnecessary or unneeded. For example, besides the country, there often appears an area too, representing a particular region from the country. With these being too specific or not needed for the game, they need to be filtered out to include only the “Total” area. Similarly, other data sets split their statistics by age ranges or gender which may or may not be useful.
Having taken these circumstances into consideration, the logic of this processor varied significantly from that of the previous library. The processor loads an XML file that contains all the information of all data files – including the columns used for the name of the card, the category of the indicator, the name of the feature, the column with the year, the relative path to the physical data file, columns that need to be filtered out using default values and some other information. Although there is currently no graphical interface, users are able to edit this XML file to add or remove references to data files.
Each entry in this XML file typically corresponds to one indicator for all the keys (or countries) presented in the data file. The processor runs several iterations through all the data files to gather all the distinct keys, and eventually to get all the available data a key at a time. This is required since currently the output layer accepts a unique key and all its corresponding data or features and must append it wholly to the exported file.
This processor therefore also expects two arguments passed to it. The first argument is the absolute path to the XML file that contains all the references to and metadata of the data files, while the second argument takes the absolute path to the folder where all the data files are and must be located.
Figure 2: The preprocessor interface. If the file generated by the preprocessor divides the possi-ble attributes into categories, the user can also select which attribute categories to use.
Deck generation is done by a very simple evolutionary algo-rithm: a 1+1 Evolution Strategy, also known as a stochastic hillclimber. The genome consists of two fixed-size lists rep-resenting a full deck of cards: one of which instances (coun-tries) to use, and one of which attributes to use. The only genetic operator is mutation, which works through replacing between 5 and 15 countries with other countries that have defined values for the chosen attributes. With a small prob-ability it can also replace the deck with a completely new deck.
Initialisation of the first individual is done in the following manner: First a single country is picked randomly. Then a number of attributes are picked, such that the single se-lected country has defined values for these attributes. (Some countries lack values for some attributes.) Then, the rest of the countries are chosen randomly, with the only constraints that (1) they should have defined values for all the chosen attributes and (2) they should be unique.
As described in Section 3, the goal of the generator is to create decks where each card could potentially win against as many cards as possible. This was implemented as a fit-ness function by simply summing the number of cards each card could potentially win against, if the best attribute was chosen. The fitness for each card ranges between 0 (if it can never win over any other cards) and 1 (if it would win over all other cards given the right attribute), and the fitness of the whole deck is simply the sum of fitness of all cards. Initial testing suggested that fitness growth had stagnated by the 200th generation. By this time, the average win-ning rate of a deck was over 0.95; therefore the length of an evolutionary run was fixed at 200 generations.
5.
EVALUATION METHODOLOGY
In evaluating Open Trumps, we began with a focus group followed by user tests. Before describing the methods used for these, we describe the decks used.
6 E. Open Trumps - Generator
The final stage of the process is the generation of the deck of cards (excluding the stage of actual gameplay – which for the scope of this research has not been implemented). The generator consists of algorithms that optimize decks for potentially more interesting games, while allowing the process of generation to be customized by the user through the interface seen in Figure 6 (left). Deck generation is a purely constructive algorithm as described in (Togelius, Yannakakis, Stanley, & Browne, 2011), since the process ensures that all cards created share common features and it never results in invalid decks. The generation is additionally a stochastic one despite lightly parameterized, and results in different decks each time it is run.
Figure 6 – Left: The Generator user interface.
Right: The parsed distinct categories displayed to the user as check boxes.
The generator requires the user to select the game-readable data file that was exported by the Preprocessor. As of the current version, the generator can only read a single file at a time and thus cannot automatically aggregate the data exported from different libraries (although it is worth to mention that it is easy to add a 3rd library for the preprocessor that takes 2 or more game-readable files and simply merges them). The file is parsed to extract all the distinct categories available, giving the possibility to the user to select a subset of the categories according to their wish as seen in Figure 6 (right).
Finally, the user is able to specify the size of the deck (default 50 cards) and the number of features that each card has (default set to 4). The generator triggers an evolution algorithm to evolve an interesting deck.
The evolution algorithm is a simple (1+1)-ES in which the genome is a direct representation of the deck. The first parent deck is generated by first randomly picking one key (or country) from the data, and selecting as many random features as are needed. Other cards are added by searching the data for those that have the same features (since not all countries may share the same features). A child is generated using a simple mutation operator on the parent. Mutation has a 50-50 chance to either replace between 5 and 15 cards with new cards having the same features, or to simply get a new randomly generated deck. With regards to the latter, it was initially set to replacing one feature for all cards – however it proved to be computationally intensive the new feature could possibly not be present in all the currently selected cards, and hence it becomes a challenge to maintain deck integrity and cards while searching new common features. The benefit was negligible with the used datasets.
The evaluation of a deck determines how “interesting” the deck is, according to the definition described in section III. The evaluator compares each card with every other card in the deck and determines how many cards it can win in the best case (i.e. checking if at least one feature defeats the other card). The card value given to each card represents the percentage of other cards it wins in this manner, with a maximum of 1 (100%). The average of the card values results in the deck’s overall fitness value. The evolution algorithm thus maximizes this fitness value.
V. RESULTS
A. Preprocessing
The 2 implemented libraries were used to process 2 different formats of data and export it into game-readable format for the deck generator. The WDI CSV processor processed two CSV files and successfully exporting around 1000 indicators per country. The UN Data processor consumed several files, aggregated and filtered data before exporting approximately 50 indicators per country. The reason for the much lower number of indicators is that a file had to be downloaded for each
Figure 3: The generator interface.
5.1
Decks
In order to test Open Trumps, a physical prototype based on decks generated by the Open Trumps software was created. Figure 4 shows an example of a card with the attributes Tomato Production, Adult Mortality Rate, Life Expectancy and Mortality Rate from Cancer. Flags were used as illus-trations for the countries. The decks were printed and glued to standard decks of cards. Four decks were created: one for the focus group and three for the user tests. For each user test the participants played two of the three decks. Which decks were used followed a repeated pattern of the six pos-sible permutations. The rules for Top Trumps as outlined in Section 2 were used.
5.2
Focus group
Before conducting the user study, a focus group of five par-ticipants (three men and two women) was assembled to study what issues might be important to investigate further. The format is a group discussion where the participants can engage with physical artefacts and discuss open-ended ques-tions [6]. The result of a focus group is shaped by group dynamics and one cannot use the results the same way as individual interviews or user tests.
The structure of the focus groups was as follows:
1. Introduction, where the participants fill out a small questionnaire.
2. Introduction to OGD and the current UI.
3. Prototype game play. One game with three players and one with two players. All participants played the game.
4. Three step group discussion of, e.g., strengths, weak-nesses, potentials, beginning with initial, unstructured
thoughts. This was followed by facilitation through cards with value-loaded words inspired by Product Re-action Cards [9]. Finally, various positive or nega-tive statements about the game were used as starting points for discussion.
5. Final comments, e.g., summing up or about issues that had not yet been covered.
6. Final questionnaire.
The questionnaires mainly had the purpose to test quiz ques-tions about the played deck. Some quesques-tions were the same on the pre- and post-session questionnaire and others were unique. This way we got initial indications on whether it would make sense to test learning this way.
The focus group session was recorded and transcribed, af-ter which the data was sorted and categorized [6]. To make sense of the results we used Severity Rating from 1-4 (ir-ritant, moderate, severe, unusable) of the identified issues combined with how many who agreed that the given was an issue [9]. Based on this we identified issues to proceed with.
5.3
User test
The goal of this test was to collect enough quantitative data on both enjoyment and learning to make it possible to iden-tify significant results. With this in mind we designed a relatively quick test consisting of two games of each 10 min-utes followed by one questionnaire. The average length of a test including introduction was about 35 minutes. Partici-pants in all tests were students recruited from the corridors of the university where the study took place.
To evaluate the test design, a pilot test was conducted with two students. The test resulted in some changes in the test
Figure 4: Example of a prototype card based on open data (in Danish).
guide to facilitate a smoother test. The general test design showed to be satisfying.
18 students took part in the user test. A test guide was used in order to streamline the tests as much as possible. To facilitate understanding and to emphasize that the un-derlying software actually was implemented and used in the creation of the prototype we gave the participants a printout of the UI as shown in Figure 3. We asked participants to keep in mind the underlying software when answering the questionnaire.
To capture the complete picture we kept notes of obser-vations during each test, we recorded which attributes were played how many times, how often the one to select attribute switched, which countries were mentioned and/or discussed, how they reacted on the attributes and if they laughed a lot or were especially silent.
5.3.1
Self-reported metrics: Test of enjoyment
To test the enjoyment of Open Trumps we used self-reported metrics in the questionnaire inspired by the USE question-naire [9] but with several questions relating specifically to the qualities of Open Trumps. Table 1 shows the statements used in the questionnarie.
Each question was rated on an analogue scale where the user puts a mark on a line to score how much they agreed with the statements from “Strongly disagree” to “Strongly agree”. This results in a value between 0-100 where the extremes 0 equals “Strongly disagree” and 100 equals “Strongly agree”. A score right between the two extremes (50) can be under-stood as a neutral stand. To test the whether ratings differ significantly the Students’ t-test is appropriate since it is valid when you have a small sample size and the population standard deviation is unknown [4].
B Open Trumps is fun C Open Trumps is flexible
D It is effortless to play Open Trumps
E Open Trumps holds a greater value than regular trump cards
F I would get Open Trumps if it was fully developed as a mobile or computer game
G I would recommend Open Trumps to a friend if it was fully developed as a mobile or computer game H I would like to play the game again with
the same attributes
I I would like to play the game again with new attributes
J I find the attributes we have used satisfying
5.3.2
Quiz: Test of learning potential
To test the learning potential of Open Trumps we used 12 quiz questions of three different types. The questions were designed so that there were four similar questions about con-tent from each deck. A correct answer was given a 1 and otherwise 0, so that a participant receives a score from 0-4 for each of the three sets of questions related to the differ-ent decks. We do not take into account the order in which the two decks were played when scoring learning potential. Thus, any difference in effect from playing, e.g., deck 1 before deck 2 versus playing deck 2 before deck 1 are not consid-ered.
In this case it is not proper to test for significance with the t-test because the sample comes from a non-normal distri-bution. Instead, a Mann-Whitney U-test was used to test whether the two samples are from different distributions (Meery, et al., 2011 pp. 452-459). With n > 5 the U-test re-turns a p-value corresponding to the p-value returned from a typical t-test. To do calculations, vassarstats.net was used, for both the self-reported metrics and the quiz.
6.
EVALUATION RESULTS
6.1
Focus group results
6.1.1
General dynamics
The immediate expectations expressed when introduced to Open Trumps was that it might hold a noticeable learn-ing potential. When playlearn-ing the game the participants of-ten discussed the countries, especially when they knew the country or when there were attributes with what they per-ceive as extreme values. Further, they shared knowledge with the group, when they thought they had some knowl-edge explaining a specific value. For instance explaining a low “total female enrollment” with civil war. Concerning enjoyment, the game often provoked laughter and surprised looks and statements about strong or weak countries.
6.1.2
Usability issues
Issues that came up were the general understanding of at-tributes, whether a high or low value should win, the rele-vance of some attributes, and if the data was reliable.
Throughout the discussion, it became evident that the par-ticipants did not understand the different attributes in the same way and that they in general found it difficult to iden-tify the actual meaning of the attributes. Some attributes were abstract and ungraspable to some of the participants. Ease of doing business index was at first hard to under-stand but throughout the game participants realized that high values were associated with difficulties doing business. Short-term debt was confusing and the participants never landed on a clear understanding of the attribute. Based on the problems they all agreed that it would help to have a point of reference like Denmark or England. The deck mostly consisted of non-Western countries.
Despite the problems of understanding the attributes, the participants quickly grasped what constituted high values for most attributes. In the beginning of the game, there was a lot of discussion about how to decide what constitutes a good value. For example, a large “annual freshwater with-drawal” was at first identified as good, but after discussing environmental and sustainability issues it was agreed on that low values should be best. When Open Trumps generates a deck, it always assumes that high values beat low values. The discussion showed that this evidently did not go with the way the participants understood the attributes. Some pointed out that they were in doubt whether they could trust in the values given on the cards. Are they up to date and are there false values? For instance, one participant wondered if a value of zero really meant a hole in the data set.
6.1.3
Value of Open Data
The participants all agreed that Open Trumps holds poten-tial by using OGD. They wanted a digital multiplayer appli-cation for smart devices and several times, they referred to the app “Quiz battle” and emphasized the strength of short intervals of gaming at a time. One participant said that even though he did not find the specific attributes of inter-est he enjoyed the game and thereby he found the learning potential great. Some also pointed out that the game could hold big value for niche groups of different kinds. For in-stance, young people studying medicine, golf players, WoW enthusiasts etc.
6.1.4
Learning potential
The participants answered the same two questions both be-fore and after the session. Pre-session they answered 1 out of the 10 questions correct. Post-session they answered 7 out of the 10 questions correct. This indicated that a test of learning potential might be fruitful.
6.1.5
Severity rating and the prototype
Based on a Severity Rating and the number of participants who agreed with the different issues we chose to handle the top three issues in the final test. The top three issues were: • Incomprehensible attributes, Severe, 80% agreement • Irrelevant attributes, Severe, 100% agreement • High or low wins?, Moderate, 100% agreement
0 10 20 30 40 50 60 70 80 90 100 A B C D E F G H I J
Figure 5: Overall average on each statement in Ta-ble 1.
For the user test we tried to eliminate these issues by using attributes that are understandable and have a general rele-vance, as well as by emphasizing that highest values always win. The identified issues challenge our definition of an in-teresting deck and shows that a strict focus on a balanced deck might be the wrong priority.
6.2
User tests
6.2.1
Enjoyment
Figure 5 shows the average score by all participants (n = 18) on each statement in Table 1.
They find the used attributes satisfying (J) and there is no negative attitude towards the fun of the game (B). The par-ticipants likes in general to play games (A). Whether Open Trumps holds a greater value than regular trump cards (E) scores above neutral meaning that there in general is some agreement with the statement. Whether the participants would like to play the game again with respectively the same (H) or new (I) attributes are significantly different from each other ( H = 48.7, I = 80.8, p = 0.00003) which tells us that the possibility to choose new attributes are very valuable. This is an indication that the use of OGD enhances the en-joyment compared to regular trump cards.
No one combination of decks differs significantly from the two others in the way each statement is rated.
We observed a combination of occasional laughter and sur-prised reactions on attributes together with intervals where the participants played the game in silence. The typical pattern was that each new game started with a relative high energy level that later in the game mellowed down. This was typically the case with both the first and the second deck the participants played, and it can indicate that the change of attributes enhances the durability of the game compared to playing the same deck several times.
In the generation of cards, it is assumed that the highest value always wins, and this was the instruction to the play-ers. However, they found it illogical that negative attributes like mortality won by having the largest value. Instead they found it more meaningful to win by having the lowest mor-tality.
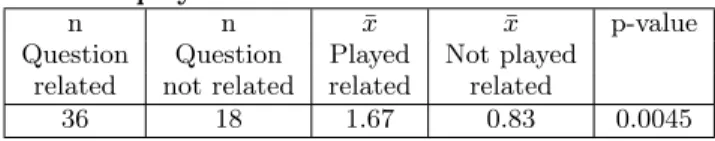
has been played or not
n n x¯ x¯ p-value
Question Question Played Not played related not related related related
36 18 1.67 0.83 0.0045
6.2.2
Learning potential
As described in Section 5.3.2, each participant gets three scores between 0-4, one for each deck.
Table 2 shows that the scores derived from participants who have played the related decks are significantly higher than the scores derived from participants who have not played the related decks.
In our observations of game play, we found that extreme values made an impression. The test subjects often men-tioned and even discussed when they met values they expe-rienced as extreme. For instance, Chad was mentioned in most games with the two decks that included Chad. Simi-larly the tomato production in the USA was mentioned in most games with the deck where it was included. Several times the USA was called a “Joker” or similar names in-dicating its extremely high tomato production. This also showed in the questionnaire, where 5 out of 12 commented on the large tomato production in the USA.
The participants only rarely showed any sign that they did not understand the attributes though some verbal comments showed that they misunderstood some of them without real-izing it. This is probably due to the fairly complex attributes explained by only one line. For instance, “Adult Mortality Rate (Number of 15-year olds out of 1.000 that die before they reach the age of 60)”. In order to understand the data the explanation in the parenthesis will generally be needed, but at the same time some players might never take the time to read the text in the parenthesis. This was also indicated in the way the attributes often were mentioned by the short-est possible label. For instance, Adult mortality rate might be shortened to mortality rate, even though the same deck had a cancer mortality rate as well. This several times led to misunderstandings during the games.
Another example of difficulties understanding the attributes was how a participant understood the HIV-percentage at-tribute on one of the decks as the percentage of women in a given country who had HIV. In fact the card explained that the percentage was in relation to the total HIV infected meaning that a value of 40% meant that the “last 60%” was HIV infected men and not healthy women.
Finally the attributes are not chosen by how they relate to each other and do not make any exhaustive whole, and so the player is at risk of drawing false conclusions. This is exempli-fied in comments from the questionnaire like: “Poor coun-tries have a smaller occurrence of cancer than do the rich countries?” and “Mortality rate and mortality rate by can-cer does not necessarily cohere”. The first comment might not take into account that the average lifetime is generally lower in poor countries which could be part of the
expla-a lexpla-arger context which might mexpla-ake it hexpla-ard to reexpla-ally under-stand the presented data.
7.
DISCUSSION
The data sets themselves can pose problems both to devel-opers and players. This issue has been somewhat discussed by others. Ding et al. [3] discuss the issues of handling in-complete information, special codes or acronyms, as well as lack of metadata, problems encountered when develop-ing the game, some of which affected also the game play. Dawes [2] points out that the potential promising value of OGD comes with risks for validity, relevance, and trust. Data quality is a cause of this, and Dawes suggests that the open data community can learn from the work done with data quality the nineties, looking towards the work of e.g., [10], where four data quality aspects are identified:
• Intrinsic quality, e.g., accuracy, objectivity, believabil-ity and the reputation of the data source.
• Contextual quality, e.g., timeliness, relevancy, com-pleteness and value to the user.
• Representational quality, e.g., formats and whether data is understandable and easy to interpret.
• Accessibility, e.g., ease of access and access security. The evaluation of Open Trumps points specifically to two of these issues: the contextual and representational qual-ity. Both enjoyment and learning potential were hampered especially by problems of relevancy, completeness, and the degree to which the data is understandable and easy to in-terpret. How to enhance the quality of the data and the meaningfulness from the players’ perspective needs further investigation.
These aspects might be informed by initiatives where people engage as laymen with large data sets, such as crowdsourc-ing activities. It is also relevant to analyze similarities and differences between data games and crowdsourcing, in terms of, for example, learning and engagement. Also, what is the potential of using data games as a crowdsourcing platform? It is possible that the fitness function could be refined. The current fitness function does not explicitly take the balance between cards into account, so in theory a deck where most cards win over many other cards but some cards lose against all others could get good summed fitness. We have not in-vestigated whether this actually occurs. The design of the fitness function is clearly a key problem to address for future work. Further, a more sophisticated evolutionary algorithm could be used, and the mutation operator could probably be improved.
It is also worth questioning the basic principle for building these decks that was laid out in Section 3 and forms bases for the fitness function of the generation: that each card should be able to win against as many cards as possible. While a deck built according to this principle indeed rewards skill in the sense that a player that can choose the best feature
will play better, it can also lead to situations where the same player keeps winning every round because every card will almost always win given that the best feature is chosen. This might be counteracted by setting as a target that each card should win often, but not every time, when a feature is chosen. For example, the target might be a 75% win rate given that the best feature was chosen, rather than more than 95% as is commonly the case with decks generated using the current fitness function. Alternatively, one could look into adding some extra mechanic to the game to give it more depth.
As found out in the user test, players had problems with un-derstanding some of the attributes, either because they were too complicated or because they were simply unknown. One research challenge is to automatically identify which features would be known to the target group, and how they could be succinctly presented to the player. To provide more back-ground on the attributes, the generator could have an option to include the range of values for each attribute (within the deck) on each card, which could both improve gameplay and learning. It would be also useful to be able to automatically identify whether lower or higher is better for a given feature. Alternatively, this could be made part of the game. Another issue is rooted balancing the selection of countries. Decks with both poor and rich countries typically consist of a mix of negative and positive attributes, so that the rich countries win on the positive and the poor ones win on the negative. This can potentially result in decks where countries with specific characteristics will be left out of a deck and, for instance, only the richest and poorest countries are used.
The current implementation of Open Trumps is somewhat cumbersome to use, as it only runs in Windows and pro-duces a CSV file as an output, from which the player has to make the actual cards. It would be very desirable to make a web-based version of the framework. This version should allow the user to select data sources from anywhere on the web, and also automatically find suitable pictures to make the actual cards, which should be delivered in a form ready for the user to print. These improvements would be quite straightforward.
Finally, we would like to perform a deeper evaluation of Open Trumps, trying to evaluate in detail what sort of learn-ing is facilitated by the game and over how long time periods. One interesting study could be whether testing over time ex-posing players to the same countries many times but with different attributes would give them a fuller picture of the countries. There is also a need to investigate problems with players misunderstanding or simplifying attributes used in the game.
8.
CONCLUSION
This paper has presented the game Open Trumps, where trumps cards representing nations are automatically gener-ated based on open government data. The enjoyability and learning potential of the game was evaluated through user tests involving 18 university students. In the user satisfac-tion survey, users agreed that the game was enjoyable and had great potential. The results of a quiz confirmed that
there is a learning potential by playing Open Trumps. The test shows that when participants immediately after play-ing Open Trumps answer the questions related to the decks they played their answers are significantly more often cor-rect than their answers on the questions related to the deck they did not play.
Even though these are promising results, the user tests also reveals a number of outstanding challenges. These include how to automatically select attributes that the users can understand and perceive as important, meaningful as well as trustworthy, understanding whether higher or lower is better, and presenting them in a succinct form. More work should also be done to make the system user-friendly and available.
Acknowledgements
Thanks to Richard Bartle for suggesting the idea of looking into Top Trumps as a data game.
9.
REFERENCES
[1] I. Bogost. Persuasive Games: the Expressive Power of Videogames. MIT Press, Cambridge, MA, USA, 2007. [2] S. S. Dawes. A realistic look at open data. Center for
Technology in Government, University at Albany/SUNY Available at http://www. w3. org/2012/06/pmod/pmod2012 submission 38. pdf, 2012.
[3] L. Ding, J. Michaelis, D. L. McGuinness, and
J. Hendler. Making sense of open government data. In Proceedings of the WebSci10: Extending the Frontiers of Society On-Line, 2010.
[4] C.-. Foundation. CK-12 Probability and Statistics-Advanced , Volume 1 Of 2. CK-12 Foundation, 2010.
[5] M. G. Friberger, J. Togelius, A. B. Cardona,
M. Ermacora, A. Mousten, M. Jensen, V. Tanase, and U. Brøndsted. Data games. In Proceedings of the Workshop on Procedural Content Generation, colocated with Foundations for Digital Games, 2013. [6] J. Kitzinger. Qualitative research. introducing focus groups. BMJ: British medical journal, 311(7000):299, 1995.
[7] H. Rosling. Visual technology unveils the beauty of statistics and swaps policy from dissemination to access. Statistical Journal of the IAOS: Journal of the International Association for Official Statistics, 2007. [8] J. Togelius, G. N. Yannakakis, K. O. Stanley, and
C. Browne. Search-based procedural content generation: a taxonomy and survey. IEEE
Transactions on Computational Intelligence and AI in Games, 3:172–186, 2011.
[9] T. Tullis and W. Albert. Measuring the user experience: collecting, analyzing, and presenting usability metrics. Morgan Kaufmann, 2010. [10] R. Y. Wang, D. M. Strong, and L. M. Guarascio.
Beyond accuracy: What data quality means to data consumers. J. of Management Information Systems, 12(4):5–33, 1996.