Signal transduction
DOPAMINE D1 RECEPTOR-INDUCED
SIGNALING CASCADES IN THE STRIATUM IN
PARKINSON’S DISEASE
Natallia Maslava
Bachelor Degree Project, 30 Credit Points, Biomedical Technology Program,
Malmö University: Health and Society,
2
Abstract
Maslava, Natallia. Dopamine D1 receptor-induced signaling cascades in the striatum in Parkinson’s disease, Degree Project, 30 Credit Points. Biomedical Technology Program, Malmö University: Health and Society, Department of Biomedical Laboratory Science, 2012
Parkinson's disease is one of the most common neurodegenerative diseases affecting up to ten million people worldwide. The disease is caused by the death of neurons that produce the neurotransmitter dopamine. To compensate the lack of dopamine, patients are treated with levodopa, a precursor of dopamine. Levodopa invariably causes a troublesome complication in the form of unwanted involuntary movements known as “levodopa-induced dyskinesia”.
Many studies have pointed out that levodopa-induced dyskinesia occurs due to increased phosphorylation of extracellular signal regulated kinases 1 and 2 (ERK1/2). It is important to understand how ERK1/2 is activated in Parkinson's disease by dopamine receptors in order to develop a reasonable treatment for LID or to prevent this condition in levodopa-treatment of Parkinsonian patients.
The aim of this study was to investigate the pathways induced by the dopamine D1 receptor in striatal “slices” from parkinsonian rats. The level of phosphorylation of ERK1/2 (pERK 1/2) was measured by Western blot. Along the pathways leading to the activation of pERK 1/2 different target molecules were blocked. The clear alterations in the dopamine D1 induced signaling pathways were observed. Activation of the dopamine D1 receptor induced phosphorylation of ERK1/2, the dopamine D1 receptor-mediated increase of pERK was shown to be dependent on calcium signaling, and the DA D1 receptor-induced phosphorylation of ERK1/2 was possible to modulate via Group 1 metabotropic glutamate receptor pathway.
The project is to be continued in the future and more target molecules should be tested in order to draw definite conclusions about how these signaling pathways interact with each other and how to regulate them effectively.
During the project, Western blot technique was improved and optimized for the future experiments of the present study.
Key words: basal ganglia, calcium pathway, D1 receptor pathway, dyskinesia, extracellular signal regulated kinases 1 and 2, metabotropic glutamate receptors, Parkinson’s disease, synaptic plasticity, Western blot.
3
Sammanfattning
Maslava, Natallia. Dopamin D1-receptor-inducerad signaltransduktion vid Parkinsons sjukdom, Examensarbete i biomedicinsk teknologi, 30 högskolepoäng. Malmö högskola: Hälsa och samhälle, Utbildningsområde Biomedicinsk teknologi, 2012.
Parkinsons sjukdom är en av de vanligaste progressiva neurodegenerativa sjukdomer som drabbar upp till tio miljoner människor i världen. Sjukdomen orsakas av död av de nervceller som producerar signalämnet dopamin. För att kompensera bristen på dopamin, får patienter läkemedlet levodopa som är en precursor för dopamin. Men tyvärr leder denna behandling till ett ännu svårare tillstånd – levodopa-inducerad dyskinesi (LID). Dyskinesier innebär onormala ofrivilliga rörelser. För att förstå mekanismer som orsakar LID har djurmodeller utvecklats som simulerar Parkinsons sjukdom.
Många studier har påpekat att LID uppstår på grund av ökad fosforylering av extracellulära signalreglerade kinaser 1 och 2 (ERK1/2). Det är viktigt att förstå hur ERK1/2 aktiveras vid Parkinsons sjukdom via dopaminreceptorer på cellmembranet hos nervceller i striatum för att utveckla någon rimlig behandling av LID eller för att förhindra det tillståndet.
Syftet med denna studie var att undersöka signalvägar som induceras av dopamin D1-receptorn i vävnadsprov från regionen striatum i hjärnan från lesionerade råttor. Nivån av fosforylation ERK1/2 mättes med hjälp av Western blot. Genom att blockera målmolekyler kunde olika signalvägar blockeras, och resultaten tyder på att det finns tydliga förändringar i dopamin D1-receptor inducerade signalvägar. Aktivering av dopamin D1 receptor inducerade fosforylering av ERK1/2, dopamin D1-receptor inducerad fosforylering av ERK1/2 visade sig att vara beroende av calcium signalering, och det var möjligt att reglera fosforylering av ERK1/2 via signalväg som är inducerad av Grupp 1 metabotropiska glutamatreceptorer.
Projektet är inte slutfört och fler målmolekyler behöver testas för att dra definitiva slutsatser om hur signalvägarna interagerar med varandra och hur man på ett effektivt sätt kan reglera dessa.
Under arbetets gång hade Western blot-tekniken förbättrats och optimiserats.
Nyckelord: basala ganglier, kalcium signalväg, D1 receptor signalväg, dyskinesi, extracellulär signal-reglerade kinaser 1 och 2, metabotropa glutamatreceptorer, Parkinsons sjukdom, synaptisk plasticitet, Western blot.
4
Table of Content
Introduction ... 5 Parkinson’s disease ... 5 L-DOPA-induced dyskinesia ... 5 Animal models of PD ... 6Overview of the Basal ganglia anatomy ... 6
Dopamine and Glutamate receptors in the intact striatum ... 9
The ERK cascade ... 10
Molecular signaling in the parkinsonian striatum ... 11
Molecular signaling in the dyskinetic striatum ... 12
Western Immunoblot ... 12
Aims of the present study ... 14
Methods and Materials ... 15
Animals ... 15
6-OHDA-lesion ... 16
Amphetamine rotation test ... 16
Brain slice preparation ... 16
Sonication of tissue samples ... 17
Protein concentration determination ... 18
SDS-PAGE ... 18
SDS-PAGE gel preparation ... 18
Sample preparation ... 18
Electrophoresis ... 19
Western blot ... 19
Transfer protein from gel to PVDF membrane ... 19
Detection of pERK1/2 ... 19
Re-probing with β-actin ... 19
Western blot analysis ... 20
Results ... 20
Increase in the phosphorylated ERK1/2 by the D1 agonist SKF38393 ... 21
The canonical DA D1 receptor mediated pathway ... 22
Calcium signaling ... 23
mGluR/PLC mediated pathway ... 25
Discussion ... 26
Abbreviations ... 31
5
Introduction
There are thousands of chemical reactions occurring within a cell. Numerous reactions constitute response cascades when the products of one reaction are consumed in the next reaction that is why each and every step and/or component in such a domino-like pathways is very important. Elaborate co-existence of many chemical pathways determines the sophisticated composition of a living cell. When for some reason a single element is taken away from this chemical network or it doesn’t work properly, a cell can undergo a series of changes in its functionality, and the chemical pathways can cross each other in the alternative way causing multiple complications and adaptations. This study is dedicated to understanding some of the mechanisms of action of dopamine signaling in the striatal neurons in the parkinsonian and dyskinetic brain.
Parkinson’s disease
Parkinson’s disease (PD), first described by James Parkinson in 1817, is the second most common progressive neurodegenerative disorder affecting up to ten million people worldwide (Parkinson’s Disease Foundation, 2012; Purves et al., 2004). Incidence of Parkinson’s grows with age, but about 4 % of patients with PD are diagnosed before the age of 50 (Parkinson’s Disease Foundation, 2012). This disease is characterized by cardinal symptoms such as tremor, akinesia (absence or poverty of movement), bradykinesia (slowed ability to start and/or continue movements), and rigidity, which are caused by loss of nigrostriatal dopamine (DA) neurons (Cenci and Konradi, 2010; Kandel et al., 2000). The parkinsonian motor symptoms begin to occur when the loss of nigral DA neurons is more than 50 % (Cenci and Konradi, 2010). The cause of the loss of nigrostriatal DA neurons remains unknown and the majority of PD cases are characterized as sporadic and not connected to any gene mutations, which can explain higher susceptibility for this disease (Purves et al., 2004).
L-DOPA-induced dyskinesia
In order to compensate the deficiency of DA, patients are commonly treated with 3,4-dihydroxyphenylalanine (DOPA or levodopa; Kandel et al., 2000). L-DOPA, is the direct metabolic precursor for DA and it can pass the blood-brain barrier, which DA cannot (Iversen et al., 2010). The blood-brain barrier (BBB) consists of tight junctions between neighboring capillary endothelial cells in the brain (Purves et al., 2004). Only small molecules, like hormones, O2, CO2 can
pass the protective barrier (Purves et al., 2004). L-DOPA is transported via the large amino acid transporter (LAT-1) through the BBB and is converted into DA by the enzyme aromatic L-amino acid decarboxylase in the central nervous system (Purves et al., 2004).
Levodopa is an efficacious drug, which initially improves the motor symptoms and quality of life of patients, but, unfortunately, it often causes a troublesome complication in the form of unwanted, debilitating, involuntary movements known as “L-DOPA (levodopa)-induced dyskinesia” (LID; Brotchie et al., 2005; Gerfen et al., 2002). Dyskinesia becomes more severe with increasing treatment duration, and it can be characterized with several levels of expression, being most serious at the beginning and end of treatment, or even when off-treatment (Brotchie et al., 2005). In the literature there have been proposed various
6
estimates of LID prevalence (reviewed in Brotchie et al., 2005; Cenci and Konradi, 2010; Gerfen et al., 2002). These differences in LID prevalence estimation depend on the patient population, how patients have been treated, and how LID is assessed (Brotchie et al., 2005; Cenci and Konradi, 2010). Mild dyskinesia can go unnoticed or confounded with tremor (Brotchie et al., 2005), but it is important to be noticed that treatment with L-DOPA at full doses invariably leads to dyskinesia in patients with advanced PD (Cenci and Konradi, 2010; Gerfen et al., 2002). It is estimated that approximately 10% of PD patients per year develop LID during the first 7 years of L-DOPA treatment (Cenci and Konradi, 2010).
Animal models of PD
Much effort has been dedicated to understanding the mechanisms causing the appearance of LID: many studies have been performed mostly using rat and mouse models of PD, but also non-human primates (reviewed in Cenci and Konradi, 2010). Common models of PD in laboratory animals are based on the selective destruction of DA neurons using specific neurotoxins. Mostly used are: 1-methyl-4-phenyl-1,2,3,6-tetrahydroperidine (MPTP) for non-human primates and 6-hydroxydopamine (6-OHDA) for rodents (Cenci and Konradi, 2010).
Overview of the Basal ganglia anatomy
In order to understand the underlying basis for the development of abnormal involuntary movements (dyskinesia), it is important to take a closer look at the basal ganglia anatomy.
The basal ganglia are a large group of diverse nuclei located deep within the cerebral hemispheres (Purves et al., 2004). The basal ganglia consist of four interconnected subcortical nuclei – the striatum, the globus pallidus (including the internal and the external segments), the substantia nigra (composed by the pars reticulata and pars compacta), and the subthalamic nucleus (Kandel et al., 2000). The basal ganglia modulate movement through the regulation of upper motor neurons (Purves et al., 2004).
The caudate and putamen compose one of the larger nuclei – the corpus striatum (Purves et al., 2004). The term corpus striatum means “striped body,” which can be explained by a stripped appearance when cut in cross section (Purves et al., 2004). The striatum functions as the major entry unit of the basal ganglia, to which pathways from different parts of the brain lead (Purves et al., 2004). The striatal principal neurons are called medium-sized spiny neurons (MSNs) because of rich presence of dendritic spines that cover their dendrites (Wilson, 2009). A typical medium-sized spiny neuron generally has 25–30 dendritic terminal branches, which radiate in all directions from the cell body (Wilson, 2009). The cell bodies of MSNs vary from 12 to 20 μm in diameter and have a small number of dendritic trunks (2–3 μm in diameter; Wilson, 2009). MSNs are GABAergic efferent neurons, and receive massive glutamatergic inputs from almost all cortical areas and the thalamus (Girault, 2012).
There are two types of compartments in the striatum: the “striosomes” (also known as “patches”) and the “matrix” (Kandel et al., 2000; Purves et al., 2004). Originally the distinction between the striosomes and the matrix was only based
7
on the different neuropeptides contained by the MSNs in the striosomes and matrix, but now it is also known that neurons in the two regions differ in their projection destinations and input sources (Purves et al., 2004).
The two output nuclei of the basal ganglia – the internal pallidal segment and the substantia nigra pars reticulata - are involved in inhibition of target nuclei in the thalamus and the brain stem, which are responsible for modulating movements (Kandel et al., 2000). This inhibition is operated via two antagonistic pathways, the so called direct and indirect pathways, originating from the striatum and targeting the output nuclei of the basal ganglia (Kandel et al., 2000).
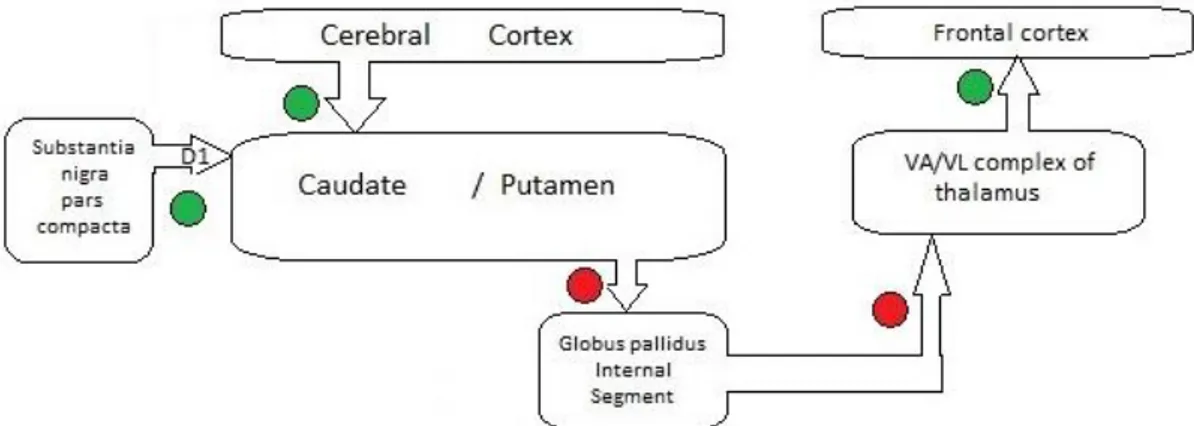
In the striatum there are two different populations of medium-sized neurons, which express either DA D1 or D2 receptors and give origin to two efferent pathways to the basal ganglia output nuclei, which are termed the direct or the indirect pathway, respectively (Cenci and Konradi, 2010). DA D1 receptors are expressed in nigrostriatal MSNs of the direct pathway, and DA D2 receptors are expressed in striatopallidal neurons of the indirect pathway (Girault, 2012). Activation of the direct pathway enhances movement while activation of the indirect pathway blocks movement (Kandel et al., 2000; Cenci and Konradi, 2010). The same nigral neurons can provide excitatory inputs mediated by DA D1 receptors on the spiny neurons that project to the internal globus pallidus (the direct pathway) and inhibitory inputs mediated by DA D2 receptors on the spiny neurons projecting to the external globus pallidus (the indirect pathway; Purves et al., 2004). Figures 1.1-1.2 illustrate the projections in the direct and indirect pathways.
Figure 1.1. Schematic diagram of the projections in the direct pathway. The green and the red
signs indicate excitatory and inhibitory projections. In the direct pathway, inhibitory neurons in the caudate and putamen project to inhibitory neurons of the internal segment of the globus pallidus, which project to the ventral laterial and ventral anterior nuclei of the thalamus (VA/VL complex) (Purves et al., 2004)
8
Figure 1.2. Schematic diagram of the projections in the direct and the indirect pathway. The green
and the red signs indicate excitatory and inhibitory projections. In the direct pathway, inhibitory neurons in the caudate and putamen project to inhibitory neurons of the internal segment of the globus pallidus, which in turn project to the ventral laterial and ventral anterior nuclei of the thalamus (VA/VL complex), while in the indirect pathway the inhibitory neurons project to the external segment of the globus pallidus. The inhibitory neurons from the globus pallidus project to the subthalamic nucleus. The excitatory neurons from the subthalamic nucleus project in turn to the internal segment of the globus pallidus, which results in modulating of the effects of the direct pathway (Purves et al., 2004)
The interplay of the direct and indirect pathway is responsible for selection of appropriate movements and suppression of inappropriate movements (Brotchie et al., 2004).
Due to the loss of nigrostriatal dopaminergic cells in PD, the indirect pathway becomes predominant (Purves et al., 2004), which is why any movement is difficult to be initiated (akinesia), and once initiated, it is also rather difficult to terminate (Purves et al., 2004). Figure 1.3 illustrates how the direct and indirect pathways are changed in PD.
Figure 1.3. Schematic diagram of the influence of Parkinson’s disease on the projections in the
direct and the indirect pathways. The green and the red signs indicate excitatory and inhibitory projections. The dopaminergic inputs from the substantia nigra pars compacta are diminished, making it more difficult to initiate inhibition in the caudate and the putamen (Purves et al., 2004).
9
Dopamine and Glutamate receptors in the intact striatum
As mentioned above, there are two classes of medium-spiny neurons (MSNs) that express either DA D1 or D2 receptors. These two cell populations are differently affected by DA. DA D1 receptors increase levels of cyclic adenosine monophosphate (cAMP), activate protein kinase A (PKA), and increase protein phosphorylation, whereas D2 DA receptors decrease cAMP levels, repress PKA and decrease protein phosphorylation (Cenci and Konradi., 2010; Girault, 2012). This is essential for normal physiological functioning of the direct and indirect pathways. All DA receptors are G protein-coupled receptors (GPCR; Girault, 2012). GPCRs regulate intracellular reactions by an indirect mechanism involving GTP-binding proteins (G-proteins) (Purves et al., 2004).
DA D1 receptors are connected to adenylyl cyclase (AC) by a heterotrimeric G protein with a specific composition, containing αolf, β2 and γ7 subunits (Girault,
2012). In striatopallidal MSNs, these heterotrimeric G-proteins are associated mostly to adenosine A2a receptors (A2aR; Girault, 2012). The main isoform of adenyl cyclase in MSNs is AC5, which is not activated by Ca2+ (Girault, 2012). Activation of PKA leads to phosphorylation of dopamine- and cAMP-regulated neuronal phosphoprotein (DARPP-32). DARPP-32 plays an important role as an inhibitor of protein phosphatase 1 (PP1; Girault, 2012). The “canonical” cascade of AC5/cAMP/PKA/DARPP-32 is responsible for regulation of the levels of phosphorylation of many cellular and nuclear targets (Cenci and Konradi, 2010). DA D2 receptors are coupled to Gi/o heterotrimeric G proteins and are capable of inhibiting AC and Ca2+ channels and activating K+ channels (Girault, 2012). Besides inhibition of AC, coupling of DA D2 receptors to Gi/o proteins leads to release of Gβγ subunits, which stimulate phospholipase Cβ isoforms (PLC),
enabling the production of diacylglycerol (DAG) and inositol triphosphate (IP3), leading in turn to mobilization of intracellular Ca2+ stores (Cenci and Konradi, 2010).
There are two major groups of glutamate receptors in the striatal neurons: ionotropic glutamate receptors (iGluRs) and metabotropic glutamate receptors (mGluRs).
The iGluRs include three main types: the AMPA (2-amino-3-(5-methyl-3-oxo-1,2-oxazol-4-yl) propanoid acid) receptor and NMDA (N-methyl-D-aspartate) receptor and kainate receptor. The AMPA receptor depolarizes the cell by letting Na+ flow inside the cell and is responsible for fast excitatory synaptic transmission (Girault, 2012). The NMDA channels are blocked by extracellular Mg2+ at negative intracellular membrane potential, but at positive membrane potential the NMDA channels become permeable to Na+ and Ca2+ (Girault, 2012). Apart from glutamate, this receptor requires also glycine for its activation (Girault, 2012). Studies have shown that these two ionotropic glutamate receptors are important for synaptic plasticity (reviewed in Girault, 2012). It is important to mention that activation of PKA by DA D1 receptors facilitates NMDA, AMPA and L-type Ca2+ channels (Cenci and Konradi, 2010). Calcium entry through the NMDA receptor or L-type Ca2+ channel activates calcium-dependent kinases (CaMKs), CaM kinase II (CamKII) particularly. CaMKII as well as PKA are responsible for phosphorylation of the transcription factor cAMP response element-binding protein (CREB), which leads to induction of gene expression (Cenci and Konradi, 2010).
10
Metabotropic glutamate receptors (mGluRs) belong to G-protein-coupled receptors. There are eight subtypes of mGluRs. The mGluR1 and mGluR5 subtypes activate membrane-bound phospholipase C (PLC), inositol trisphosphate (IP3) and diacylglycerol (DAG; Mao and Wang, 2002). IP3 binds to IP3 receptors on the membrane of Ca2+ stores (particularly endoplasmic reticulum) and leads to release of Ca2+ (Berridge, 1993).
Figure 1.4. Schematic representation of dopamine and glutamate receptor-mediated pathways in
the intact striatum. The D1 receptor is coupled to Gs/olf and activates AC5. It increases cAMP levels and activates PKA. PKA phosphorylates DARPP-32 (a Thr residue at position 34). When DARPP-32 is phosphorylated, it becomes a powerful inhibitor of PP1. PKA facilitates NMDA, AMPA and L-type Ca2+ channels, which lead to Ca2+ entry and activation of CaMKII. Both PKA and CaMKII can activate transcription factor CREB and initiate gene expression. mGluR5 activates PLC, facilitates DAG and IP3 production. IP3 binds to the IP3 receptor (not shown) and initiates Ca2+ release from the intracellular stores, while DAG activates PKC. Abbreviations: AC5, adenylyl cyclase type 5; AMPA, amino-3-hydroxy-5-methyl4-isoxazole propionic acid; cAMP, cyclic adenosine monophosphate; CaMKII, calcium-dependent kinase type 2; CREB, cAMP response element-binding protein; DAG, diacylglycerol; DARPP-32 dopamine-and cAMPregulated phosphoprotein of 32 kDa; IP3, inositol trisphosphate; mGluR5, metabotropic glutamate receptor type 5; NMDA, N-methyl-D-aspartate; PKA, protein kinase A; PKC, protein kinase C; PLC, phospholipase C; PP1, protein phosphatase 1.
The ERK cascade
Many recent studies have shown that the extra-cellular signal-regulated kinases 1 and 2 (ERK1/2) are involved in LID, being a key plasticity molecule (reviewed in Cenci and Konradi, 2010; Pavón, et al, 2005; Santini et al., 2007; Westin et al., 2007).
11
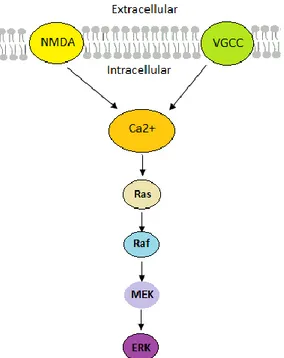
ERK1/2 belongs to the mitogen-activated protein (MAP) kinases and plays an important role in striatal signaling (Girault, 2012). There are many important cellular functions, such as cell growth, synaptic plasticity, and cell differentiation, which ERK1/2 is responsible for regulation of (Cenci and Konradi, 2010; Girault, 2012). In a neuron ERK1/2 can be activated by a range of extracellular signals including growth factors and neurotransmitters (Girault, 2012). The “classical” pathway of ERK1/2 activation is considered to be mediated in response to neurotrophins (specific growth factors that induce the survival, development, and function of neurons) through tyrosine kinases, adaptor proteins and guanyl nucleotide exchange factors (Thomas and Huganir, 2004). The “alternative” pathway of ERK1/2 activation is in response to membrane depolarization or glutamatergic signaling (Thomas and Huganir, 2004). Depolarization and activation of NMDA and L-type voltage-dependent Ca2+ channels trigger Ca2+ influx (Iversen, 2010; Thomas and Huganir, 2004). Ca2+ activates the brain-specific exchange factor Ras-guanyl nucleotide releasing factor 1 (Ras-GRF1), which facilitates the exchange of GDP for GTP on the small G protein Ras (Iversen, 2010; Thomas and Huganir, 2004). Ras-GTP activates the protein kinase Raf, which promotes phosphorylation of mitogen-activated protein kinase kinase (MEK) and activation of ERK1/2 (Thomas and Huganir, 2004; Figure 1.5).
Figure 1.5. The ERK cascade in synaptic signaling via activation of Ras by Ca2+ inflow from NMDA or VGCC. Ras activates Raf, this leads to activation of MEK and ERK. Abbreviations: ERK, extra-cellular signal-regulated kinase; MEK, mitogen-activated protein kinase kinase; NMDA, N-methyl-D-aspartate; Raf, member of the MAP kinase pathway (rapidly accelerated fibrosarcoma oncogene); Ras, oncogene of the MAP kinase pathway (RAt sarcoma oncogene); VGCC, voltage-gated calcium channel.
Molecular signaling in the parkinsonian striatum
In order to compensate the drastic decline of DA levels in the striatum, postsynaptic changes affecting DA receptors and their pathways take place (Cenci and Konradi, 2010). There have been observed several key alterations:
12
The striatal DA receptors become supersensitive partly because of the increased receptor number at the plasma membrane, but mostly due to the altered signal transduction in neurons (Cenci and Konradi, 2010);
Abnormal activation of canonical signaling pathways downstream of the DA D1 receptor (Cenci and Konradi, 2010): in the denervated striatum the DA D1 receptor enhances ERK activation via the MAPK-pathway (Cenci and Konradi, 2010; Gerfen et al., 2002);
Abundant activation of canonical pathways downstream of the DA D1 and D2 DA receptor due to an increased coupling of DA receptors to their G proteins (Cenci and Konradi, 2010);
Lowered expression of negative signaling modulators: the decrease of expression occurs in the family of proteins called regulators of G-protein signaling (RGS), which inactivate G-proteins and thereby, are able to block G protein-coupled receptor signaling pathways (Cenci and Konradi, 2010).
Molecular signaling in the dyskinetic striatum
Administration of L-DOPA and dopamine denervation in the striatum interdependently lead to uncontrolled DA influx, secondary changes in other transmitter systems, abnormal activation of intracellular signaling cascades, and synaptic plasticity in striatal MSNs (Cenci and Konradi, 2010).
The adaptive alterations occur in the receptor expression and the severity of LID correlates with overexpression of DA D1 receptors on the plasma membrane (Cenci and Konradi, 2010). The NR2A subunit of the NMDA complex is more expressed as well (Cenci and Konradi, 2010) and the dyskinetic striatal neurons are more sensitive to glutamate and trigger an enhanced expression of the AMPA receptor subunits on the cell membrane (Cenci and Konradi, 2010).
Changes in the intracellular signaling take place in the LID striatal neurons: overactivity of the DA D1-mediated pathway, interactions between the canonical DA D1 receptor-mediated pathway and MAPK pathway, changes in gene transcription due to overexpression of ERK1/2 (Cenci and Konradi, 2010). Increase in the level of activation of DARPP-32, ERK1/2, and mitogen- and stress-activated kinase-1 (MSK-1, a nuclear target of ERK) is suggested as an indicator of the altered intracellular signaling in the LID striatum (Cenci and Konradi, 2010).
Western Immunoblot
Western Immunoblot (WB) is an analytical technique used in molecular biology to detect a target protein in a sample (containing multiple proteins) by using a polyclonal or monoclonal antibody that recognizes and binds specifically to that protein. This method also allows defining the size of the target protein.
By properly designing an experiment, it is possible to compare the levels of expression of a protein of interest under different conditions.
13
a “negative” control: the striatal slices received no treatment, therefore providing the baseline values for the levels of expression of the protein of interest (pERK1/2);
a “positive” control: a standard treatment (the D1 receptor agonist SKF38393) was applied alone to the striatal slices and this resulted in a constant increase in the levels of expression of pERK1/2. In this way a predictable result could be guaranteed;
several test samples: the standard treatment (SKF38393) was co-applied together with a treatment of interest on the striatal slices. In order to detect changes in the levels of protein expression due to the selected treatment, the results were compared against both the baseline values (“negative” control) and those from the “positive” control;
There are several basic steps in a Western Immunoblot: Preparation of the samples
The sample tissue is broken down by a combination of mechanical and chemical methods – sonication in the so-called lysis buffer. The lysis buffer contains detergents, salts, phosphatase- and protease-inhibitors to prevent degradation of the sample proteins by its own enzymes. The lysis is done in cold environment to prevent protein denaturation and degradation.
SDS-PAGE
The protein samples are loaded on a polyacrylamide gel (called SDS-PAGE, abbreviation for sodium dodecyl sulfate polyacrylamide gel electrophoresis). The gel is loaded in a chamber containing the so-called running buffer. The running and sample buffers contain SDS, which is an anionic detergent applied to protein samples to linearize them and to impart them a negative charge. By applying an electric charge to the chamber, the negatively-charged proteins will migrate (run) towards the positive electrode. The proteins are separated according to their molecular size and trapped in the matrix of the gel.
Transfer to a PVDF membrane
The proteins trapped in the gel matrix are transferred onto a polyvinylidene fluoride (PVDF) membrane by applying a current. Protein binding to the membrane depends on hydrophobic interactions and charged interactions between the membrane and protein structures.
Blocking
The membrane supports used in WB have a high affinity for proteins. Therefore, after the transfer of the proteins from the gel, it is important to block the remaining surface of the membrane to prevent nonspecific binding of the detection antibodies during subsequent steps. To do this there is a range of blocking buffers that can be used; the most common is milk powder.
Incubation with primary antibody
The primary antibody is used in specific concentrations, selected and optimized at the beginning of the study. The buffer containing the antibody should also include bovine serum albumin and Tween to prevent non-specific binding of the antibody itself.
Incubation with secondary antibody
The horseradish peroxidase-linked secondary antibody binds on the primary antibody, so that it leads to possible detection of luminescence in proportion to the amount of protein, which can be analyzed.
14 Detection
Chemiluminescence from the bands on a membrane is captured with a CCD camera into a digital image. The optical density is analyzed by means of a software program.
Reprobing
The membranes can be “stripped” (which means the antibodies are removed by using specific chemicals that remove the binding between membrane and antibodies) and re-probed with other antibodies to detect other target proteins.
Aims of the present study
The project was dedicated to the examination of mechanisms of action involved in the D1 receptor-induced pathway in striatal slices collected from 6-OHDA-lesioned rats. The ultimate aim was to find possible regulatory mechanisms in the DA D1 receptor-induced phosphorylation of ERK1/2 in order to select possible drug treatments for LID.
Aims and sub-aims of the present project were:
1) to learn and optimize the Western Immunoblotting method;
2) to find out whether the treatment with the DA D1 receptor agonist SKF38393 (SKF) induces an increase in phosphorylated ERK1/2 in the slices collected from both the DA-denervated and the intact striatum; 3) to prove that the increase in pERK1/2 is dependent on the activation of the
“canonical” D1 receptor pathway (protein kinase A (PKA) was inhibited with the PKA antagonist KT5720) (see Figure 1.6);
4) to see whether intracellular Ca2+ signaling can influence ERK1/2 phosphorylation by interacting with the “canonical” D1 receptor pathway:
a) probing the samples in the presence of the DA D1 receptor agonist (SKF) by using the following treatments: the L-type Ca2+ channel blocker isradipine, the CaMKII inhibitor KN-62 and the IP3 receptor blocker 2-APB;
b) dissection of the role of external calcium (experiments with calcium-free cerebrospinal fluid (aCSF) were done);
c) testing whether increasing intracellular Ca2+ levels could influence ERK1/2 phosphorylation (Ca2+ -ATPase blocker thapsigargin); d) studying the connections between the “canonical” D1-mediated
pathway and calcium signaling (blocking Rac-GTPase with EHT 1864) (see Figure 1.6);
5) to investigate the interplay between Group 1 mGluR and the D1 receptor: a) co-treatment of the striatal slices with SKF and the Group 1 mGluR
agonist, DHPG;
b) simultaneous induction of the DA D1 receptor with SKF and blocking of PLC (a molecule activated downstream of mGluR5) with U73122; c) inhibition of protein kinase C (PKC, found downstream of mGluR5)
with GF109203x, while the DA D1 receptor was activated with SKF (see Figure 1.6);
15
6) to study the role of Src-kinase in the D1-induced pERK increase by blocking Src-kinase with PP2 (see Figure 1.6);
7) to investigate the interplay between RGS4 and the D1-mediated increase in pERK blocking RGS4 with CCG 63802 (see Figure 1.6);
Figure 1.6. Schematic representation of the canonical DA D1 receptor-mediated pathway; ERK
activation via MAPK pathway; Group 1 mGluR pathway and calcium signaling. The inhibiting compounds indicate what targets were chosen and examined during this project. Abbreviations: AC5, adenylyl cyclase type 5; cAMP, cyclic adenosine monophosphate; CaMKII, calcium-dependent kinase type 2; ERK, extra-cellular signal-regulated kinase; DAG, diacylglycerol; IP3, inositol trisphosphate; IP3R, inositol trisphosphate receptor; MAPK, mitogen-activated protein kinase; mGluR5, metabotropic glutamate receptor type 5; MEK, mitogen-activated protein kinase kinase; NMDA, N-methyl-D-aspartate; PKA, protein kinase A; PKC, protein kinase C; PLC, phospholipase C; PP1, protein phosphatase 1; Raf, member of the MAP kinase pathway (rapidly accelerated fibrosarcoma oncogene); Ras, oncogene of the MAP kinase pathway (RAt sarcoma oncogene); RGS4, regulators of G-protein signaling; Src, sarcoma kinase; VGCC, voltage-gated calcium channel.
Methods and Materials
Animals
Female Sprague-Dawley rats weighing 200-250g at the beginning of the experiment (Harlan, Netherlands) were housed in a 12h light-dark cycle with food and water ad libitum. All procedures were approved by the Malmö-Lund Ethical Committee on Animal Research.
16 6-OHDA-lesion
Female Sprague-Dawley rats received a unilateral DA-denervating lesion by injection of 6-hydroxydopamine hydrochloride (6-OHDA-HCl; Sigma Aldrich, USA) into the right medial forebrain bundle (MFB) according to the standard procedures of the laboratory (Cenci et al, 1998). The aliquots containing 1-2mg of the 6-OHDA toxin (Sigma Aldrich, Sweden) were stored in the dark at -20°C in order to avoid rapid oxidization before used. Just before injection, an aliquot of the toxin was dissolved in saline solution containing 0.02% ascorbic acid (used in the form of acid) at a concentration of 3.5 µg/µl and kept on ice, in the dark for no longer than 2,5 hours. The animals were anesthetized with an intraperitoneal injection of a 20:1 mixture of Fentanyl® and Dormitor® (Apoteksbolaget AB, Sweden), subsequently placed in the stereotaxic frame, and prepared for the surgery. After performance of a midline incision on the skin and removal of the connective tissue above the bone, the bregma (the point where the frontal bone and parietal bones meet) was localized. Drilling was performed at specific coordinates, calculated in mm, relative to the bregma and the dural surface. Two injections of 6-OHDA-HCl were performed with a Hamilton syringe at the following coordinates: (2.5 µl): AP = -4.4, L = -1.2, DV = -7.8 (tooth bar = -2.4); and (2 µl): AP = -4.0, L = -0.8, DV = -8.0 (tooth bar = +3.4), respectively. The injection velocity was 1 µl per minute and the needle was kept in place for additional three minutes to allow diffusion of the toxin into the brain tissue. The Hamilton syringe was rinsed and filled with 0.02% ascorbic acid between the toxin injections. After the surgery the wound was closed with metal clips and the animals received an analgesic treatment (0.167 mg/kg of Temgesic®; Apoteksbolaget AB, Sweden) and a 0.5-1 ml sterile saline injection to prevent dehydration during the post-operative recovery period (Cenci and Lundblad, 2007).
Amphetamine rotation test
Two weeks after the surgery the rats were tested for amphetamine-induced rotation. The rats were placed in hemispherical Perspex bowls where they were tethered to an automated rotometer (San Diego Instruments, USA) after an intraperitoneal injection of amphetamine (2.5 mg/kg D-amphetamine). Each 180° turn performed was fed to a PC running a photo beam activity system. Rotation test lasted for 180 min during which the number of left and right turns was recorded with 2 min intervals. Only animals showing means of >5 full turns per minute in the direction ipsilateral to the lesion during the entire session were selected for the study. This rotational score was reported to correspond to >90% depletion of DA fiber terminals in the striatum (Winkler et al., 2002).
Brain slice preparation
Brain slices were prepared from the striatum of the lesioned and unlesioned hemispheres of 32 rats. The animals were anesthetized with 60mg/ml Pentobarbital (1ml per rat) (Apoteksbolaget AB, Sweden) and rapidly decapitated with the guillotine. The removal of the brain out of the skull was performed in a wet-ice chilled environment with chilled tools. The brain hemispheres were separated with a sharp razorblade and put into a chiller-tray filled with artificial cerebrospinal fluid (aCSF) buffer (124 mM NaCl2, 3 mM KCl, 26 mM NaHCO3,
17
procedures from this step on were performed in aCSF, constantly bubbled with a mix of 95% O2/ 5% CO2. The hemispheres were sliced by means of a vibrating
blade microtome (LEICA, 1200S, Germany) at 0,2-0,3mm/sec speed and 1,45 mm amplitude. The slice thickness was around 250-300 µm. The striatum was dissected out from each slice and put into the slice chamber with bubbling aCSF buffer. In the standard setup, each brain hemisphere was cut sagittal into 14 striatal slices, which were then grouped by two, so that each sample contained two striatal slices. Therefore, each hemisphere from one animal produced 7 samples (see Figure 2.1). Experiments were designed so that two samples were used as negative control (no treatment applied and intended to function as controls for baseline values), two samples as positive control (always treated for 7 min with 10µM SKF38393; Sigma-Aldrich Sweden AB), and three samples as test samples (pre-treatment with substances of interest and subsequent treatment for 7 min with 10µM SKF38393 (Sigma-Aldrich Sweden AB).
Figure 2.1. Experimental design of studies with Western Immunoblot technique. Different target compounds were selected for examination of action mechanisms for ERK 1/2 phosphorilation under the dopamine D1 receptor and the metabotropic gluramate receptor (mGluR5) pathways (see Table 1).
Table 1. Target molecules and compounds.
Target Compound Concentration Pre-treatment
time
Number of animals
Agonist mGluR1/5 DHPG 10µM 7min 2 Agonist mGluR5 and agonist
D1 receptor SKF38393+DH PG 10µM 10µM 7min 2 PKA-inhibitor KT5720 0,5µM 30 min 3 Rac-GTPase inhibitor EHT1864 5 µM 40 min 2 PLC inhibitor U73122 7,5 µM 30 min 5 PKC inhibitor GF109203X 1µM 30 min 2 IP3 receptor inhibitor 2-APB 50μM 45 min 2
L-type Calcium channel blocker Isradipine 5 µM 20 min 1 Ca-ATPase inhibitor Thapsigargin 1μM 45 min 2 CaMKII inhibitor KN-62 10μM 30 min 2 RGS4-Inhibitor CCG63802 100 µM 30 min 1
Finally, the treatments samples were rapidly frozen in pulverized dry ice and stored at -80°C.
Sonication of tissue samples
In order to prepare samples for Western blot analysis, the samples were sonicated and lysed to release the proteins of interest. Lysis RIPA buffer was prepared as described in Table 2 and stored in wet ice. Homogenization of the samples started with adding 200µl lysis RIPA buffer per sample and then sonicating 20X 2 sec at 2W, with 1 sec lapse between each pulse (Branson SLPe, Mexico). The samples were centrifuged at 18000x g for 20 min at 4°C (Sigma, 2-16PK, Germany). After
18
centrifugation the supernatant was transferred into new tubes and kept on ice.
Table 2. Lysis RIPA buffer (pH 8.0).
Component Final concentration
Tris-base 65mM
NaCl 150mM
Triton-X100 1%
Sodium Deoxycholate 0,25%
EDTA 1mM
PhosSTOP (Phosphatase Inhibitor
Cocktail Tablets, #04906837001, Roche Applied Science, Germany)
1 tablet per 10 ml buffer
cOmplete (EDTA-free; Protease
Inhibitor Cocktail Tablets,
#11873580001, Roche Applied Science, Germany)
400 µl from stock (1 tablet in 2 ml MilliQ)
Protein concentration determination
To define protein concentrations in the samples, the BCA Protein Assay kit (#23227, Thermo Scientific Pierce, USA) for quantification of total protein was applied. Twenty-five µl of bovine serum albumin (Sigma-Aldrich, USA) standards (2000µg/ml, 1500µg/ml, 1000µg/ml, 750µg/ml, 500µg/ml, 250µg/ml, 125µg/ml, 25µg/ml, 0µg/ml) and unknowns was loaded onto a 96-well microtiter plate in duplicate. Two-hundred µl BCA master mix (BCA solution (BCA Reagent A, Thermo Scientific Pierce) containing 1/50 volume of 4% cupric sulfate (BCA Reagent B, Thermo Scientific Pierce) was added to each well, covered with plastic, and incubated at 37°C for 30 min (Memmert Incubator, Germany). The absorbance was measured in a spectrophotometer at 550nm (Biotek Instruments, ELX800, USA). The protein concentration was calculated using linear regression of the standard curve. The samples were stored at -20°C. SDS-PAGE
SDS-PAGE gel preparation
Each sample group (containing 7 tissue samples) was run on 10% SDS/polyacrylamide gel in duplicates. The casting of 2 SDS-PAGE gels (1,5mm) started with preparation of the resolving gel: 6 ml of acrylamide/Bis 30 %; 3,6 ml of Tris-HCl (1,88 M; pH 8.8); 8,25 ml of Milli-Q water; 180µl of SDS 10%, 90 µl of APS 10 %, 15µl of TEMED). The resolving gel was poured in the casting frame (Mini-PROTEAN Tetra Electrophoresis System, BioRad) and left for 75 min to polymerize. When the resolving gel was ready, the stacking gel (990µl of acrylamide/Bis 30 %; 1200µl of Tris-HCl (0,625 M; pH 6.8); 3,75 ml of Milli-Q water; 180µl of SDS 10%; 30 µl of APS 10 %; 6µl of TEMED) was added upon the resolving gel with 10-well combs, and left to polymerize for 45 min.
Sample preparation
The total volume to load in each well on a gel was 20 µl. In order to prepare the samples in duplicates, the appropriate volume of the sample (this amount had been calculated during the protein concentration determination) was balanced with a mixture of 65mM Tris/0,15 M NaCl (so that the sample plus Tris buffer was 22,5 µl in total) and loaded in 0,5 ml tubes. To this volume, additional 22,5 µl of SDS
19
Sample buffer (125mM Tris-HCl pH 6.8; 4% SDS; 20% Glycerol; 0,2% Bromphenol Blue; 100nM DTT; pH 6.4) were added. The samples were then vortexed and centrifuged (Sigma, 2-16PK; Germany) at 4500x g for 3 min. All samples were boiled at 90-100˚C for 10 minutes (Grant BOEKEL BBA, Grant Instruments, UK), centrifuged up to 4500x g (Sigma, 2-16PK; Germany) and loaded onto the gel.
Biotinylated protein ladder detection pack (10µl/lane; #7727, Cell Signaling Technology, USA) was used for protein size determination.
Electrophoresis
The gels were set up in the running apparatus (BioRad, Sweden) together with the running buffer (25mM Tris, 192mM Glycine, 3,5mM SDS, no pH adjustment). The samples were run on the gels by means of electrophoresis for 35 minutes at 200V at room temperature.
Western blot
Transfer protein from gel to PVDF membrane
The gels were equilibrated in cold Transfer buffer (25mM Tris, 192mM Glycine) for around 1 min. The Immun-Blot PVDF membrane (BioRad; Sweden) was activated by moisturizing it in 100% methanol for 30 sec and then equilibrated in Transfer buffer for 30 sec. The gel and the Immun-Blot PVDF membrane were assembled together in a cassette in the following order: clear cassette – pad – filter paper – PVDF membrane – gel – filter paper – pad – black cassette. The cassette was put in a container and Transfer buffer was added. A cooling block was put in the container, and the transfer was made at 100V for 45 min at room temperature.
Detection of pERK1/2
The membranes were rinsed in TBS-T (0,2M Tris; 1,37 M NaCl; 0,1% Tween-20, pH adjusted to 7,6 with 6 M HCl) 3 times for 10 min. The membranes were put in blocking buffer (5% non-fat dry milk in TBS-T) for 1 hour at room temperature with gentle shaking. The membranes were incubated in a buffer containing 5% BSA/ TBS-T and the Phospho-p44/42 MAPK ( antibody against Erk1/2, phosphorylated at Thr202/Tyr204 sites) primary rabbit polyclonal antibody (Cell Signaling Technology, Sweden) with a dilution of 1:2000 over night at 4°C. On the following day the membranes were rinsed in TBS-T and incubated in blocking buffer containing secondary anti-rabbit IgG, linked to horseradish peroxidase (1:5000; Cell Signaling Technology, Sweden) for 1 hour at room temperature. After the incubation, the membranes were rinsed in TBS-T and finally treated with a mixture of enhanced chemiluminescent substrates for detection of horseradish peroxidase activity (Pierce ECL Western Blotting Substrate; Thermo Scientific Pierce, USA). The membranes where then exposed to the UV light and the images were captured with a FUJIFILM Luminescent Image Analyzer LAS-1000plus (FUJIFILM, Life Imaging) at different exposure times: 1, 3 and 5 min. All pictures were converted to 16-bit TIFF format using the Multi Gauge software (FUJIFILM, Life Imaging).
Re-probing with β-actin
After the exposure to the camera, the membranes were rinsed in Milli-Q water for 1 min, put in 25ml stripping buffer (62,5 mM Tris; 1,5 mM SDS; pH adjusted to 6,7 with 6 M HCl) and 32 µl of 2-mercaptoethanol (Sigma Aldrich; Sweden) for
20
25 minutes in a water bath at 70°C. The membranes were washed in TBS-T 3x10 min at room temperature, and re-probed with the HRP-labeled anti-β-actin antibody (1:200000; Cell Signaling Technology, Sweden) in 5% BSA/ TBS-T. The membranes were treated with the enhanced chemiluminescent substrates for detection of horseradish peroxidase activity and images were captured with the FUJIFILM Luminescent Image Analyzer LAS-1000plus (FUJIFILM, Life Imaging) at 3 and 5 min of exposure times. All pictures were converted to 16-bit TIFF format with the Multi Gauge software (FUJIFILM, Life Imaging). Finally, the membranes were rinsed in Milli-Q water for 1 min and dried on a filter paper over night. The membranes were put in plastic and stored at -80°C.
Western blot analysis
The optical density of immunoblots was quantified using the image-processing software ImageJ (produced by the National Institute of Health of the U.S.A.). The calculations were made in Microsoft Office Excel 2007. The optical density of pERK1/2 bands was related to the optical density of β-actin, and the average values
were calculated. The baseline values (control) were taken as 100%, and the values of the positive control and test samples were related to the baseline values, and normalized to percentages.
The following criteria were applied for exclusion of gels from the analysis: 1) duplicate gels do not resemble each other, 2) the unsatisfactory quality of the gels (wrong protein size of the bands, broken bands, missing bands). If the gel was excluded from the analysis, the sample group was run again until the quality of the gels was satisfactory and both duplicates didn’t vary due to the technical effects of the run. An entire sample group could be excluded from the analysis because of there was insufficient increase of pERK1/2 in the positive control (the expected minimum increase was equal to 150%).
Results
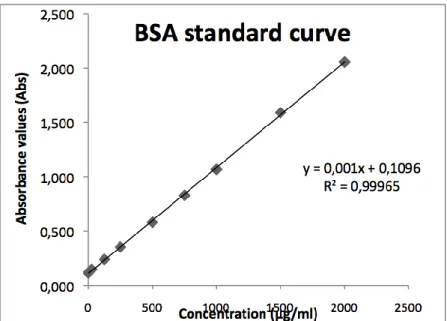
The protein concentration in each sample was calculated using linear regression of the standard curve (see Figure 3.1). The linear regression formula was used for determination of the protein concentration (µg/ml) in the samples and was calculated as: y = a * x + b, where x is the concentration of the protein, y is the absorbance value, a is the slope of the regression line and b is the y-axis intercept.
21
Figure. 3.1. The diagram shows an example of how to calculate the BSA standard curve for the
protein determination.
Each standard treatment group contained 7 samples (2 negative controls with no treatment, 2 positive controls always treated for 7 min with 10µM SKF38393 (Sigma-Aldrich Sweden AB), and 3 test samples with pre-treatment with a target substance and SKF38393 treatment. Each treatment group was run on two gels (doublets) to secure the quality of the Western blot. The pERK1/2 levels were normalized over the total protein content (β-actin) and the results were expressed as percentage change of the normalized pERK1/2 levels over the negative controls (in the following figures referred as baseline, control or “ctrl”).
In total, 88 gels were run. Nine animals were excluded due to no or low increase in pERK1/2 signal induced by SKF treatment; 11 gels were excluded from the analysis due to the wrong pipetting or uneven actin bands. The excluded gels were re-done until the satisfactory quality of gels was achieved.
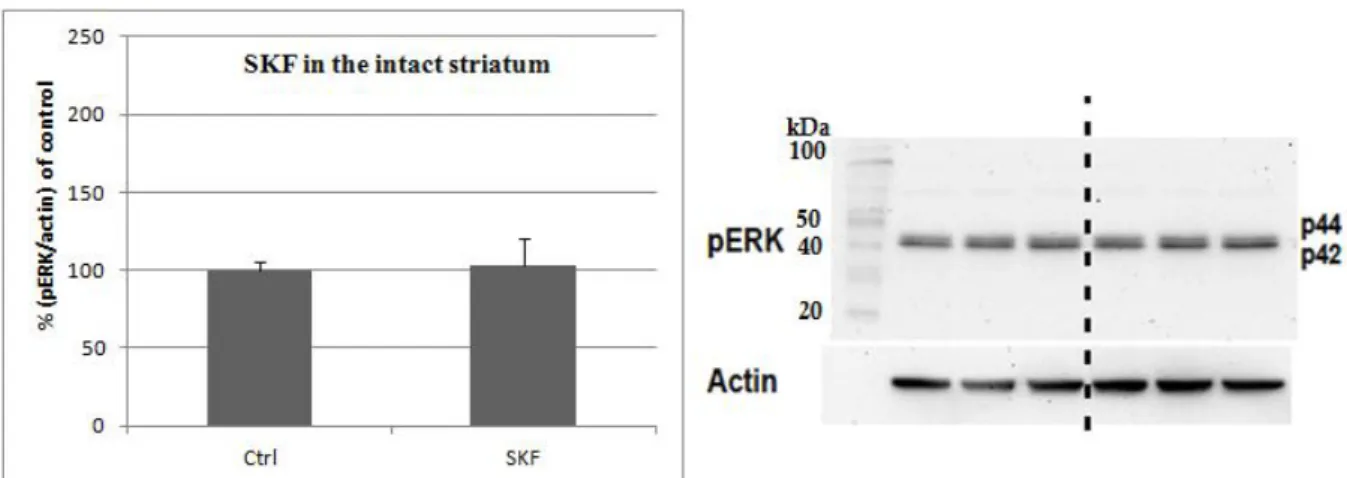
Increase in the phosphorylated ERK1/2 by the D1 agonist SKF38393 The D1 agonist SKF38393 (SKF) was tested on the intact and DA denervated striatum. In the intact striatum there was no increase in the level of phosphorylated ERK1/2, while in the DA denervated striatum the increase was 180% (see Figures 3.2-3).
Figure 3.2 The diagram shows the increase in the level of pERK1/2 in the DA denervated
striatum. The results are expressed as percentage increase of the normalized pERK1/2 signal over the negative controls. The increase was 180% over baseline (n. of animals = 1).
22
Figure 3.3. The diagram shows the overall lack of increase in the pERK1/2 levels in the intact striatum (n. of animals = 2).
The canonical DA D1 receptor mediated pathway
The inhibition of protein kinase A (PKA) with KT5720 showed that the DA D1 receptor induced phosphorylation of ERK1/2 can be blocked via inhibition of PKA. The pre-treatment with KT5720 (0,5µM) for 30 min reduces phosphorylation of ERK1/2 to the level of baseline or even lower (70% of baseline; see Figure 3.4).
Figure 3.4. The diagram shows that the PKA inhibitor KT5720 reduces the levels of pERK1/2 to
70% of the baseline (n. of animals = 3).
The Rac-GTPase was blocked by pre-treatment with EHT1864 (5µM) for 40min. One of the two tested animals was excluded due to the low increase in pERK1/2 after the induction with SKF (110-120% of the baseline, much lower than the 180% expected with this treatment). The other animal showed an increase of up to 187% from the contol value, and pre-treatment with EHT1864 led to a prominent decrease in pERK1/2 to 45% of baseline (see Figure 3.5).
23
Figure 3.5. The diagram shows that the Rac-GTPase inhibition reduced the level of pERK1/2 to
45% of the baseline (n. of animals = 1)
Regulator of G protein signaling 4 (RGS4) was blocked with CCG63802 (100 µM, 30 min). The pre-treatment with CCG63802 resulted in a drastic decrease in the level of pERK1/2 of 35% of the baseline (see Figure 3.6).
Figure 3.6. The diagram shows that inhibition of RGS4 with CCG63802 resulted in reduction of
pERK1/2 to the level of 40% of the baseline (n. of animals = 1).
Calcium signaling
Inhibition with isradipine, a blocker of the voltage-dependent calcium L-type channel, did not work as planned due to the low or no increase in the level of pERK1/2 (60-130% of control) after SKF treatment. The gels were re-done twice, but with the same result. Though pre-treatment with isradipine (5µM) for 30min resulted in decrease of pERK1/2 compared to the positive control, the experiment was decided to be re-done to secure the reliable results.
The experiments with blocking calcium-ATPase with thapsigargin gave no usable results and are to be repeated in the future.
Another key player in calcium signaling - calcium/calmodulin-dependent protein kinase II (CaMKII) was blocked with KN62 in the lesioned striatum of two animals. Pre-treatment with CaMKII blocker KN62 resulted in significant reduction in the level of phosphorylation of pERK1/2 to the level of 50% of baseline (see Figure 3.7).
24
Figure 3.7. The diagram shows that the CaM-kinase 2 blocker, KN62 resulted in decrease in the
level of pERK1/2 (50% below the baseline; n. of animals = 2).
Inositol trisphosphate (IP3) receptor is a membrane glycoprotein complex acting as calcium channel activated by IP3. The inhibition of IP3-receptor with 2-APB (50µl, 30 min) resulted in a robust decrease of pERK1/2 (up to 20% of the baseline; see Figure 3.8).
Figure 3.8. The diagram shows that IP3 receptor antagonist 2-APB decreased the level of pERK1/2
to 20% of the baseline (n. of animals = 2).
In order to dissect the role of external calcium, experiments with calcium-free cerebrospinal fluid (aCSF) were done. The experiments were done on the lesioned striatum of two animals in the buffer without calcium-ions (Ca2+). pERK was measured for control (with no treatment in zero Ca2+) and for test samples (treatment with 10 µM SKF38393 for 7 min in zero Ca2+). In this experiment there was no positive control, since the aim was to see if there is an increase in pERK with SKF treatment in zero calcium buffer. The level of pERK did not change (see Figure 3.9).
25
Figure 3.9. The diagram shows the experiment with calcium free aCSF in the lesioned striatum.
No increase in the level of pERK was observed (n. of animals = 2).
mGluR/PLC mediated pathway
In the intact striatum the treatment with SKF didn’t result in any increase in the levels of pERK1/2, as well as the treatment with Group 1 mGluR agonist DHPG (10µl for 7 min). On the contrary, co-treatment of both D1 agonist (SKF) and DHPG increased the level of pERK1/2 up to 156% of baseline (see Figure 3.10).
Figure 3.10. The diagram shows the results of co-treatment with SKF and DHPG in the intact
striatum. The increase was 156% of the baseline (n. of animals = 2).
The inhibition of phospholipase C (PLC) with U73122 (7,5µM, 30min) indicated the dramatic decrease in the level of ERK1/2 phosphorylation. The pre-treatment with U73122 reduced the level of pERK1/2 to the level of baseline and lower (110%; see Figure 3.11).
Figure 3.11. The diagram shows that PLC inhibitor U73122 decreased the level of pERK1/2 to the
26
The next step in the examination of the interplay between the mGluR5-PLC and DA D1 receptor-mediated cascades was to inhibit Protein kinase C (PKC) with GF109203x (1µM, 30 min). A dramatic decrease in pERK1/2 levels was observed (approximately 50-100% of the baseline).
Figure 3.12. The diagram shows the PKC inhibition with GF109203x resulted in the decrease in
the level of pERK1/2 to the level of 50% of the baseline (n. of animals = 2).
The inhibition of Src with PP2 (10µM, 30 min) resulted in a robust decrease of pERK1/2 to the level of 20% of baseline (see Figure 3.13).
Figure 3.13. The diagram shows that Src blocker PP2 decreases pERK1/2 to the level of 20% of
the baseline (n. of animals = 2).
Discussion
The signaling pathways were compared both in the lesioned and the intact striatum. The main readout for the activation of the signaling pathway was an increase in the levels of ERK1/2 phosphorylation. This molecular marker was chosen because L-DOPA treatment promotes activation of ERK1/2 through phosphorylation, and this effect is correlated with the severity of dyskinesia, suggesting that phosphorylated ERK1/2 (pERK1/2) is a key plasticity molecule in the development of this movement disorder (Westin et al., 2007).
For the purpose of the DA D1 receptor activation, the synthentic compound SKF 38393 (2,3,4,5-tetra-hydro-7,8-dihydroxy-1-phenyl-1H-3-benzazepine) was chosen. SKF 38393 acts only on the DA D1 receptor that is why it is more suitable than L-DOPA, which acts on both the DA D1 and D1 receptors.
First of all, the aim was to find out whether the treatment with the DA D1 receptor agonist SKF38393 (SKF) induces an increase in phosphorylated ERK1/2 in the
27
slices collected from both the DA-denervated and the intact striatum. In order to prove that the increase in pERK1/2 is dependent on the activation of the “canonical” D1 receptor pathway, PKA was inhibited with the PKA antagonist KT5720 (see Figure 1.6).
Secondly, it was investigated whether intracellular Ca2+ signaling can influence ERK1/2 phosphorylation by interacting with the “canonical” D1 receptor pathway. The samples were, therefore, probed in the presence of the DA D1 receptor agonist (SKF) by using the following treatments: the L-type Ca2+ channel blocker isradipine, the CaMKII inhibitor KN-62 and the IP3 receptor blocker 2-APB. In order to dissect the role of external calcium, experiments with calcium-free cerebrospinal fluid (aCSF) were done. It was also tested whether increasing intracellular Ca2+ levels could influence ERK1/2 phosphorylation: we applied the Ca2+ -ATPase blocker thapsigargin, which raises cytosolic levels of Ca2+ by inhibiting the intracellular buffer mechanisms for the ion. Moreover, the connections between the “canonical” D1-mediated pathway and calcium signaling were studied by blocking GTPase with EHT 1864 (see Figure. 1.6). The Rac-GTPases belong to the superfamily of Ras-Rac-GTPases and activate the MAP/ERK1/2 pathway (Iversen, 2010).
Moreover, the interplay between Group 1 mGluR and the D1 receptor was investigated at first through co-treatment of the striatal slices with SKF and the Group 1 mGluR agonist, DHPG. After that, simultaneous induction of the DA D1 receptor with SKF and blocking of PLC (a molecule activated downstream of mGluR5) with U73122 was tested in order to see if increase in the level of pERK is dependent only upon the DA D1 receptor activation or if there is an interdependence of mGluR pathway and the canonical DA D1 receptor-mediated pathway. Protein kinase C (PKC, found downstream of mGluR5) was targeted by inhibiting it with GF109203x, while the DA D1 receptor was activated with SKF (see Figure. 1.6). The aim was to find out whether there is a connection between the DA D1 receptor and mGluR pathway.
The role of Src-kinase in the D1-induced pERK increase was studied by blocking Src-kinase with PP2 (see Figure. 1.6). Src is a proto-oncogene encoding a tyrosine kinase. Src-kinases interact with DAG and Raf (Cleghon and Morrison, 1994), and some studies state that the tyrosine phosphatise Shp-2 (which belongs to Src family) interacts with the DA D1 receptor and enhances ERK signaling mediated by the DA D1 receptor (Fiorentini, 2011).
Finally, previous studies have shown that the level of RGS proteins decrease following the DA denervation (Cenci and Konradi, 2010), that is why the interplay between RGS4 and the D1-mediated increase in pERK was examined by blocking RGS4 with CCG 63802.
Levodopa remains the most effective drug for treatment of Parkinson’s disease. But this efficacious therapy invariably leads to the development of dyskinesia (Cenci and Konradi, 2010; Gerfen, 2002). L-DOPA treatment does not normalize the supersensitive response to DA D1 receptor agonists in the direct pathway neurons (Gerfen et al., 2002). There have been proposals that L-DOPA-induced dyskinesia (LID) results from an abnormal switch in the connection of the DA D1 receptor to signal transduction systems that activate the extracellular signal-regulated protein kinase (ERK1/2; Gerfen et al., 2002). Dopamine does not
28
normally activate pERK1/2 pathway in striatonigral neurons but after DA depletion it does (Gerfen et al., 2002). The ultimate aim is yet to find out mechanisms of regulation of the DA D1 receptor-induced phosphorylation of ERK1/2, and to develop a treatment to block this phosphorylation without interacting with the DA D1 receptor, therefore enabling L-DOPA treatment and prevention of LID.
The aim of this study was to examine action mechanisms of the DA D1 receptor-induced pathway in the striatal slices from the 6-OHDA-lesioned rats. The levels of phosphorylated ERK1/2 (pERK) were measured after different treatments of acute slices from the DA denervated and intact striatum. Similar studies (Mao and Wang, 2002; Mao et al., 2005) of transmission pathways were done in primary neuronal cultures, but the developed assay in this project differs from the primary neuronal cultures in many ways and it can be considered being closer to the in vivo situation.
The results of the project show that treatment of striatal slices from 6-OHDA-lesioned rats with the D1 receptor agonist (SKF38393, “SKF”) induces a significant increase in the level of expression of phosphorylated ERK1/2 (“pERK”). The same effect doesn’t occur in the intact striatum of the same animal. The conclusion is that DA D1 receptor activation leads to the phosphorylation of ERK1/2, constituting a D1-ERK1/2 pathway in striatonigral neurons as it is suggested in the literature (Cenci and Konradi, 2010).
The inhibition of protein kinase A (PKA) proves that the increase of phosphorylated ERK1/2 is mediated by the canonical D1/cAMP/PKA pathway. Older data from the same project indicate that inhibition of mitogen-activated protein kinase (MEK, located downstream of PKA) with U0126 results in a decrease in the level of pERK1/2.
The blockage of Rac-GTPases with EHT1864 resulted in significant decrease in the level of pERK. Rac-GTPases belong to the superfamily of Ras-GTPases and can be modulated by cAMP and calcium signaling (Aspenström, 2004; Iversen, 2010). The conclusion is that the DA D1 receptor-mediated increase in the level of pERK1/2 can be modulated via inhibition of Rac-GTPases.
Regulators of G protein signaling (RGSs) are GTPase-activating proteins, which negatively regulate G proteins by accelerating their inactivation (Lerner and Kreitzer, 2012). Some studies have shown that the level of RGS proteins decrease following the DA denervation (Cenci and Konradi, 2010). The experiment with blocking RGS4 with CCG63802 decreased the level of pERK, which does not correspond to the predicted results. CCG63802 binds to RGS4 and blocks interaction with Goa which should have activated the D1 receptor and the increase
in the level of pERK was expected to be higher. The actual results might indicate that the inactivation of the D1 receptor in the DA denervated striatum does not occur via Goa-RGS4-mediation.
Group 1 metabotropic glutamate receptors (mGluRs) are positively coupled to phospholipase C (PLC) via Gαq-proteins (Mao and Wang, 2003). The significant
decrease in the level of pERK after PLC treatment indicates the connection between the canonical D1/cAMP/PKA/ERK pathway and a non-canonical PLC-mediated pathway. This interdependence is confirmed in other works by cAMP
29
response element-binding protein (CREB) phosphorylation induced by Group 1 mGluRs agonist DHPG in cultured striatal neurons (Mao and Wang, 2002) and phosphorylation of ERK1/2 induced by DHPG in primary neuronal cultures (Mao et al., 2005). The studies of primary striatal neuronal cultures state that the selective activation of mGluR5, but not mGluR1, increases pERK (Mao et al., 2005). The member of Homer family Homer1b/c is identified to connect mGluR5 to ERK1/2 (Mao et al., 2005). Homer1b/c proteins build a complex with mGluRs and link mGluRs to the ERK1/2 pathway (Mao et al., 2005).
Treatment with Group 1 mGluR agonist (DHPG) alone did not give any results in the intact striatum. These results do not coincide with the results of other groups in studies of the interplay between Group 1 mGluRs and the canonical D1/cAMP/PKA/ERK pathways in cultured striatal neurons (Mao and Wang, 2002). Stimulation with DHPG alters phosphorylation of the nuclear transcription factor cAMP response element-binding protein (CREB) in cultured primary striatal neurons (Mao and Wang, 2002). In our project, co-treatment with both DHPG and SKF resulted in the increased level of pERK. Other works also tried co-treatment with SKF and DHPG (Voulalas, 2005) in primary striatal cultures, and their results coincide with our data.
The signaling pathway activated by mGluR5 includes PLC-mediated increase in the second messengers IP3 and DAG. DAG activates PKC and, as it has been shown in other works (Voulalas et al., 2005) the interaction between mGluR5 and D1 receptor is PKC-dependent. The inhibition of PKC by GF109203x clearly indicates that it effectively prevents phosphorylation of ERK1/2 in the DA denervated striatum.
The D1 receptor-mediated pERK induction depends on calcium signaling. Removal of calcium from the external buffer sufficiently decreased the level of pERK in the DA depleted striatum. The activation of PLC gives rise to IP3, which interacts with IP3 receptors on Ca2+ stores (especially located on endoplasmic reticulum) to cause Ca2+ release (Mao and Wang, 2002). The inhibition of IP3 receptors on Ca2+ stores by 2-APB significantly reduced the levels of pERK. Unfortunately the experiments involving inhibition of L-type Ca2+ channels with isradipine and blocking calcium-ATPase with thapsigargin did not work due to the low increase of pERK in the positive controls. These experiments should be redone in the future. Inhibiting CaMKII with KN-62 resulted in a prominent decrease of pERK, which indicates the significant role of Ca2+ in the D1 receptor mediated activation of ERK.
To summarize the results, the project so far has shown that in the DA denervated striatum 1) activation of the DA D1 receptor induces phosphorylation of ERK1/2, 2) the DA D1 receptor-mediated increase of pERK is dependent on calcium signaling and 3) the DA D1 receptor-induced phosphorylation of ERK1/2 can be modulated via Group 1 mGluR pathway. Next question to answer is how these pathways interact.
The interplay between the DA D1 receptor pathway and ERK has been explained by interaction of the tyrosine phosphatase Shp-2 with the DA D1 receptor. Indeed, the blockade of Src kinases by PP2 significantly decreased the level of phosphorylated ERK. Src kinases had previously been shown to be crucial for D1-Shp-2 interaction and ERK phosphorylation (Fiorentini et al., 2011). Another