Community Dent Oral Epidemiol. 2021;00:1–13. wileyonlinelibrary.com/journal/cdoe | 1 Received: 13 April 2020
|
Revised: 9 January 2021|
Accepted: 3 February 2021DOI: 10.1111/cdoe.12630
O R I G I N A L M A N U S C R I P T
The life cycle analysis of a dental examination: Quantifying
the environmental burden of an examination in a hypothetical
dental practice
Linnea Borglin
1| Stephanie Pekarski
1| Sophie Saget
2| Brett Duane
2,3This is an open access article under the terms of the Creative Commons Attribution License, which permits use, distribution and reproduction in any medium, provided the original work is properly cited.
© 2021 The Authors. Community Dentistry and Oral Epidemiology published by John Wiley & Sons Ltd.
1Faculty of Odontology, Malmo University,
Malmo, Sweden
2Trinity College Dublin, Dublin 2, Ireland 3Dublin Dental University Hospital, Dublin
2, Ireland Correspondence
Stephanie Pekarski, Malmo University, Faculty of Odontology, 20506 Malmo, Sweden.
Email: pekarskistephanie@gmail.com
Abstract
Objectives: Global sustainability is considered the number one health concern facing our planet. Dental care is currently not provided in a sustainable way. This study aims to quantify the potential environmental burden of an examination in a hypothetical dental practice and identify major contributors to environmental harm.
Materials and Methods: A life cycle analysis was performed for the life cycle of an ex-amination of one patient in a hypothetical dental practice. The equipment and prod-ucts analysed were those available at the Faculty of Dentistry, Malmö University. The Ecoinvent version 3.5 database and the life cycle assessment software tool OpenLCA version 1.10 were chosen for this study.
Results: Normalized results indicate that the impact categories to which the modelled examination most significantly contributes are water scarcity, freshwater eutrophica-tion and human toxicity (cancer effects). The major contributors or hotspots relating to the environmental harm of an examination procedure are soaps and detergents, disposable bibs, surface disinfection, stainless- steel instruments, clothing, water use and wastewater.
Conclusion: Normalized results indicate that the potential environmental impact of an examination compared to one individual's impact per year is minimal. Considering the potential number of dental examinations and other dental procedures performed every year puts the findings in another perspective. This paper touches on some of the ways that the environmental burden of an examination could be reduced. Small changes to everyday practice, such as always making sure the dishwasher and wash-ing machines are full when turned on, uswash-ing less environmentally damagwash-ing soaps, more sustainable clothing alternatives and using necessary instruments could sig-nificantly reduce dentistry's environmental impact. Changes in materials and practice may result in potential trade- offs. Research would need to be carried out comparing the environmental burden of any alternatives. We hope in the near future that there will be more evidence relating to products used within dental care settings, potential trade- offs and dentistry's environmental burden.
1 | INTRODUCTION
Global sustainability is considered the number one health concern fac-ing our planet.1 A sustainable world ‘must meet the needs of the
pres-ent, without compromising the ability of future generations to meet their own needs’.2 Climate change is a significant threat to
biodiver-sity.1,3 With the growing population, the consumption of natural
re-sources is increasing rapidly along with the associated greenhouse gas (GHG) emissions.4 Climate change is responsible for adverse weather
conditions, natural disasters and sea level rises, as well as an increase in cardiovascular diseases, malaria and other diseases; all of which harm the population.1 Many other factors beyond GHG emissions
harm the environment, including resource depletion and ocean acidi-fication.5 Internationally, there are a number of agreements to reduce
environmental harm, including the United Nations Paris Agreement6
and the Sustainable Development Goals.5 The European Union and its
member states aim to reduce GHG emissions by at least 40% by 2030 and by 80%- 85% by 2050 compared to 1990 levels.7
At present, healthcare is not provided in a sustainable way. In the United Kingdom, healthcare was responsible for 3.2% of the national footprint.8 Dentistry has a significant environmental impact, using a
large amount of energy and resources.9 Patient and staff travel to
and from the dental practice are the largest contributors, generating 60% of the total carbon dioxide emissions of dentistry. Water con-sumption and restorative materials potentially contribute to dentist-ry's environmental harm.10
The shift towards a more sustainable dental practice is becom-ing increasbecom-ingly important as the consequences of climate change become severe. The World Dental Federation recently adopted a policy for sustainability in dentistry. Considering the environment, without compromising patient safety and the quality of care, in deci-sions regarding the consumption of resources and energy in addition to educating the dental team are recommended in the policy paper.11
Life cycle assessment (LCA) is a modelling tool used to estimate the environmental impacts of a process/product throughout its life-time. LCAs can model from cradle- to- grave, accounting for all the environmental inputs and outputs; including resource extraction, the production and use and disposal of a process/product. A cradle- to- gate LCA models the life cycle of a process/product up until it is ready to be transported to the consumer.12 The goal of an LCA is
to compile the inputs and outputs of energy and materials, evalu-ate their potential environmental impacts, and interpret the results allowing for environmentally informed decision making.13 This is
done in four stages, as described by the International Organization of Standardization guidelines; ISO 14040:2006.12 Boundary
condi-tions and a functional unit are defined in stage one (definition of goal and scope). In stage two, Life Cycle Inventory (LCI), raw data are compiled, quantified and categorized as inputs or outputs. LCI data
are converted into values corresponding to the impact categories in the third stage, the Impact Assessment. A large number of impact categories including global warming potential, human toxicity, ma-rine eutrophication, abiotic depletion and acidification are assessed using this method. Finally, findings are interpreted and analysed for areas contributing significantly to environmental impacts within the system.14 Normalization and weighting are two optional steps to a
LCA. Impact category results are normalized, to a reference value, to calculate their magnitude. Results may then be weighted by a freely defined factor expressing the impact factor.15
Dental examinations are essential in order to identify, treat and prevent oral diseases such as caries and periodontitis. During an ex-amination, the dentist records the patient's medical history as well as examines the oral cavity, the teeth and supporting tissues. Dental examinations are the most frequently performed procedure by den-tists.16,17 It is important that patients visit a dental practice regularly,
and regularly can range anywhere between 3 months to 2 years.18,19 In
the Public Health England report, ‘Carbon modelling within dentistry,’ the dental examination was the procedure that contributed the highest proportion to the dentistry's carbon footprint. This report was under-taken using input- output hybrid methodology for carbon modelling. Due to its high contribution, it was decided a more detailed analysis of the environmental burden of a dental examination would be useful.10
LCA methodology was used to analyse the environmental bur-den of an examination in a hypothetical bur-dental practice. As bur-dental examinations are frequently performed, identifying which aspects of the procedure contribute to dentistry's environmental impact is important and was the focus of this study. From our understanding, LCA has previously been used in only one paper within dentistry.13
Environmental analysis of this nature attributed to dentistry is lim-ited. Dentistry is far behind other sectors when it comes to sus-tainability, and there is an urgent need for more research.20 Dental
professionals must consider the long- term environmental costs of providing dental care. This study aims to quantify the potential en-vironmental burden of an examination in a hypothetical dental prac-tice and identify major contributors to environmental harm.
2 | METHODOLOGY
2.1 | Scope and system boundaries
An attributional LCA was performed according to the ISO 14040:200612 guidelines for the life cycle of an examination in a
hy-pothetical dental practice.
The functional unit was defined as the examination of one pa-tient in a hypothetical dental practice. The scope of this study is from cradle- to- grave. The manufacturing, transportation, use and
K E Y W O R D S
carbon footprint, environmental footprint, green dentistry, life cycle analysis, sustainable dentistry
waste management of both disposable and reusable products were included. Components such as energy use, disinfection, laundry and waste disposal were also included. The system boundaries are illustrated in Figure 1. The construction of the faculty building, the manufacturing and transport of large machines and any servicing (eg dental units),14 as well as staff and patient travel, were excluded from
the system boundary.
A number of assumptions were made to clearly define the scope of the study and are summarized below (Table 1).
2.2 | Life cycle inventory
Primary data collection was completed at the Faculty of Dentistry, Malmö University. An examination kit was inventoried (see Appendix 1), and the average weight of each product was used. To calculate the average, 10 of each product were weighed using a scale accurate to ±0.02 g. The lifetime of each reusable product was based on conservative estimates provided by the Dental Faculty staff at both Malmö University and Dublin Dental University Hospital. For most products, there was an agreement on the lifetime. In the case of disagreement, the more conservative lifetime was chosen. Most instruments were assumed to have a lifespan of 500 uses. Weight was adjusted according to lifespan.
Several operating parameters were defined in the list of assump-tions above after directly observing examinaassump-tions, waste disposal and the laundry and dishwashing procedures. Energy and water consumption associated with the dental unit and compressor, dish-washer, washing machine and dryer were accounted for and acquired
from the manufacturer. Transportation distances were based on manufacturing locations and the location of the distributors in Malmö, Sweden. The distance between the local distributor and the Faculty is minor and would likely result in negligible differences in environmental burden and was, therefore, excluded. Transport dis-tances were estimated using Searates.21 All waste was disposed in a
container and transported to a recycling area in Malmö where 99% of household waste is incinerated, and the energy released used for district heating.22 Transport to the recycling area was excluded. See
Appendix 2 for more detailed information.
The data used to construct the life cycle inventory of a dental examination and its components is displayed in Table 2.
2.3 | Life cycle impact assessment (LCIA)
OpenLCA23version 1.10 is a free, life cycle assessment software tool
and was the chosen software for this study. The Ecoinvent version
3.524 database was chosen for this paper. It includes an
exten-sive collection of processes; some being country- specific. All data were classified and entered into openLCA, see Table 2. The proce-dure was assessed across the sixteen environmental impact cat-egories (Appendix 3) as recommended by the European Product Environmental Footprint (PEF) harmonization initiative. PEF is a har-monization initiative for LCAs by the European Union. Its methods package presents an extensive range of impact categories to assess the environmental impact of goods and services.25
The results were normalized, relative to the PEF per capita global equivalents, to identify the most significant impact categories.25
3 | RESULTS
The main results of this LCA are summarized in Table 3. The modelled examination produces 0.73 kg CO2 equivalent emissions, equivalent to driving 4.55 km in a small car.26 Normalized results indicate that
the impact categories to which the modelled examination most sig-nificantly contributes are water scarcity, freshwater eutrophication and human toxicity (cancer effects).
The main product categories and the percentage they contribute to the total burden of an examination within each impact category are displayed in Figure 2. The most significant categories are those which together contribute to at least 80% of the total impact.25 Soaps and
detergents are a significant contributor to all impact categories except ionizing radiation photochemical ozone formation. Disposable bibs
contribute significantly to 11 of 16 impact categories. Surface disin-fectant contributes to more than 90% of the potential photochemical ozone formation. Surface disinfectant is also one of the most significant contributors to the potential environmental burden in 9 of the 16 im-pact categories. Sanitary paper has a significant burden on acidification, human toxicity (noncancer effects) and land use. Stainless- steel instru-ments are the largest contributor to human toxicity (cancer effects) and are also significant to resource use (minerals and metals), freshwater eutrophication, human toxicity (noncancer effects) and respiratory dis-eases. The only significant contributor to ionizing radiation is electricity use. Clothing has a large impact on potential ozone depletion than its burden on other impact categories. Cardboard packaging, transport and hand disinfectant are not significant to any impact category.
4 | DISCUSSION
The aim of this study was to calculate the potential environmental burden of an examination in a hypothetical dental practice. With growing awareness around climate change and an increased interest in sustainability, identifying major contributors (hotspots) to envi-ronmental harm within dentistry is essential.
Previous studies on sustainability within dentistry have focused on aspects concerning travel, procurement and building energy.9,10,27
These papers only considered GHG emissions and concluded travel for both work and commuting purposes were the most significant contributing factors. By performing a detailed life cycle analysis, our study identified other significant contributors within several addi-tional impact categories (see Table 3).
4.1 | Limitations of the LCA
The assumptions and exclusions made to clearly define the system boundary were based on the frameworks set by the University and hospital staff. Bias from the origin and quantity of products used, the operating parameters and lifespan, for example, must be taken into consideration and will affect the accuracy of the findings.
The quantity of products, such as paper towels and surface disin-fection, will differ between individuals and procedures. Surface dis-infection is a significant contributor to a number of categories and sanitary paper to three categories. Large discrepancies will have a significant impact on the potential environmental burden.
The defined lifespan of stainless- steel instruments and other re-usables was conservative. In a study by Campion et al, the lifespan of all stainless- steel products was defined as 3650 uses.14 Assuming this
figure is closer to the actual lifespan, the potential burden on resource use and human toxicity, among others, could be considerably reduced.
The LCIA, data used were generic. When country- specific data were unavailable, European or global averages were used. Some find-ings were based on manufacturing averages from countries different from the actual manufacturing locations. Regulations differ between countries, and factories differ in technological advances resulting in
TA B L E 1 List of assumptions defining the system boundary of
an examination in a hypothetical dental practice
List of assumptions
An examination was calculated as 15 minutes.
The dentist performs the examination with a dental nurse. The dental practice modelled was assumed to be at Malmö
University.
Products coming from Sweden (<30 km) were transported in a small lorry.
Products with a European origin (>30 km) were transported in a large lorry.
Products produced outside Europe were first transported by a large lorry to the closest port, then by cargo ship to Malmö port and finally by small lorry to the distributor.
All land transport was based on European transport.
The packaging was assumed to be of cardboard and weigh 10% of one examination kit.
The dentist and dental nurse use one set of clothing per day, consisting of a shirt, trousers and a coat. These were assumed to be made of 100% cotton. The lifetime of the clothing was assumed to be one set to be used per 30 patients and for a total of 50 washes. It is assumed that a dentist can perform 30 examinations throughout
one 8- hour working day. As this LCA models a dental examination, the dentist's time was allocated to perform just examinations for this day.
The dental unit was wiped down once with a paper towel and disinfectant after each examination. 100 mL of surface disinfection (45% 2- propanol) and four paper towels were used per clean. Before meeting the patient, the dentist and the dental nurse washed
and disinfected their hands. During the handwashing procedure, one litre of water, 10 mL of hand soap and 5ml of hand disinfection (75% ethanol) were used.
Disposable products were discarded after a single use. All reusable stainless- steel products were disinfected in the
dishwasher after use.
12 examination kits were loaded in the dishwasher during each standard decontamination cycle.
25 sets of clothing were washed and dried during each laundry cycle. All products entered the general waste stream at the end of their
potential burdens that may differ significantly between factories. Health risks, such as lung cancer, due to exposure to carcinogens vary depending on manufacturing locations, with developing countries bearing a much higher risk.28 A large proportion of stainless- steel
instruments was manufactured in European countries. The LCIA for stainless steel was performed using Rest- of- World inventory data. Human toxicity may, therefore, be much lower than calculated.
In this model, waste was assumed to be incinerated. The energy released from waste incineration is used for district heating and elec-tricity, which is increasingly common in European countries. Waste incineration is much better than landfills in terms of waste man-agement, however, results in high CO2 eq emissions.29 The energy
produced is more carbon intense compared to renewable energy
sources such as wind and solar power.30 Reducing the amount of
waste produced by recycling, composting and preventing waste (avoided production) will significantly reduce the potential environ-mental impact of waste incineration.
4.2 | Analysis of the findings
This is the first study that has looked at the potential environmental burden of a dental procedure within several impact categories, not just GHG emissions. Normalized results indicate that the potential environmental impact of an examination compared to an individu-al's impact per year is minimal. However, considering the potential
TA B L E 2 Inventory data used to construct the life cycle inventory of an examination in a hypothetical dental practice
Material/process Product examples Amount LCI database Database process name
Steel Dental explorer, pocket
probe, carver, tray,
0.798 g ecoinvent v3.5 casting, steel, lost- wax | casting, steel, lost- wax | Cut- off, U - RoW
Isopropanol Surface disinfection 45 mL isopropanol production | isopropanol | Cut- off, U - RER Tissue paper Paper towels, disposable
bib, face mask
27.14 g market for tissue paper | tissue paper | Cut- off, U - GLO
Cotton Clothing 1.40 g market for textile, woven cotton | textile, woven cotton |
Cut- off, U - GLO Electricity Unit use, laundry,
dishwasher
1.79 kWh electricity production, nuclear, pressure water reactor | electricity, high voltage | Cut- off, U - SE
Water Handwashing, laundry,
dishwashing 7.10 L water/surface water
Soap Hand soap, detergents 21.34 mL market for soap | soap | Cut- off, U - GLO
Corrugated board
box Cardboard packaging 6.42 g corrugated board box production | corrugated board box | Cut- off, U - RER Nitrile Protective gloves 14.20 g market for acrylonitrile | acrylonitrile | Cut- off, U - GLO
Ethanol Hand disinfection 10 mL ethylene hydration | ethanol, without water, in 99.7%
solution state, from ethylene | Cut- off, U - RER
Polypropylene Plastic cup 2.46 g polypropylene production, granulate | polypropylene,
granulate | Cut- off, U – RER
Plastic film Disposable bib 13.17 g market for packaging film, low density polyethylene |
packaging film, low density polyethylene | Cut- off, U - GLO Polyethylene Evacuation tip,
evacuation tip adaptor
8.19 g market for polyethylene terephthalate, granulate, bottle grade | polyethylene terephthalate, granulate, bottle grade | Cut- off, U - GLO
Emissions to air Surface disinfection, hand disinfection
55 g Emission to air/high population density
Waste incineration All waste 73.78 g market for municipal solid waste | municipal solid waste | Cut- off, U - SE
Wastewater All wastewater 7.12 L market for wastewater, from residence | wastewater, from
residence | Cut- off, U – RoW
Transport Small lorry 0.046 km market for transport, freight, lorry 3.5- 7.5 metric ton,
EURO6 | transport, freight, lorry 3.5- 7.5 metric ton, EURO6 | Cut- off, U – RER
Large lorry 31.65 km market for transport, freight, lorry 16- 32 metric ton, EURO6 | transport, freight, lorry 16- 32 metric ton, EURO6 | Cut- off, U – RER
Sea freight 74.48 km market for transport, freight, sea, transoceanic ship | transport, freight, sea, transoceanic ship | Cut- off, U - GLO
number of dental examinations performed every year magnifies the overall findings. The impact categories to which the modelled exami-nation most significantly contributes are water scarcity, freshwater eutrophication and human toxicity (cancer effects).
Being a significant contributor to the three impact categories mentioned above, and to all but two others, makes soaps and deter-gents one of the most environmentally harming aspects of dentistry. Nevertheless, essential for proper infection control.31 Handwashing
with soap and water, which is not always taken as seriously as it should, and the importance of preventing the transmission of dis-eases has been brought to attention with the recent COVID- 19 pan-demic.32 With a potential change to health care practices following
the pandemic, the environmental consequences should not be ne-glected. Decontaminating reusable instruments to remove, inactivate and/or destroy pathogens requires heat and detergents.31 According
to a study by Golsteijn et al, it is the use phase and the ingredients of both laundry and dishwashing detergents that majorly contribute to environmental harm.33 The use phase includes the temperature of
the water, a factor that can not be changed without compromising antimicrobial efficiency.34,35The use of products containing
biosur-factants instead of synthetic surbiosur-factants can be more an eco- friendly alternative.36 Using alternative detergents with less environmentally
harmful ingredients, as well as always making sure the dishwasher and washing machines are full when turned on could significantly reduce dentistry's environmental burden, including the impact on water scarcity, one of the three main impact categories.
Disposable bibs contribute significantly to environmental harm, in-cluding freshwater eutrophication and human toxicity (cancer effects). Previous studies on disposable and reusable surgical gowns showed that reusable surgical gowns have less environmental impacts.37- 39
Using alternative products in the place of disposable bibs could result in a reduction in the overall environmental burden of an examination.
Surface disinfection (propanol) contributes significantly to half of the impact categories. Surfaces such as light handles must be dis-infected between patients as they may be contaminated, serving as reservoirs to pathogens.31 Within dentistry, electrochemically
acti-vated pH- neutral hypochlorous acid solutions have been shown to be successful disinfectants on dental prostheses.40 Further research
is needed before proposing this or other chemical alternatives to the conventional surface disinfectants used to wipe down surfaces after a procedure. Research would need to be carried out comparing the environmental burden of any such alternatives.
The use and production of dental clothing made from cotton have a significant impact on ozone depletion potential, water scarcity and freshwater eutrophication. With cotton production being water consuming and resource intensive, finding more environmentally friendly alternatives should be a priority. Bamboo fibres or recycled plastic from the ocean for clothing have been suggested as more environmentally friendly (less water consuming and GHG emitting) alternatives.41,42 There may, however, be trade- offs by using such
al-ternatives. A comparative LCA should be conducted to compare the environmental burden of dental clothing made of alternative materials.
Stainless- steel instruments are the largest contributor to human toxicity (cancer effects), one of the most significant impacts of an examination. All items in the examination kit assessed may not be necessary for an examination. Having fewer stainless- steel items in each kit, alongside increasing the lifetime of instruments, would re-duce the potential impacts.
The majority of ionizing radiation derived from an examination procedure is due to electricity use. According to the Swedish Energy Agency, nuclear power constitutes a large proportion of the energy generated.43 Using electricity from a renewable energy source could
notably reduce ionizing radiation.
Examinations are performed frequently. Many of the aspects identified are used throughout several different dental procedures making them significant to dentistry's total environmental burden.
5 | CONCLUSION
The impact categories to which the modelled examination most sig-nificantly contributes are water scarcity, freshwater eutrophication and human toxicity (cancer effects). The major contributors or hotspots re-lating to the environmental harm of an examination procedure are soaps and detergents, disposable bibs, surface disinfection, stainless- steel
TA B L E 3 The total potential burden one examination in a
hypothetical dental practice has on the environment
Impact category Unit
Total potential
impact Normalized results
Resource use, energy carriers
MJ 12.04 8.13E- 06
Resource use, minerals and metals
kg Sb eq 1.46E- 06 3.11E- 09
Acidification molc H + eq 0.01 3.64E- 07
Freshwater ecotoxicity CTUe 1.69 1.15E- 05
Freshwater eutrophication
kg P eq 1.71E- 04 9.10E- 05 Human toxicity, cancer
effects CTUh 1.19E- 08 1.63E- 05
Human toxicity,
noncancer effects CTUh 1.27E- 07 2.65E- 06
Ionizing radiation kBq U235 eq 0.18 7.61E- 07
Climate Change kg CO2 eq 0.73 4.74E- 07
Marine eutrophication kg N eq 2.03E- 03 7.51E- 06 Ozone depletion kg CFC- 11 eq 9.39E- 08 8.00E- 09 Photochemical ozone formation kg NMVOC eq 0.02 2.87E- 07 Terrestrial eutrophication
molc N eq 9.44E- 03 2.15E- 06
Land use Pt 43.94 2.01E- 06
Respiratory inorganics disease inc. 4.41E- 08 1.81E- 06
Water scarcity m3 depriv. 0.47 9.69E- 05
Note: The total potential impacts were normalized to what an average person would use in 1 year globally. One person's global average usage would represent a value of 1.
instruments, clothing, water use and wastewater. Normalized results indicate that the potential environmental impact of an examination compared to one individual's impact per year is minimal. Considering the potential number of dental examinations and other dental proce-dures performed every year puts the findings in another perspective. This paper touches on some of the ways that the environmental burden of an examination could be reduced. Small changes to everyday prac-tice, such as always making sure the dishwasher and washing machines are full when turned on, using less environmentally damaging soaps, more sustainable clothing alternatives and using only necessary instru-ments could significantly reduce dentistry's environmental impact. Changes in materials and practice may result in potential trade- offs. Research would need to be carried out comparing the environmental burden of any alternatives. We hope in the near future that there will be more evidence relating to products used within dental care settings, potential trade- offs and dentistry's environmental burden.
ACKNOWLEDGEMENTS
The authors affirm no potential conflicts of interest with respect to the authorship and/or publication of this article. There are no sources of funding to declare. We would like to thank Pia Lindberg for her support and encouragement during the initial stages of this study.
AUTHOR CONTRIBUTIONS
L. Borglin contributed to the conception, design, data acquisition, analysis and interpretation drafted and critically revised the manu-script. S. Pekarski contributed to conception, design and data acqui-sition. S. Saget contributed to data analysis and interpretation and critically revised the manuscript. B. Duane contributed to concep-tion, design, data analysis and interpretation and critically revised the manuscript. All authors gave final approval and agree to be ac-countable for all aspects of the work.
DATA AVAIL ABILIT Y STATEMENT
Data available in article supplementary material.
ORCID
Linnea Borglin https://orcid.org/0000-0001-7014-6791
Sophie Saget https://orcid.org/0000-0002-6941-4055
Brett Duane https://orcid.org/0000-0001-9670-0594
REFERENCES
1. Costello A, Abbas M, Allen A, et al. Managing the health effects of climate change: Lancet and University College London Institute for Global Health Commission. Lancet. 2009;373:1693- 1733.
F I G U R E 2 Life cycle environmental effects of an examination procedure in a hypothetical dental practice. Impacts are displayed as a
2. Farrington J, Kuhlman T. What is sustainability? Sustainability. 2010;2(11):3436- 3448.
3. Singh A, Purohit B. Public health impacts of global warming and cli-mate change. Peace Rev. 2014;26:112- 120.
4. Gemechu E, Butnar I, Gomà- Camps J, Pons A, Castells F. A compar-ison of the GHG emissions caused by manufacturing tissue paper from virgin pulp or recycled waste paper. Int J Life Cycle Assess. 2013;18:1618.
5. United Nations. About the sustainable development goals. 2019; https://www.un.org/susta inabl edeve lopme nt/susta inabl e- devel opmen t- goals/. Accessed 9 August, 2019
6. European Commission. Paris Agreement. 2016; https://ec.europa. eu/clima/ polic ies/inter natio nal/negot iatio ns/paris_en. Accessed 19 August, 2019
7. European Commission. EU climate action. 2019; https://ec.europa. eu/clima/ citiz ens/eu_en. Accessed 19 August, 2019
8. Sustainable Development Unit. Natural resource footprint. 2018; https://www.sduhe alth.org.uk/polic y- strat egy/repor ting/natur al- resou rce- footp rint- 2018.aspx. Accessed 19 August, 2019
9. Duane B, Taylor T, Stahl- Timmins W, Hyland J, Mackie P, Pollard A. Carbon mitigation, patient choice and cost reduction – triple bottom line optimisation for health care planning. Public Health. 2014;128:920- 924.
10. Public Health England. Carbon Modelling Within Dentistry: Towards a Sustainable Future. London, England: Public Health England; 2018. 11. World Dental Federation. Sustainability in dentistry. 2017; https://
www.fdiwo rldde ntal.org/resou rces/polic y- state ments - and- resol ution s/susta inabi lity- in- denti stry. Accessed 19 August, 2019 12. Swedish Standards Institute. Miljöledning - livscykelanalys - principer
och struktur (ISO 14040:2006). 2. utg. ed. Stockholm, Sweden: SIS; 2006.
13. Unger SR, Landis AE. Comparative life cycle assessment of re-used versus disposable dental burs. Int J Life Cycle Assess. 2014;19:1623- 1631.
14. Campion N, Thiel CL, DeBlois J, Woods NC, Landis AE, Bilec MM. Life cycle assessment perspectives on delivering an infant in the US. Sci Total Environ. 2012;425:191- 198.
15. Andreas R, Serenella S, Jungbluth N. Normalization and weighting: the open challenge in LCA. Int J LCA. 2020;25:1859– 1865. 16. Australian Institute of Health and Welfare. Oral Health and Dental
Care in Australia. Canberra, Australia: AIHW; 2019.
17. Swedish Competition Authority. Konkurrensen i Sverige 2018. Stockholm, Sweden: Konkurrensverket; 2018.
18. Clarkson JE, Amaechi BT, Ngo H, Bonetti D. Recall, reassessment and monitoring. Monogr Oral Sci. 2009;21:188- 198.
19. National Institute for Health and Care Excellence. Dental checks: intervals between oral health reviews. Clinical guideline [CG19] 2004; https://www.nice.org.uk/guida nce/cg19/chapt er/1- Guidance. Accessed 12 August, 2019
20. Duane BSR, Miller FA, Sherman J, Pasdeki CE. Sustainability in dentistry: a multifaceted approach needed. J Dent Res. 2020;99(9):998- 1003.
21. SeaRates LLC. Searates. 2019; https://www.seara tes.com/. Accessed 23 January, 2019
22. Fredén J. The Swedish Recycling Revolution. 2015; https://sweden. se/natur e/the- swedi sh- recyc ling- revol ution/. Accessed 24 June, 2020
23. OpenLCA [computer program]. Version 1.7.4. Berlin: GmbH, GreenDelta; 2018.
24. Wernet G, Bauer C, Steubing B, Reinhard J, Moreno- Ruiz E, Weidema B. The ecoinvent database version 3 (part I): overview and methodology. Int J Life Cycle Ass. 2016;21(9):1218- 1230. 25. Commission E. PEFCR Guidance document, - Guidance for the
development of Product Environmental Footprint Category Rules (PEFCRs). 2017.
26. Map My Emissions. Map My Emissions. 2019; https://mapmy emiss ions.com/home. Accessed 12 August, 2019
27. Duane B, Hyland J, Rowan JS, Archibald B. Taking a bite out of Scotland's dental carbon emissions in the transition to a low carbon future. Public Health (Elsevier). 2012;126:770- 777.
28. Rosenstock LCM, Fingerhut M. Occupational Health. In: Jamison DBJ, Measham A, Alleyne G, ClaesonM ED, Jha P, Mills A, Musgrove P, eds. Disease Control Priorities in Developing Countries. New York: Oxford University Press; 2006.
29. Cherubini FBS, Ulgiati S. Life cycle assessment (LCA) of waste management strategies: Landfilling, sorting plant and incineration. Energy. 2008;34:2116- 2123.
30. Vh J. The impact of Waste- to- Energy incineration on climate. Zero Waste. Europe. 2019.
31. Centers for Disease Control and Prevention. Guidelines for Infection Control in Dental Health- Care Settings - 2003. MMWR. 52. No. RR- 17. Atlanta, GA: ; 2003:20– 26. https://www.cdc.gov/ mmwr/pdf/rr/rr5217.pdf
32. Alzyood MJD, Aveyard H, Brooke J. COVID- 19 reinforces the im-portance of handwashing. J Clin Nurs. 2020;29:2760- 2761. 33. Golsteijn LMR, King H, Schneider C, Schowanek D, Nissen S. A
com-pilation of life cycle studies for six household detergent product categories in Europe: the basis for product- specific A.I.S.E. Charter Advanced Sustainability Profiles. Environ Sci Eur. 2015;27:1– 12. 34. Bockmühl DP. Laundry hygiene— how to get more than clean. J Appl
Microbiol. 2017;122:1124- 1133.
35. Bockmühl DPSJ, Rehberg L. Laundry and textile hygiene in health-care and beyond. Microb Cell. 2019;6:299- 306.
36. Comparative life- cycle analysis of synthetic detergents and bio-surfactants— an overview. In: R. Praveen Kumar EG, Raman JK, Baskar G, eds. Refining Biomass Residues for Sustainable Energy and Bioproducts. 1 ed.: Cambridge, Massachusetts: Academic Press; 2019.
37. Overcash M. A comparison of reusable and disposable perioper-ative textiles: sustainability state- of- the- art 2012. Anesth Analg. 2012;114:1055- 1066.
38. Vozzola E, Overcash M, Griffing E. Environmental considerations in the selection of isolation gowns: a life cycle assessment of reusable and disposable alternatives. Am J Infect Control. 2018;46:881- 886. 39. Mikusinska M. Comparative Life Cycle Assessment of Surgical Scrub
Suits : The Case of Reusable and Disposable Scrubs used in Swedish Healthcare [Independent thesis Advanced level]. Stockholm: Urban Planning and Environment, Environmental Strategies., KTH, School of Architecture and the Built Environment (ABE); 2012.
40. McReynolds D. The Novel Use of Electrochemically Activated pH Neutral Hypochlorous Acid Solutions as Biodecontaminants for Removable PMMA Dental Prostheses [Doctorate]. Dublin, Ireland: Division of Oral Biosciences Microbiology Research Unit and Division of Restorative Dentistry and Periodontology, University of Dublin; 2018.
41. Roos S. Life cycle assessment of Life Wear® bamboo garments. Mölndal, Sweden: Swerea IVF; 2013.
42. Unifi Inc. Repreve. 2019; https://repre ve.com. Accessed 02 August, 2019
43. Swedish Energy Agency. Energy in Sweden 2019. 2019; https:// www.energ imynd ighet en.se. Accessed 6 September, 2019
How to cite this article: Borglin L, Pekarski S, Saget S,
Duane B. The life cycle analysis of a dental examination: Quantifying the environmental burden of an examination in a hypothetical dental practice. Community Dent Oral Epidemiol. 2021;00:1– 13. https://doi.org/10.1111/cdoe.12630
APPENDIX 1
COMPOSITION ASSUMPTIONS FOR AN EX AMINATION KIT
Disposable products
Item Quantity Material Total weight (g) Origin
Face mask 2 Nonwoven fabric 5.92 Malaysia
Gloves 4 Nitrile 14.2 Wimpassing, Austria
Patient bib 1 Plastic film/tissue 7.58 Aneby, Sweden
Syringe tip 1 Virgin plastic 0.83 Irvine, CA, USA
Paper towel 7 Virgin pulp 8.05 Mannheim, Germany
Hygoformic 1 Polyethylene 4.50 Råå, Sweden
Evacuation tip 1 Polyethylene 2.86 Klagstorp, Sweden
Plastic cup 1 Polypropylene 2.46 Sweden*
Examiner bib 2 PE/tissue 18.76 Aneby, Sweden
Surface disinfection 100 mL Propan- 2- ol 1.00 Borlänge, Sweden
Hand soap 20 mL Aqua, sodium laureth sulphate, sodium
chloride, glycerine
2.00 Gothenburg, Sweden
Hand disinfection 10 mL 45% ethanol 1.00 Borlänge, Sweden
Washing detergent 0.27 mL Sodium hydroxide, phosphonates, alcohol ethoxylates
0.03 Älvsjö, Sweden
Dishwashing liquid 1.08 mL Potassium carbonate 1.08 Utrecht, Netherlands
Reusable products
Item Quantity Material
Assumed
lifespan Total weight (g)
Weight adjusted
for lifespan (g) Origin
Mirror handle 2 Stainless steel/silicone 500 29.8 0.06 Parainen, Finland
Mirror head 2 Stainless steel and glass 50 8.84 0.18 Parainen, Finland
Dental explorer 1 Stainless steel/silicone 500 14.78 0.03 Parainen, Finland
Pocket probe 1 Stainless steel 500 17.47 0.04 Chicago, IL, USA
Straight probe 1 Stainless steel 500 18.41 0.04 Chicago, IL, USA
Forceps 1 Stainless steel 500 23.67 0.05 Germany*
Spoon excavator 1 Stainless steel 500 17.94 0.04 Ballaigues, Switzerland
Carver 1 Stainless steel 500 21.73 0.04 Germany*
Carver (small) 1 Stainless steel 500 21.17 0.04 Germany*
Evacuation tip
adaptor 1 Polypropylene 500 3.31 0.01 Råå, Sweden
Small rectangular dish
1 Stainless steel 500 12.04 0.02 Stockholm, Sweden*
Tray 1 Stainless steel 2000 658.12 0.33 Upplands Väsby, Sweden
Shirt 2 50% cotton, 50% polyester 50 847.50 16.951 Lithuania
Pants 2 35% cotton, 65% polyester 50 601.86 12.041 China
Coat 2 35% cotton, 65% polyester 50 653.50 13.071 Lithuania
1 Clothing was assumed to be used for 30 patients a day. The weight adjusted for lifespan was divided by 30, before being entered into OpenLCA.
* Assumed location of origin.
APPENDIX 2
LIFE CYCLE INVENTORY
The production, use, disinfection, sterilization and disposal of all disposable and reusable instruments used was included. The production, washing and drying and disposal of dental clothing was also included. Water and energy use associated with the disinfection and steriliza-tion of instruments, the washing and drying of clothing and even the use of the dental unit were included (eg lighting). The disinfecsteriliza-tion of the
dental unit and the handwashing of the dentist was also included. For the purpose of this study, the construction of the faculty building and the production of large machines such as the dishwashers, the dental unit and other electrical appliances (eg computers) were excluded. Staff and patient travel were also excluded.
Transport
Transportation distances were based on the manufacturing locations of each product and the location of the distributors in Malmö, Sweden. For some products, such as the carver, manufacturing locations could not be found. These were assumed to originate from the locations of other similar products (see Appendix 1). The distance between the local distributor and the Faculty is minor and would likely result in negligible differences in environmental burden and was, therefore, excluded. Transport distances were estimated using Searates.20
Use
Disposable products were discarded after a single use. All reusable stainless- steel products were disinfected in the dishwasher after use. Data on the laundry and dishwashing procedures were obtained by direct observation. All reusable products are washed in the KEN IWD 2311 dishwasher. Twelve examination kits can be loaded during each cycle.
Average procedure times
The estimated time for an examination is fifteen minutes. The unit light was used throughout the full examination and no water is used. The other instruments were used for different periods of time, see below.
A summary of the average time, energy and water usage of an examination and the estimated usage time of instruments during each procedure.
Dental unit use during an examination
Duration (min) 15
Water usage (mL) 0
Machines used and rating Equipment usage (min) kWh exam
Dental unit motor (400 W) 1 0.4
Dental light (30- 40 W) 15 0.6
Unit screen (20- 30 W) 0 0
Instrument light (2.5 W) 0 0
Suction (9 kW) 0.5 0.075
Machines operated by compressor (9kW) 0.5 0.075
Total power consumed (kWh) 1.15
Energy and water consumption
The energy consumption (kWh) for electrical appliances included in the scope of the study was estimated by using the total running time for each standard program of the dishwasher, washing machine and dryer, or the average procedure time for the dental unit. Other programmes were not taken into consideration and excluded from the study. The amount of water consumed was obtained directly from the manufacturers of each appliance (see below). Relevant Faculty staff provided information on the type of electricity at the Faculty.
Energy and water consumption values for the machines used according to the manufacturers.
Machine Brand Power (kW) Time (mins) Energy consumption (kWh) Water consumption (litres)
Dishwasher KEN IWD 2314 1.00 50.00 0.83 55
Central compressor Kaeser SM15T 9.00 see Table 3 see Table 3 0
Washing machine Electrolux - 50.00 0.4- 1.0 197
Dryer Electrolux 24.00 15.00 6.00 0
Disposal/end of life
In this model, waste was assumed to be disposed of in a container and transported to a recycling area in Malmö where it is incinerated. The energy released from waste incineration is used for district heating. Transport to the recycling area was excluded from this study.
APPENDIX 3
LIFE CYCLE IMPAC T ASSESSMENT METHODS EMPLOYED IN THIS STUDY
Impact category Indicator Unit
Recommended default LCIA model Source of characterization factors Robustness Selected method in OpenLCA • Resource use,
fossils Abiotic resource depletion – fossil fuels (ADP- fossil)
MJ CML Guinée et al (2002)
and van Oers et al (2002). EC- JRC, 2017 III CML IA Baseline • Resource use, minerals and metals Abiotic resource depletion (ADP ultimate reserves) kg Sb eq CML Guinée et al (2002) and van Oers et al (2002).
III CML IA
Baseline • Acidification Accumulated
Exceedance (AE) molc H + eq Accumulated Exceedance (Seppälä et al 2006, Posch et al, 2008)
EC- JRC, 2017 II ILCD+
• Freshwater ecotoxicity
Comparative Toxic Unit for ecosystems (CTUe)
CTUe USEtox model (Rosenbaum
et al, 2008)
EC- JRC, 2017 III/interim ILCD+
• Freshwater eutrophication Fraction of nutrients reaching freshwater end compartment (P) kg P eq EUTREND model (Struijs et al, 2009) as implemented in ReCiPe EC- JRC, 2017 II ILCD+ • Human toxicity cancer effects Comparative Toxic Unit for humans (CTUh)
CTUh USEtox model (Rosenbaum
et al, 2008)
EC- JRC, 2017 III/interim ILCD+
• Human toxicity non- cancer effects
Comparative Toxic Unit for humans (CTUh)
CTUh USEtox model (Rosenbaum
et al, 2008)
EC- JRC III/interim ILCD+
• Ionizing radiation Human exposure efficiency relative to U235
kBq U235 eq Human health effect model as developed by Dreicer et al 1995 (Frischknecht et al, 2000)
EC- JRC, 2017 II ILCD+
• Climate change Radiative forcing as Global Warming Potential (GWP100)
kg CO2 eq Baseline model of
100 years of the IPCC (based on IPCC 2013)
EC- JRC, 2017 I IPCC 2013
• Marine eutrophication
Fraction of nutrients reaching marine end compartment (N)
kg N eq EUTREND model
(Struijs et al, 2009) as implemented in ReCiPe
EC- JRC, 2017 II ILCD+
• Ozone depletion Ozone Depletion Potential (ODP)
kg CFC- 11 eq Steady- state ODPs as in (WMO 1999)
EC- JRC, 2017 I ILCD+
• Photochemical
ozone formation Tropospheric ozone concentration increase
kg NMVOC eq LOTOS- EUROS (Van Zelm et al, 2008) as applied in ReCiPe 2008 EC- JRC, 2017 II ILCD+ • Terrestrial eutrophication Accumulated Exceedance (AE)
molc N eq Accumulated Exceedance (Seppälä et al 2006, Posch et al, 2008)
EC- JRC, 2017 II ILCD+
• Land use Soil quality index Pt PM method recommended
by UNEP (UNEP 2016)
EC- JRC, 2017 III ILCD+
• Respiratory
inorganics Impact on human health Disease incidence Soil quality index based on LANCA (Beck et al 2010 and Bos et al 2016)
EC- JRC, 2017 I ILCD+
• Water scarcity User deprivation potential (deprivation- weighted water consumption)
m3 depri Available WAter REmaining (AWARE) as recommended by UNEP, 2016
APPENDIX 4
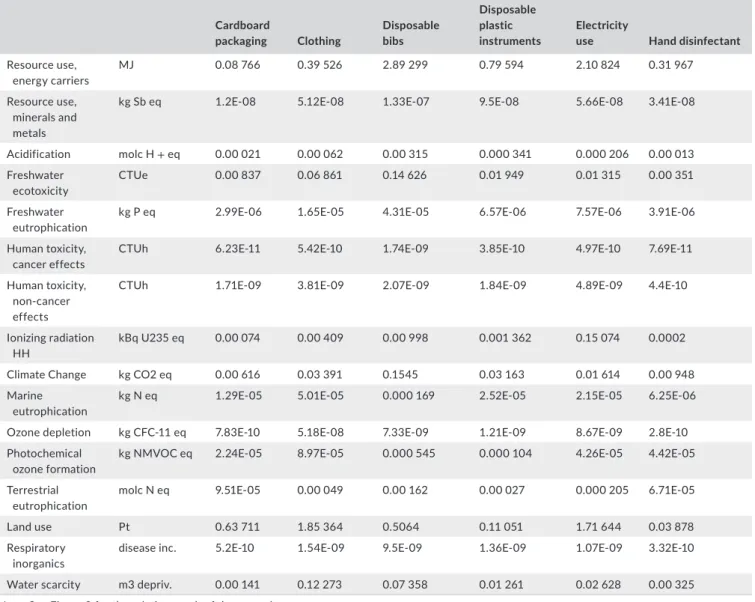
TABLE SHOWING THE FIGURES OF THE CONTRIBUTION OF E ACH PROCESS FOR ALL IMPAC T CATEGORIES
Cardboard packaging Clothing Disposable bibs Disposable plastic instruments Electricity
use Hand disinfectant
Nitrile gloves Sanitary paper Soaps and detergents Stainless steel instruments Surface disinfectant Transport Waste
management Wastewater Water
Resource use,
energy carriers MJ 0.08 766 0.39 526 2.89 299 0.79 594 2.10 824 0.31 967 1.07 881 0.19 901 0.9196 0.35 583 2.6794 0.10 025 0.06 267 0.04 054 0.0403
Resource use, minerals and metals
kg Sb eq 1.2E- 08 5.12E- 08 1.33E- 07 9.5E- 08 5.66E- 08 3.41E- 08 1.04E- 07 2.25E- 08 4.84E- 07 1.97E- 07 2.33E- 07 1.75E- 08 8.47E- 09 1.26E- 08 6.85E- 09
Acidification molc H + eq 0.00 021 0.00 062 0.00 315 0.000 341 0.000 206 0.00 013 0.00 041 0.00 054 0.00 198 0.00 044 0.00 137 5.97E- 05 6.75E- 05 6.29E- 05 0.000 246
Freshwater ecotoxicity
CTUe 0.00 837 0.06 861 0.14 626 0.01 949 0.01 315 0.00 351 0.02 088 0.0244 0.95 149 0.06 009 0.03 303 0.014 402 0.298 122 0.02 922 0.00 349
Freshwater eutrophication
kg P eq 2.99E- 06 1.65E- 05 4.31E- 05 6.57E- 06 7.57E- 06 3.91E- 06 4.54E- 06 6.93E- 06 3.97E- 05 1.15E- 05 1.4E- 05 5.9E- 07 5.02E- 06 7.81E- 06 1.82E- 06
Human toxicity,
cancer effects CTUh 6.23E- 11 5.42E- 10 1.74E- 09 3.85E- 10 4.97E- 10 7.69E- 11 2.41E- 10 2.39E- 10 1.96E- 09 3.72E- 09 5.79E- 10 4.61E- 11 1.11E- 09 6.75E- 10 2.54E- 10
Human toxicity, non- cancer effects
CTUh 1.71E- 09 3.81E- 09 2.07E- 09 1.84E- 09 4.89E- 09 4.4E- 10 1.75E- 09 7.23E- 08 8.04E- 09 6.11E- 09 5.54E- 09 8.93E- 10 6.75E- 09 1.11E- 08 1.08E- 09
Ionizing radiation HH
kBq U235 eq 0.00 074 0.00 409 0.00 998 0.001 362 0.15 074 0.0002 0.00111 0.00 167 0.00 557 0.00 267 0.00 428 0.000 505 0.000 277 0.000 268 0.00 084
Climate Change kg CO2 eq 0.00 616 0.03 391 0.1545 0.03 163 0.01 614 0.00 948 0.04 397 0.01 672 0.21 938 0.02 842 0.09 416 0.006 626 0.068 142 0.0039 0.00 236
Marine eutrophication
kg N eq 1.29E- 05 5.01E- 05 0.000 169 2.52E- 05 2.15E- 05 6.25E- 06 0.00 018 2.24E- 05 0.00 129 2.85E- 05 5.55E- 05 7.8E- 06 2.48E- 05 0.00 014 2.69E- 06
Ozone depletion kg CFC- 11 eq 7.83E- 10 5.18E- 08 7.33E- 09 1.21E- 09 8.67E- 09 2.8E- 10 2.69E- 09 1.28E- 09 1.13E- 08 1.62E- 09 4.44E- 09 1.49E- 09 8.44E- 10 2.34E- 10 2.02E- 10
Photochemical
ozone formation kg NMVOC eq 2.24E- 05 8.97E- 05 0.000 545 0.000 104 4.26E- 05 4.42E- 05 0.0001 5.25E- 05 0.00 068 7.74E- 05 0.01 974 2.7E- 05 4.93E- 05 1.76E- 05 8.01E- 06
Terrestrial eutrophication
molc N eq 9.51E- 05 0.00 049 0.00 162 0.00 027 0.000 205 6.71E- 05 0.0009 0.000 195 0.00 444 0.00 027 0.00 061 8.65E- 05 9.65E- 05 9.34E- 05 3.13E- 05
Land use Pt 0.63 711 1.85 364 0.5064 0.11 051 1.71 644 0.03 878 0.0795 10.91 459 27.59 603 0.12 352 0.19 844 0.08 862 0.059 334 0.02 202 0.02 008
Respiratory inorganics
disease inc. 5.2E- 10 1.54E- 09 9.5E- 09 1.36E- 09 1.07E- 09 3.32E- 10 2.47E- 09 1.21E- 09 1.96E- 08 1.7E- 09 3.53E- 09 3.95E- 10 4.48E- 10 4.46E- 10 1.59E- 10
Water scarcity m3 depriv. 0.00 141 0.12 273 0.07 358 0.01 261 0.02 628 0.00 325 0.0281 0.00 701 0.40 915 0.00 858 0.0312 0.000 695 0.008 398 0.26 104 0.28 384
APPENDIX 4
TABLE SHOWING THE FIGURES OF THE CONTRIBUTION OF E ACH PROCESS FOR ALL IMPAC T CATEGORIES
Cardboard packaging Clothing Disposable bibs Disposable plastic instruments Electricity
use Hand disinfectant
Nitrile gloves Sanitary paper Soaps and detergents Stainless steel instruments Surface disinfectant Transport Waste
management Wastewater Water
Resource use,
energy carriers MJ 0.08 766 0.39 526 2.89 299 0.79 594 2.10 824 0.31 967 1.07 881 0.19 901 0.9196 0.35 583 2.6794 0.10 025 0.06 267 0.04 054 0.0403
Resource use, minerals and metals
kg Sb eq 1.2E- 08 5.12E- 08 1.33E- 07 9.5E- 08 5.66E- 08 3.41E- 08 1.04E- 07 2.25E- 08 4.84E- 07 1.97E- 07 2.33E- 07 1.75E- 08 8.47E- 09 1.26E- 08 6.85E- 09
Acidification molc H + eq 0.00 021 0.00 062 0.00 315 0.000 341 0.000 206 0.00 013 0.00 041 0.00 054 0.00 198 0.00 044 0.00 137 5.97E- 05 6.75E- 05 6.29E- 05 0.000 246
Freshwater ecotoxicity
CTUe 0.00 837 0.06 861 0.14 626 0.01 949 0.01 315 0.00 351 0.02 088 0.0244 0.95 149 0.06 009 0.03 303 0.014 402 0.298 122 0.02 922 0.00 349
Freshwater eutrophication
kg P eq 2.99E- 06 1.65E- 05 4.31E- 05 6.57E- 06 7.57E- 06 3.91E- 06 4.54E- 06 6.93E- 06 3.97E- 05 1.15E- 05 1.4E- 05 5.9E- 07 5.02E- 06 7.81E- 06 1.82E- 06
Human toxicity,
cancer effects CTUh 6.23E- 11 5.42E- 10 1.74E- 09 3.85E- 10 4.97E- 10 7.69E- 11 2.41E- 10 2.39E- 10 1.96E- 09 3.72E- 09 5.79E- 10 4.61E- 11 1.11E- 09 6.75E- 10 2.54E- 10
Human toxicity, non- cancer effects
CTUh 1.71E- 09 3.81E- 09 2.07E- 09 1.84E- 09 4.89E- 09 4.4E- 10 1.75E- 09 7.23E- 08 8.04E- 09 6.11E- 09 5.54E- 09 8.93E- 10 6.75E- 09 1.11E- 08 1.08E- 09
Ionizing radiation HH
kBq U235 eq 0.00 074 0.00 409 0.00 998 0.001 362 0.15 074 0.0002 0.00111 0.00 167 0.00 557 0.00 267 0.00 428 0.000 505 0.000 277 0.000 268 0.00 084
Climate Change kg CO2 eq 0.00 616 0.03 391 0.1545 0.03 163 0.01 614 0.00 948 0.04 397 0.01 672 0.21 938 0.02 842 0.09 416 0.006 626 0.068 142 0.0039 0.00 236
Marine eutrophication
kg N eq 1.29E- 05 5.01E- 05 0.000 169 2.52E- 05 2.15E- 05 6.25E- 06 0.00 018 2.24E- 05 0.00 129 2.85E- 05 5.55E- 05 7.8E- 06 2.48E- 05 0.00 014 2.69E- 06
Ozone depletion kg CFC- 11 eq 7.83E- 10 5.18E- 08 7.33E- 09 1.21E- 09 8.67E- 09 2.8E- 10 2.69E- 09 1.28E- 09 1.13E- 08 1.62E- 09 4.44E- 09 1.49E- 09 8.44E- 10 2.34E- 10 2.02E- 10
Photochemical
ozone formation kg NMVOC eq 2.24E- 05 8.97E- 05 0.000 545 0.000 104 4.26E- 05 4.42E- 05 0.0001 5.25E- 05 0.00 068 7.74E- 05 0.01 974 2.7E- 05 4.93E- 05 1.76E- 05 8.01E- 06
Terrestrial eutrophication
molc N eq 9.51E- 05 0.00 049 0.00 162 0.00 027 0.000 205 6.71E- 05 0.0009 0.000 195 0.00 444 0.00 027 0.00 061 8.65E- 05 9.65E- 05 9.34E- 05 3.13E- 05
Land use Pt 0.63 711 1.85 364 0.5064 0.11 051 1.71 644 0.03 878 0.0795 10.91 459 27.59 603 0.12 352 0.19 844 0.08 862 0.059 334 0.02 202 0.02 008
Respiratory inorganics
disease inc. 5.2E- 10 1.54E- 09 9.5E- 09 1.36E- 09 1.07E- 09 3.32E- 10 2.47E- 09 1.21E- 09 1.96E- 08 1.7E- 09 3.53E- 09 3.95E- 10 4.48E- 10 4.46E- 10 1.59E- 10
Water scarcity m3 depriv. 0.00 141 0.12 273 0.07 358 0.01 261 0.02 628 0.00 325 0.0281 0.00 701 0.40 915 0.00 858 0.0312 0.000 695 0.008 398 0.26 104 0.28 384