. .. 5. ;_ .- i A - _ . ~ . I V . .I _ v, l, 'v . . ... . x ', , « v I _ v vL ) .' -» ~ . ' _ - .. " , 5». -> . r. . I . . ' . a - > . _ , v H - , . ._ . - l, ; V" L' , - u ,- u, , . ,2 v " - ' . l. . . 5 ,. H _ ._ ~ - ~oa~ '11: pmgr-w > .'-? 't 1 , '.- l'. .~ * ' x . ~ Z . , .. r - i " ' _ r_ u \ . u; . _I _ A , , ,. I . - ..u . " ., _ - . .' . I ,r_ . - i . . t y . n . ., ¥ ' v v _ . ~ ;, I _ "' "' 5I 1 u ' . u 5 . 1- 1 A . '1 - 1 -. v . -_ ' .1 I ,.~, v I 3 c . , . < - a , ' . v_ i ' , s - i ' - CA , \ ' . ' \- - Q ' I . t v . . ~ 1 r . ) vx . ' . ,1 _ _ ' . . . , A, . , I, . '. I . , 1 . , . 3 I v . - -.. v , , , " t 1 v . v _ ~ a {r "- _ y v u .y A . . .r . . ' ~ , 9 . - - , , . ' w r - v . r i . I .v . . , i . . 5 . . '1 v A r ¢. 1 ' r , i y ' - ," _ . 1' 'n A J . . .. x ,. . ' _ , _ . . . r _ 'V i. , _ . . . , ' ' ; .. . . 3 ' a. I . -» . , -. . ' V _' . . _ 1 ~ - . K 1 3 - . . - « r 1 . . . r . A - . l ' ' ' x x b y _ ' ' _ - v. y , I A -: I ' 4 I ' I J g \ v ., 4 . . \ y a 1 v_ . I o .4 l . \ 1 K \ , ._ . , , . .1 ' 7 ' - . . 3 . . s. - _ ., " n ' A . ~ 1 . . ( ' 'a a ' ;, \ - . ' r a A, I . l . V . § . _ - . . . \ p - A- .f . - r x. \K I V . , ' . V, . . ~ S. . A . . ' - . ~ < ' u _ \ , - ._ i . l . , . \ . , 4 . V . .y. ' ' . n . n . *1 - ; "I - -. . r. . l . x n . _ -, r , -. . A '. . .r. l. y 4.a- ... ' v - ' «Ir » . ' " y - . . " . . ,_ I . I , ' ~ 7 _ . v: _ _ u. N - . . - » - . . r ,. - , - _ .. , J ._ "a. 1 , k - ~- .. ~ , r . , ' » . ~ - - . ' , r. ' . "w'..' _. l: .~ . . s "
RAPPQRT
Nr 171 A - 1978
Statens véig- och trafikinstitut (VI'I) - Fack - 581 01 Linképing
ISSN 0347-6030 National Road & Traffic Research Institute - Fack - S-58101 Linkbping - Sweden
Spray Protectors Testing
of Efficiency
The work presented in this final report was sponsored by:
The Swedish National Board DevelOpment of measuring
for Technical DevelOpment, methods and basic equipment
Stockholm
Andrzej T. Iwanicki, Enskede, Testing of spray protector Sweden
Marknads-Innovator AB, Testing of spray protectors
Sundbyberg, Sweden
Monsanto (Deutschland) GmbH, Testing of spray protector
Dusseldorf, West Germany
The National Swedish Road Testing of spray protector
and Traffic Research Insti-tute, Linkoping
The main part of the work was sponsored by the Swedish National Board for Technical Development.
The report is also issued in a Swedish version: (Rapporten utges ocksa i en svensk versionz)
SANDBERG, U: Provning av stankskydd. Rapport nr 171, Statens vag- och trafikinstitut, Linkoping
(1978).
Other reports produced in this work are:
VTI REPORT NO.
SANDBERG, U: Splash and Spray from Vehicles on Wet Roads - A bibliography. The National Swedish Road and Traffic Research Institute, Linkoping
(1977 78).
SANDBERG, U: Matning av stank fran fordon pa vat vagbana (Measurement of Splash and Spray Generated by Vehicles on Wet Roads - A Pilot Study). Report no 124, The National Swedish Road and Traffic
Research Institute, Linkoping (1977) (In Swedish).
Page ABSTRACT I SUMMARY II 1 INTRODUCTION 1 2 BACKGROUND 3 3 PURPOSE 4 MEASUREMENT METHOD 5 Measurement of visibility 5 4.2 Other measurements 6 Specification of instruments 7 EXPERIMENTAL PROGRAM 12 Measurement procedure 12 Experimental parameters 12 Pavement 13
The test vehicle 14
Tested spray protectors 14
ANALYSIS PROCEDURES 22
Analysis of spray measurements 22
The influence of secondaryparameterss26
. Subjective estimations from films 27
7 EXPERIMENTAL RESULTS 30
7.1 Measurements 30
7.1.1 Spatial distribution of spray 3O
7.l.2 Single and overall measures of spray 30
7.1.3 Experimental accuracy 45
7.2 Results from subjective evaluation 48
7.3 Studies of correlation between 53
objective and subjective methods VTI REPORT NO. 171A
\ l \ l \ l \ l \ l O o m o o o o o o o o o o m o o o o o o m o o o o OO K O K D Q D K O K O 10 ll
VTI REPORT NO.
w no H +4 H F4 H +4 H +4 H +4 H :vl >( ;\ )[ \.>l --l c o c o . # # n b vb -p b a U J r o H K O O ) \ I O \ U T I -I > W N I |_ | 0
Influence of secondary parameters Speed Water depth Ambient illuminance Wind DISCUSSION Experimental results General Uncovered wheels Standard Model GW 1 Model GW 2 Model GW 3 Model GW 4 Model IW
Swedish spray protectors
Monsanto Spray Guard (model M) Model VTI
Subjective estimation
Correlation between the objective and subjective methods
The measurement method CONCLUSIONS
Experimental technique
Spray protector characteristics Ranking of the spray protectors Other conclusions RECOMMENDATIONS REFERENCES 171A Page 56 56 57 57 58 6O 60 6O 61 61 62 62 62 62 62 63 63 64 64 65 68 68 69 7O 71 72 74
With the purpose to investigate the efficiency of some new spray protector designs for heavy vehicles, tests have been made of spray generation from a two-axle truck
equipped with these devices. The experiments were made
on an artificially watered test track at two vehicle speeds and two water depths. The intensity of the spray was measured by special measurement equipment, which in principle is measuring the reduction of light trans-mission made by the spray in different positions and directions in relation to the vehicle.
Altogether 9 different spray protector designs were tested, of which one type was a standard Swedish spray protector as stipulated by road safety authorities. Analysis was made of measurements as well as of slides produced from films of the spray generation. The rank order of the spray protectors was essentially indepen-dent of what evaluation method that was used. The most efficient spray protector was 30-45% more efficient concerning spray reduction than the standard Swedish spray protector. Further tests are reCommended for this type of protector as well as one of the other tested types.
The report contains an extensive description and ana-lysis of the measurement and evaluation technique and also presents a relatively comprehensive collection of measured spray prOpagation curves behind the vehicle. An analysis is also made of details in the spray mea-surements and the consequences of this for some of the spray protectors. On basis of the results some recommen dations are made,concerning possible improvements in protector design.
II
SUMMARY
With the purpose to investigate the efficiency of some new spray protector designs for heavy vehicles, in relation to the standard type used in Sweden, tests have been made of spray generation from a two axle
truck equipped with these devices. In order to reduce
the cost to a reasonable level, the experiments were
simplified so that only the rear wheels were protected by the devices, while the spray generation from the front wheels was eliminated by enclosing the wheels. The tests were performed by repeatedly running the test vehicle on a preparated, sprinkler watered test track through an area around which was placed different kinds of measurement apparatus. For each of the spray protec
tors a series of measurements was made at two vehicle
speeds - 70 and 90 km/h - as well as at two water depths. The spray was measured according to a new measurement method involving the measurement of the spray induced reduction of visibility (properly the light transmission) transversal to the driving direction as well as l m to the sides of the vehicle. The reduction of visibility was continously recorded during the vehicle runs, and from this, a measure is obtained representing the varia-tion of the spray intensity at different distances
behind (up to 100 m) and along the vehicle.
Altogether 9 different protector designs were tested, of which one type - constituting the reference case was standard Swedish spray protectors as stipulated by road safety authorities. Also tested were uncovered wheels. The remaining 7 types were "inventions" (one type from the USA and six types from Sweden) using
either the principle of directing air streams and spray around the wheels in apprOpriate ways, or the principle of reducing the impact generated fine spray, preventing it from re-entering the air streams and instead have a controlled water run off.
In the analysis of the measurements/curves of spray spatial distribution behind and beside the vehicle were produced,as well as overall figures representing the average reduction of visibility for the respective spray protector. Beside these objective methods, unbiased
subjects made a subjective estimation of the spray generation based on the comparison of slides produced from films of the spray.
The measurement method was satisfactory. The agreement between the objective and the subjective evaluation was quite good, which means that whatever method was used, the ranking of the spray protectors was essentially the same.
Concerning the results, it is primarily referred to table 1 below and the figures 32, 33 and 34 in the
report (the used denominations are explained on sidel4). It appears that the most efficient spray protector -called GW 1 - reduced the spray intensity by 30-45%
(depending of the scale of estimation) with reference to the standard Swedish spray protectors. This protector consists of an expanded metal grid placed on the inside of the existing standard fender and also on the mudflap. All tested new spray protectors were more efficient than the standard type, except one type called GW 2. The
worst of the arrangements was uncovered wheels, which meant a considerable impairment of spray generation, however only at distances very near to the vehicle. For certain protectors a detailed analysis is indicating some characteristics leading to recommendations that probably could give a more efficient design.
IV
Tested Spray Improvement in "visibility" in % re
protector type standard Sw. spray protectors
(approximation)
Transversal Side Subjective
measurement measurement estimations
1 GW 1 30 30 45 2+3 GW 3, Iwanicki 25 10/15 40/35 4+5+6 Monsanto, VTI, GW 4 20 20/10 25/10 7+8 Standard, GW 2 0/15 0/ 10 0/-5 9 Uncovered wheels 35 5 -150
Table I. Ranking of the tested spray protectors on the
basis of the two visibility measures (transversal and
side measurement) as well as the subjective estimations. Of other results it can be mentioned that an increased vehicle speed from 70 to 90 km/h gave an increase in spray by a factor of 2,2.
The obtained spray intensity reduction is enough high
to motivate further experiments, with the object of investigating the efficiency for the spray protectors when mounted over all wheels on a larger vehicle than so far has been used. Additionally the serviceability is necessary to investigate. The protectors recommended for further tests are two types combining efficiency
with simplicity, namely the above mentioned type GW 1
and the type Monsanto Spray Guard. The latter consists of plastic sheets hanging down behind the wheels and covered with a blade matrix suggestive of a "grass" imitation.
If further experiments will display no important dis-advantages for the spray protectors, they can be used as an alternative or a substitution for the present types. Consequently spray nuisance on roads can be
reduced, for the benefit of traffic safety as well as the environment around the roads.
The risk for traffic accidents is significantly higher when roads are wet than when they are dry. Mainly this is due to a decreased skid resistance between tire and road, which is caused by a water film more or less inhibiting an efficient tire-road contact. Another po-tential accident risk is the reduction of visibility, eminating from a vehicle user coming close to another vehicle which is pulling up and dispersing a cloud of dirt and water droplets from the wet road. It is possible that not only the reduction of visibility but also the increasing mental burden - caused by frequent showers from approaching or overtaken vehicles - is contributing to a decreased traffic safety.
One of the most severe situations a vehicle driver
normally - and also quite often experiences, is in
fact caused by spray from vehicles, namely when a long vehicle combination will be overhauled on a dirty and wet road under circumstances that moreover may mean a decreased luminance through dirty headlights and a decreased skid resistance.
In Sweden the question of spray from vehicles on wet roads should be particularly important due to the existance of a great percentage of heavy vehicles on roads often covered by rain, snow slush or snow melted by road salt. The wear from studded tires in Sweden is aggravating the problem because of the increasing dirt which is a catastrophy for visibility;partly through a visibility reduction in the air and a dirty front
window, partly through decreased luminance from dirty headlights or other vehicle lights. Additionally there are suspicions that spray indirectly can cause insect infiltration in woods near salted roads, which can be of great economic importance.
So far the question of possible spray nuisance reduction has not been paid attention to in Sweden. This can be due to a certain time lag between origin and reaction and also that it is during the two latest decades that traffic intensity, the percentage of heavy vehicles, wear from studded tires and vehicle speeds have reached
levels that high that these four factors in combination have caused our present problems. However, attention to the spray problem is now increasing, and certain
measurements in Great Britain and USA (not yet published) are showing as well as this report, that in fact it is possible to reduce spray by reasonable measures con cerning spray protectors on heavy vehicles.
During 1976 77 two Swedish inventions concerning new spray protectors were presented to the Swedish National Board for Technical DevelOpment (STU). STU consulted the National Swedish Road and Traffic Research Institute
(VTI) which found it motivated to test the inventions due to the urgency of the problem, the reasonable approach to the problem made by the inventors and
certain foreign research results indicating that it was possible to reduce spray by better spray protectors. VTI was contracted by STU to perform the testing. Earlier experience in Sweden was very limited (ref /l, 2, 3/) and could not be utilized due to the primi-tive methodology that was used, and the initial work had to concentrate on getting new measurement methods and equipment.
Besides the mentioned inventions the final testing included two reference cases, a new spray protector from VTI and an interesting American spray protector. The latter (Monsanto s "Spray Guard") had performed
extremely well in American tests according to preliminary verbal information and must be considered having good chances to come into practical use. However, an earlier test (ref /4/) using a fundamentally rather similar device gave only some 10% in spray reduction.
Due to the great uncertainty about the expected result combined with the lack of equipment, it was decided to make the tests as simple as possible without sacrificing
too much accuracy. In order to keep the cost of produc tion for the complicated prototypes low, protectors were mounted only over the rear wheels on a two-axle truck trying to eliminate the spray from the front wheels as much as possible. In this way meaningful comparisons still may be made. If, and only if, any spray protector was found to be efficient in the tests, there were reasons to proceed with "full scale" tests.
PURPOSE
The purpose for the tests was to of new types of spray protectors vehicles are enough efficient to development. Only spray reducing
investigate if a chOice intended for heavy
motivate an extended qualities were to be investigated, thus the in-service capabilities of the new protectors have not been tested.
In the case of a positive result, later tests would be
necessary to finally ascertain if the new spray protec tors could replace the in use protectors with an improved efficiency. "In use protector devices" here means the standard Swedish spray protectors stipulated by the National Swedish Road Safety Office.
Measurement of visibility
The measurements were made on a test track (Mantorp racing track) where a test vehicle was passing the measuring instruments several times for every tested case. The propagation of spray was measured together with a lot of other parameters. A sprinkler system
(fig 1 and 3) watered the test track.
The nuisance made by spray is mainly a visibility reduction, and therefore it is primarily desirable to measure something having a distinct relation to this visibility reduction. That is how work has been going on in Great Britain and USA (utilizing laser light) and it was decided to use the principle also in this
project. Due to a desire to increase the realism and have more detail information about spray propagationx, some essential deviations from the foreign methods were made. Motives and characteristics for different spray measurement methods as well as a review of so far utilized technique is included in ref /5/.
It is interesting to know the spray propagationx both behind and beside the vehicle (compare driving behind a vehicle as well as approaching and overhaulingl). For that reason apparatus was constructed capable of measuring this, including spray at bgth sides of the vehicle in order to compensate for influence of side winds (which turned out to be very important) and
enhance the accuracy. There are three different instru-ments each measuring the light transmission over a
certain distance. Each instrument consists of a
trans-mitter for light having a frequency spectrum correspon" X or spatial distribution of spray
ding to daylight, and a detector (receiver) adapted to the spectral characteristics of the human eye. The effort is to imitate the conditions applicable to the human visual organs as close as possible. Additionally there are electronics for, among other things, filtering and demodulation of the transmitted light signal and make the output insensitive to any ambient light. One visibility meter was placed to measure the visi-bility reduction (i.e. the reduction of light trans-mission) over an 8 m distance transversal to the
driving direction (transversal measurement). See fig 1. The other two meters were placed to measure the visi-bility reduction parallell to the driving direction over a 2 m distance (side measurement). The distance to the sides of the vehicle was 1 m when the vehicle was at the nearest point. Due to the short distance
transmitter receiver, the spray propagation behind and beside the vehicle can be measured with a resolution of approx 2 m. Thus, the output signal during the
vehicle pass by is corresponding to a "spray intensity" (represented by the reduction of light transmission over the 2 m long distance) as a function of distance behind the vehicle, see fig 20 31. The average measu ring height was 1,1 m. This is approximately corres-ponding to visual height for modern passenger cars.
Other measurements
Besides the visibility measurement the vehicle runs were filmed from a position 65 m from the main instru-mentation area at a direction behind the vehicle at
a pass-by. As a background,large "chess boards" were
used (an idea coming from USA), see fig 4. A camera was taking still photographs of the vehicle spray
"cloud" from a position 50 m at the side of the vehicle. As a background for this, an array of blackpainted
boards were used, see fig 5. VTI REPORT NO. 171A
(position sensors, see fig 1) and then made a computa-tion of the speed. The posicomputa-tion signal was used also to synchronize the laboratory analysis and the pictures. Wind speed and direction were continously monitored by an electronic equipment. The momentary values of wind: speed and direction were noted for each vehicle pass. The same is valid for the ambient illuminance measured by a photometer . Water depth was measured on 24 defined positions on the test track by special equipment.
All visibility signals as well as position data were recorded for later data analysis. An outline of the measuring area is given in fig 1. Fig 2 is a block diagram showing the measurement equipment.
Specification of instruments
Yl§l§lli22_@§3§£
VTI constructed instrument. Light transmitting area 0,2x0,2 m2; spectrum like daylight. Detector (UDT PINlODP) including CIE-filter and luminance probe.
Step response (total) is approx 0,1 5. Relative calibra-tion by a special diffuse sheet.
§2§s§_ms§§2£;99_sg2ipmsaf
Microcomputerized special equipment for VTI. Accuracy approx t 0,1 km/h. Outputs for trigger pulses for external equipment. Optical position sensors.
EEEEEETSEE_§9£_T§§§E£§T§EE_9§_TEE§_§B§§§_§E§_SEESEEEQE
Model SMHI. Digital display of speed and direction; momentary or average (10 min).
Photometer
UDT model 40 X with CIE-filter and diffuser. Analog indication of illuminance in lux.
229s_£§99£§s£
TEAC model R 7OA. 4 FM channels utilized.
W§E§£_§§EEE_E§E§£
Type 1: "Electric needle type" with lamp display, see ref /5/. Steps of 0,2 mm. Type 2: "Metal comb type". See ref /5/. Steps of 0,25 l mm.
Eilm_9§ms£§
Beaulieuli zAutomatic (16 mm).
§§ill_229299£§2h_§§ms£s
Pentax KM. Including an extra syncronizable solenoid trigger.
Q§ElllQ§EQB§
Tektronix 5103 N Memory oscilloscope, with plugs 5Al4N
(4 ch ampl) and 5BlON (time base). Oscillosc0pe camera Polaroid CR9 Land Camera.
Matn. och hast. Meas. and speed Sidomatning (vanster) Side meas. Om C av vindrik n. of wind dir. left) 10m
\
§ 1 :g run dt avl or (s va rt a) 1, 2X 40 m Ba ck gr oun d boar d: a -,, _. _r , A TValve /\ Vatten fr. brandpost Water supply 20n1 1 Fig l
VTI REPORT NO.
Filmkamera 171A A
1P
F O l Ventil1P
ll!
{3 . . . . . . . . . . . . . c . . . . ' . . . . . . . . O 0 . 0 0 0 0 0 0 I O O I O O U I I O O O . . . . 1 . I Positionsdetektorer Position sensors0(
Sidomatning (hoger)0 Side meas. (right)
Tv rsmatning Transversal measurement O O O O O O O O O O C O O O O O O O O I O O O A A -. A -A -A -A -. 0 . . . . . . . . . . O . . . O O . . I _ I ' V ' V V U V V V Positionsdetektorer Position sensors )3 )
-._.O<_
:oziz
2%: Kamera 2:. (5C n) b : Ljustransmissioasmatare: : Light transmission meter:sandare (transmitter) wi n) Mottagare (receiver) 1 . . . . . ¢O . . O O O O O O O O O O O O I O O O O O I C O O 0 . 0 0 . . . . A A A A A -A -A A A A A J A A n L -A -A A L L A A A A A A O . 0 . sprinkler
6..
i! . O O I O . O 4 1 -. I n . l J l l A -l I L A -A A A A -A A A A -Q A A -A A 4 A A 5 Om 9P5: C:) ningsbelysningI'I'I': Mess. of ambient
§§§I illuminance
Vattentackt matstracka (90m) Wet track . 0 . O . . 0 4
Skiss over matomrédet Scetch of measuring area
>
Matnlng av omglvlO
Bandspelare
Siktmatare/Visibility meter Tape recorder Oscilloscope
r"sandare IMottagare 1 5 tvars I "i transv l Ho t I H 4S L I 3.4 v aide n1 WW H 3 S'lie If - 2 H o | k . I LL! E "\ if I 3 (U ' In it
I
Q
dida.
r
E o c : i r #ide r {mm-m. {Eansmitter Receiver J Hastighetsmatutrustning Speed measuring equipmentr Positions ivare 1
I
g
$4I
; ~4wv» 0 >4 ! > U | Q) I CU O 4 1 I "U H D ' o o a'
:2 g s u
I amm9 : o I l A g Position sensors J Kamera Film-+solenoid kameraProbe Hast.givare Riktn.givare
speed direction
__"__ transd. transd.
Vattendjups- . .
matare Fotometer V1ndhast.£&-r1ktn.
water depth Photometer Wind speedékdirect.
meter
Fig 2. Blockschema over matdatainsamling
Block diagram of data aquisition VTI REPORT NO. 171A
Fig 3. Test track seen towards driving direc tion. Film camera in car in background
Fig 4. End part of the
test track. "Chess boards as a
back-ground for filming
Fig 5. The Visibility
meters. Inside the Al cases are the
light transmitters;
behind the black tubes are the detectors
(receivers)
VTI REPORT NO. 171A
12
EXPERIMENTAL PROGRAM
Measurement procedure
A test vehicle equipped with the respective spray pro tectors was running on a preparated, sprinkler-watered test track around which was placed different kinds of measurement apparatus. For each spray protector three or four test series were made, each representing a certain water depth and speed. In each measurement series lO-20 runs were made. In total,approximately 500 test runs were registered.
The test for the reference protectors were duplicated and made at different days with other tests in between. No differences that cannot be eXplained by statistical methods were obtained.
Experimental parameters
Spray was tested at two speeds, 70 and 90 km/h. Lower speeds will give a very low spray intensity and higher speeds are very rare and are also difficult to obtain on the available test track.
The water film depth on the road surface is very impor-tant to the spray. The available test vehicle was
generating a relatively small amount of spray and to compensate for this, a greater water depth was chosen than would else be necessary (although it has been very common to use corresponding water depths at spray tests, ref /5/). Another reason for the selected water depths, is the desire to saturate the fenders on the relatively short, wet test track. Increasing water depth means that the side splash will increase more than the spray hitting the spray protectors. This means VTI REPORT NO. 171A
that the relative amount of splash and spray possible to control by the protectors is decreased, and there-fore it could be expected that the relative efficiency of the spray protectors should be better at lower water depths.
Originally it was meant to use only a water depth of 1,5 mm. This was obtained when the sprinklers at full capacity were switched off at a certain time before the vehicle was entering the test track. Additionally some pilot tests were made when the sprinklers were not cut off during the passes. The spray generated by the water beams hitting the vehicle was found to be very weak relative to the spray coming from the tires
(this was testedby running on a dry track with the sprinklers momentary switched on) so it was decided to make measurements also in this way. A water depth of
2 mm was obtained by this. The sprinkler-generated spray may have had some very little influence when measuring at this 2 mm water depth, but the influence would be the same for every tested object. On the films, however, the sprinkler-spray gave a slight "fog" in the foreground at this test series, but the influence was the same for every spray protector also in this case.
Pavement
The pavement on the test track was asphalt concrete type HABlZT with a relatively unworn surface. See figure in ref /ll/. This pavement is very common in Sweden. The absolute amount of spray is probably in-fluenced by pavement type, but for comparisons between spray protectors the road surface is supposed to be insignificant.
14
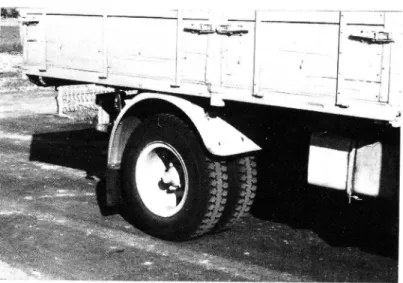
The test vehicle
The test vehicle was a two axle truck, see fig 6. In order to reducet mecost for testing and for production of prototypes, the protectors were used only on the
rear wheels while the front wheels were totally enclosed which hOpefully eliminated the spray from the front
wheels (see chapter 8.4). The enclosures were earlier used in a noise project and a simple spray test indi cated that the enclosures were very efficient (ref /2/). The tires (Firestone SATlOOO 9.00R20 PRl4) had been
run less than 3 000 km.
Tested spray protectors
In tables and diagrams a short notation is sometimes used to define the spray protector type:
OSK Uncovered wheels
REF Standard Swedish Spray protectors
GW l,2,3,4 = Model GW type 1, 2, 3 or 4
IW = Model Iwanicki
M = Model Monsanto Spray Guard
VTI = Model VTI
§E§2§2£§_§wséi§h_§9£22_2£92s229£§
The reference case was the type of spray protector very often used on Swedish trucks as stipulated by the National Swedish Road Safety Office (ref /9/). See
fig 7.
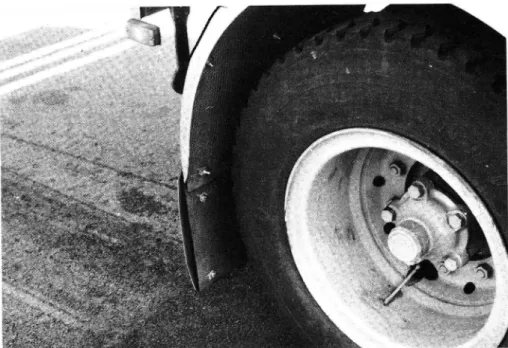
Hgssys£s§_whssl§
By this is meant the vehicle without any kind of spray protector covering the test wheels. See fig 8.
§W_Eype_l
A patented invention by Ake Weimar/Hans Gustafson. For every GW type there are one or two sheets of expanded metal grid, mounted on the inside of the normal standard
fender and also on the mud flap. The distance fender -grid is 20 mm.
The principle is that the water drOps are thrown through the expanded metal grid and not returning but collected and streaming off on the inside of the original fender. Type 1 consists of one sheet of expanded metal, mesh size 6x4 mm2. Fig 9 10.
§W_Eyps_2
Type 2 consists of one sheet of expanded metal, mesh size 28x6 mm2.
§W_EyEs_§
Type 3 consists of one sheet like type 1 nearest to the fender, and another sheet like type 2 on the out side (20 mm from sheet 1). Fig ll.
§W_EYE§_é
Type 4 consists of one sheet like type 2 nearest to the fender and another sheet outside sheet 1, with the mesh size 28x8 mm2.
M9§sl-£wsaiski
A patented invention by Andrzej T. Iwanicki. It is best described by fig 12 13. The construction is quite compli-cated and uses an air intake at the front as well as
metal "wings" on the inside, with the purpose of direc-VTI REPORT NO. 171A
l6
ting the air streams in an apprOpriate way. The lower part of the protector is meant to be movable vertically/
backwards.
Principle: The air streams are directed and/or restrained with the purpose to prevent the spray from being pushed out at the sides.
M92§§EEQ-§EE§Y-§E§£Q
The Spray Guard is patented by Monsanto and described in ref /lO/. It consists of sheets of polyethylene
covered by a matrix looking like short "grass" (fig 14).
The main sheet was mounted vertically rear to the
wheels and another sheet was mounted as a side valance over the top of the wheels. Fig 15 16. The mounting was somewhat provisory and it can not be excluded that
a more appropriate mounting could have beenbeneficial
to the spray reduction.
Principle: The blade matrix of the sheet captures the water droplets and returns the water in free-running streams to the road.
M9ésl-YTl
This is a construction made at VTI (the National Swedish Road and Traffic Research Institute). Essen tially it is a fender with side valances and,on the inside,longitudinal gutters. See fig 17 18. It is meant to have a flexible lower part, although the prototype was rigid.
Principle: The water droplets are deflected towards the fender back sheet and are, after bouncing or dripping from the fender, prevented to return out in the air stream by the gutters. The water is then collected and flowing downwards in the gutters.
Fig 8. VTI REPORT NO. 171A
Uncovered wheels
Fig 7. Standard Swedish 8pray protectors
i ,, . AW , g gi mfiw
VTI REPORT NO. 171A
Fig 10. Model GW type 1
// I I, _/ %%./ / V %/ /Z 1% %%,9
Fig 9; Model GW type 1 18
Fig ll. Model GW type 3 Fig 12. Model Iwanicki Fig 13. Model Iwanicki. Air intake at front
20 Fig 14. The matrix of blade elements in Monsanto s Spray Guard
mmm '.\k\\\\v\ ¢w
Fig 15. Monsanto Spray Guard w..~m~.wW >:~ w W Fig 16. Monsanto Spray Guard
W o -" y. A. A
Fig 17. Spray protector type VTI
gutters; Fig 18. View of inner profile, with
spray protector type VTI
22
ANALYSIS PROCEDURES
Analysis of spray measurements
Esasrél
For each tested combination of spray protector, speed and water depth, 10 20 vehicle runs were made and for best accuracy these runs were averaged. Certain runs were however omitted because of strong wind, occasional misses in measurement of some parameter, or any other noticed defect.
For the analysis of spray measurements a configuration according to fig 19 was used. Low pass filtering was made in order to exclude irrelevant information and noise.
§E§Ei§l_§l§E£l§EEEQB-EE£Y§§_9§_§E£§Y
The recordings of the spray time functions at the
vehicle runs were playbacked and converted into digital form for the data analysis. The average for the spray time function was computed for all measurements having the same conditions. The number of useful vehicle runs was 10 13. Most of the curves obtained are presented in
fig 20 31. The averaged curves were computed for every measuring position: Transversal, left hand side, right hand side. Additionally both sides were averaged into a new curve called"side measurement", which then
normally was used to characterize the spray beside the vehicle. The advantage of this, is an increased accuracy and a partial compensation for influence of side winds blowing spray towards one side.
The spray distribution curves are time functions but can also essentially be considered as position or VTI REPORT NO. 171A
spatial functions (position relative to vehicle) and can thus be used to estimate in which areas behind the vehicle different spray protectors are causing the most severe spray.
Eh§_§§§2£;92;99_9£_2h§_§E£§y-9l92§_§y_§_§i§gl§_m§§§g£e
In order to get overall measures for comparisons of
visibility reductions through the entire spray cloud,
the average of each curve was calculated: X
l 2
Ux = X2 X1:7 J/r s(x) dx:
X1
Ux = average for each passby s(x) = spray distribution curve
x = distance behind vehicle rearmost point X1, X2 = limits for the calculation
Bandspelare Tape recorder Im ) pt ; TEAC R7OA
f -"- -"- -' - - - g - ~ '_ _"1 I
t
O
' Skiv-I minne ' Disc Filter ' memory Krohn Hite I 3343 I tvars Itransv. LP BOHZ ADC M Digitaldator
V. sida ADC ___. Digital
1. side | computer
h. sida LP 3OHZ I ADC EAI Pacer
r. side I 100
,
LP lOOHz
'
ADC
64 kbytes
position I I 14 bit I o ' A Osc1llosc0pe ' Bildskarm I Graphic ' display I . ' Hard co y unit |
Kopierings-'
l
Tektronix I R564B IDel av hybriddator EAI Pacer 600
_ _ - - . - - ~.
Part of hybrid computer L.
Fig19e Blockschema over analysapparaturen
Block diagram of analysis instrumentation
VTI REPORT NO. 171A
L.
..
..
..
._
-_
..
..
-.
..
__
__
..
..
._
..
_.
._
..
..
._
._
..
..
._
For transversal measurements X1 = 3 m and X2 = 103 m were chosen. For side measurements X1 = 7 m and
X2 = 93 m were chosen. Thus the total distance for calculating average was always 100 m.
Those passby averages were in their turn averaged with others from the same measurement series in order to obtain an ensemble average for each entire measurement series, i.e. for each spray protector at a given speed and water depth. The ensemble averages are collected in table 1 (though left and right hand side measurements are not specified separately, but combined). The corres-ponding standard deviations and confidence intervals were also calculated, of which the latter are shown in
table 3. Unfortunately it was not at this time possible to make a full analysis of variance.
To simplify comparisons between Spray protectors the "absolute values" in table 1 have been transferred to relative (%) in table 2 where the respective value for the standard Swedish spray protector constitutes the reference (100%).
strsll_ms§§2£s
The tests have been made for a couple of speeds and water depths. For an overall estimation for a given spray protector it is however feasible to have a representative overall measure. The results for the
different measurement series (the 3 4 ensemble averages) therefore have been combined into an overall value
which simply is the arithmetic mean of the ensemble averages (the right columns in table 2). The relevant combinations speed/water depth have got the same weight, as there are at present no evident motives for another weighting.
26
The influence of secondary parameters
Variables (parameters) having a secondary influence on the spray measurements are vehicle speed, water depth, wind speed, wind direction and ambient illuminance.
Yehisls_§9ss§
The nominal speeds were 70 or 90 km/h. Deviations from this will mean a different spray generation. Analysis of this influence can be studied in chapter 7.4.1. The average speed for each measurement series have been computed and a correction for deviations in this from
the nominal speed have been included in the spray
figures.
The correction factor is calculated from:
light transmission reduction nJ(speed)3
This is an approximation founded on (speed is written
IIVII) :
1. Ref /6/ which says: The extension of spray cloudi2
2- RGf /7/ WhiCh says: Collected water weight n1V2 8
3-
REf /8/ which says:
Collected water weight m:v4 2
4. Results from this project (chapter 7.4.1):
Light transmission reductionru V3
@222£_§§222
The water depth should nominally be 1,5 and 2 mm.
Deviations from this have been corrected according to: Light transmission reduction nJ(water depth)l/2
This is founded on:
1. Ref /6/ which says: The extension of spray cloud
r\/(water depth)l/2
2. Own data according to chapter 7.4.2:
Light transmission reductionrv(water depth)eXp where 04 exp<l,25
Wigs
From wind speed and-direction data during the measure-ments the average wind component in side direction
(transversal) has been calculated. The influence of this is discussed in chapter 7.4.4. The average side-wind component was between 0 and 2,6 m/s (usually
around 1 m/s). The limit for maximum wind speed during separate runs was 4,0 m/s. It is anticipated that
stronger winds will "blow away" the spray from the test track, but any influence of this during these measurements can not be traced with certainty (this
is not valid for only one side measurement).
§m§i§22_illgm;2§29§
The correlation between illuminance values and spray values is tested in chapter 7.4.3. A correction is not motivated. On the other hand, the illuminance is
undoubtedly influencing the results of the filming.
Subjective estimations from films
A subjective evaluation founded on the films was made
with the twofold purpose of classifying the spray
protectors subjectively as well as investigating the
28
correlation between subjective estimations and objective measurements. The latter is necessary in order to find
out if the used spray,measures have any relations to reality, i.e. how vehicle users are estimating the spray. Despite the importance of this question no data is so far published about this.
It should be pointed out that this subjective eXperiment is suffering from some imperfections because the quality of the used pictures could have been better, variations in ambient illuminance could have influenced the result, the number of subjects was low and their estimations were made in laboratory and not in a vehicle. However, many of the preferred requirements in an ideal experi ment is practically almost impossible to realize, and
it was considered meaningful to,despite the imperfections, make this first experiment hoping to get a rough View of how things are. The imperfections of the method will
decrease the correlation, so there is only risk for
an underestimated correlation.
Slides were prepared from the films of the vehicle runs. This means that the spray was viewed from a position 65 m behind the test vehicle. One slide from each measurement series was chosen (the variation between vehicle runs was insignificant). A group of
subjects (5 young men with absolutely no knowledge
about the spray project) were asked to judge pair of slides without the possibility to discover what type of spray protectors that was shown. Each pair of slides consisted of one picture of the standard spray protector
(reference) and another picture of some other tested spray protector (test object). The task was to estimate the overall impression of the spray nuisance for the test object in % relative to the corresponding for the reference. 35 pair of slides were shown during 15 s and every pair was recurring three times (in random order). Different types of normalization was tested on the results. The type eventually used is normalizatiOn VTI REPORT NO. 171A
with respect to the average estimations and the standard deviations for both the subjects and the group:
S
_ tot
yij
(Xij
Xi)
si
+ Xtot
yi. = the normalized estimation for subject i in
j estimation of spray protector j.
= the original estimations
ij
ii = the average of estimations by subject i
si = standard deviation of estimations by subject 1
gtot = average (RMS-computed) of i. for all subjectsl
( 2: group mean)
stot = average (RMS-computed) of s. for all subjects
( sstandard deviation for group)
From these normalized results, overall estimated values were computed mainly according to the same
principles as for the objective measurements. In order to decrease the dominating influence of the extreme values, both the objective and the subjective values were transferred to a logarithmic scale (lolog x). After that,the correlation between subjective and objective values was tested.
3O
EXPERIMENTAL RESULTS
Measurements
Spatial distribution of spray
Figures 20 31 are curves representing the spray distri-bution according to chapter 6.1. Of these, figures
20 28 are direct comparisons between the reference case (standard spray protectors) and the tested objects for different speeds and water depths.
Fig 29 gives an example of the influence of water depth at 90 km/h. Please observe that at water depth 2 mm it can not be excluded that sprinkler-generated spray may have had a slight influence (see chapter 5.2). The curve for 2 mm may in that case be somewhat over-estimated.
Fig 30 31 are giving example of speed influence at the two water depths.
Single and overall measures of spray
In tables 1 and 2 measured spray values for the respec-tive spray protector are presented. Table 1 gives
"absolute" figures, i.e. the reduction of light trans-mission, and table 2 gives the corresponding relative
figures (in %) with reference to "standard protectors". Lower values mean a decreased visibility reduction and
thus a better efficiency.
The indicated figures are ensemble averages for the corresponding measurement series, i.e. averages for all runs (approximately 8 20 vehicles passages) made for VTI REPORT NO. 171A
each tested case.
Figures 32 and 33 present the overall values in table 2 for transversal and side measurements respectively. However, the reduction of visibility has been trans ferred to improvements in visibility in relation to the reference protectors.
uogssimsueln JqBiI 30 unijonpaa Buiudmgpsuoissimsu91nsnfq O \7 N C 0, 8 [8 % Ma tn in g tva rs ko rrik tn in g Me as . tr an sve rs al to dr ivi ng di re ct io n 1 7 T I I I 1 30 40 50 60 70 80 9O Avs ta nd ef te r fo rd on E 1 Di st an ce af te r ve hicl e m Ma tn in g la ng s fo rd on et s si do r Me as . al on g si de s of th e ve hi cl e Ha st ig he t Sp ee d : 90 km /h Va tt en dj up Wa te r de pt h : 2 m m v I v ' T r 44 7 30 40 50 6O 70 80 90 Avs ta nd ef te r fo rd on D d Di st an ce af te r ve hi cl e
up LU noissimsuein jq il go uoinanpaauiudmgpsuoissimsuelnsnfq
F i g 2 0 S t a n k ut br e d n i n g s k ur vo r S p a t i a l d i s t r i b ut i o n c ur ve s f o r s p r a y S t a n d a r d s t a n k s k yd d S t a n d a r d s p r a y p r o t e c t o r s O s k a r m a d e h j ul U n c o ve r e d wh e e l s [6 % 10 . . . « Ma tn in g tva rs ko rr iktn in g Me as . tr an sve rs al to dr ivi ng di re ct io n \1 ' T ' Y ' I V I I 1 0 10 20 30 40 50 60 70 80 90 Avs ta nd ef te r fo rd on D i Di st an ce af te r ve hi cl e Ma tn in g la ng s ford on et s si do r Me as . al on g si de s of th e ve hi cl e a I ' V ' I V r V V 1 0 10 20 30 40 50 60 70 80 90 Avs tén d ef te r fo rd on h e Di st an ce af te r ve hi cle Ha st ig he t Sp ee d : 90 km /h Va tt en dj up Wa ter de th : 1, 5 m m UOTSS? SUI
msueln nqSiI go uoinanpau
_udmepSUOTSSIMSUEJJSHE. 1 13 -4 Ma tn in g tva rs kb rr ik tn in g Meas . tr an sve rs al to dr ivi ng di re ctio n *f I 7 U U 40 50 60 7O 0 Avs ta nd ef ter fo rd on Em ] V 80 q 9 Di st an ce af te r vehi cl e M a t n i n g la ng s fo rd on et s si do r Me as . al on g si de s of th e ve hicl e Hast ig he t 'S pe ed : 70 km /h Va tt en dj up Wa te r de pt h: 2 m m I V V 1 40 50 60 7O Avs tén d ef te r fo rd on V 80 90 Di st ance af te r ve hi cl e hm ] 32
uoissrmsueiq nq il go uoiaonpag SuiudmgpsuorssimSUEJnsnfq 0, 4 Ma tn in g tva rs ko rr ik tn in g Me as . tran sve rs al to dr ivi ng di re ct io n q I I I I I I 1 3O 40 50 60 70 80 90 Avs tén d efte r fo rd on Di st an ce af te r ve hi cl e Ma tn in g la ng s fo rd on et s si do r Me as . al on g si de sof th e ve hi cl e Ha st ig he t S eed : 90 km /h Vatt en dj up Wa ter de pt h : 2 mm I V I V V V * V 30 40 SO 60 70 80 90 Avs tén d ef te r fo rd on D Di st an ce af te r ve hi cle F i g 21 S t a n k ut b r e d n i n g s k ur vo r S p a t i a l d i s t r ib ut i o n c ur ve s f o r s p r a y 1 1 N
Ll; UOISSjmsuein 3q811 go UOjnonpaaSurudmepsuoissrmsu9133n[1
S t a n d a r d s t a nk s k yd d S t a n d a r d s p r ay p r o t e c t o r s M o d e l l G W 1 M o d e l c w l Ma tn in g tva rs ko rr ik tn ing Me as . tran sve rs al to dr ivi ng di re ct io n 1, 6. [ Z / a n 4 y 1 T I I I v I '1 10 20 30 40 50 60 70 30 90 Avs ti nd ef te r ford on D d Di st an ce af te r vehi cl e Ma tnin g IH ng s fo rd on et s si do r Me as . al on g si de s of th e vehi cl e V V I V V V T V ' 10 20 30 40 50 60 70 80 9 0 Avs tén d ef te r fo rd on Em ] Di st an ce af te r ve hi cl e gurudme uorssImsueJJ 3q831 30 uornonpax psuorSSImsuelnsnfq 1 Ma tn in g tva rs ko rrik tn in g Me as . tr an sve rs al to dr ivi ng di re Y I I V V V V r I 0 10 20 30 40 50 60 70 80 Avs ti nd ef te r fo rd on Di st ance af te r ve hi Ma tn in g la ng s fo rd on et s si do r Me as . al on g side s of th e ve hi cl e I V V V V I V V V I 0 10 20 3O 40 50 60 70 80 S p eed : 70 km /h Avs tand ef te r fo rd on . Di st an ce af te r ve hi cl Ha st ig he t Va tt en dJ up Wa ter de pt h: 2 m m
Ma tn in g tva rs ko rr ik tn in g Me as . tr an sve rs al to dr ivi ng di re ct io n uorssrmsueln 3q311 go uoyjonpag uiudmgpsuorssrmsuejanfq T V 1 f I I 1 30 40 50 60 7O 80 90 Avs ta nd ef te r fo rd on [ 1 Di st an ce af te r ve hi cl e m Ma tn in g la ng s fo rd on et s si do r Me as . al on g si des of th e ve hi cl e Sp ee d : 90 km /h r ' V 30 4O 50 60 70 80 90 Avs ta nd ef te r fo rd on D Di st an ce af te r ve hi cl e F i g 2 2 S t a n k ut b r e d n i n g s k ur vo r S p a t i a l d i s t r i b ut i o n c ur ve s f o r s p r a y St an da rd st an ks kyd d S t a n d a r d s p r a y p r o t e c t o r s M o d e l l G w 2 M o d e l G W 2 1 Ma tn in g tva rs ko rr ik tn in g Me as. tr an sve rs al to dr ivi ng di re ct io n uorssrmsueln 3q811 go uoinonpau Surudmgpsuorssrwsuexnsn[1 ' 1 ' 1 r v I T T 1 0 10 20 30 40 50 60 70 80 90 Avs ta nd ef te r fo rd on Bi Di st an ce af te r ve hi cl e 1 6. . .. . Mét ni ng la ng s fo rd onet s Si do r [Z /Z UJ Me as . al on g Sl de S of th e ve hicl e 1
K
I l r T T T T V ' 0 10 20 30 40 50 60 70 80 90 I Avs tén def te r fo rd on D Ha st ig he t Di st ance af te r ve hi cl e Sp ee d : 90 km /h Va tt en dJ up . Wa te r de th: 1 5 m m uorss; Butudme pmsuean JQByI go uornonpaa suorssrmsu2138nf 1 10 Ma tn in g tva rs ko rr ik tn in g Me as . tr an sve rs al to dr ivi ng di re ct io n ' ' y I f f I T I l O 10 20 3O 40 50 60 7O 80 90 Avs ti nd ef te r fo rd on D Di st an ce af te r ve hi cl e M a t n i n g la ng sfo rd on et s si do r Me as . al on g si de s of th e ve hi cl e T 0, 8 b p D b h b V r Y a 0 10 20 3O 40 50 60 70 80 90 Avs tén d ef te r fo rd on [n ] Dist an ce af te r ve hi cl e Ha st ig he t 'S peed : 70 km /h Va tt en dj up Ha te r de pt h: 2 m m 31+
uogssimSUEJj Jq il JO noijonpau SuiudwgpsuorssrmsueJ3snf1 0, 8 Ma tn ing tva rs kb rr ik tn ing Me as . tr an sve rs al to dr ivi ng di re ct ion q V V I l I I I 30 40 50 60 70 80 90 Avs tén d ef te r fo rd on [ ] Di st an ce af te r ve hi cl e m Ma tnin g li ng s fo rd on ets si do r Me as . alon g si de s of th e vehi cl e Ha st ig he t S ee d : Va tt endj up Wa te r de pt h : ' V ' V V V a 30 40 50 60 7O 80 90 Avs tén d ef te rfo rd on [m ] Di st an ce af ter ve hi cl e F i g 2 3 S t én k ut b r e d n i n g s k ur vo r S p a t i a l d i s t r i b ut i o n c ur ve s f o r s p r a y lZJ < uorssymsuezn nq yj go uoiaanpau uiudmgpsu01ssrmsueijsnfj G W 3 S t a n d a r d s t a n k sk yd d st an da rd sp ra y pr otec to rs M o d e l l G W 3 M o d e l Ma tn in g tva rs korr ik tn in g Me as . tr an sve rsal to dr ivi ng di rect io n 1, 6q [Z /a n 4 r v I I 1 40 50 60 70 80 90 Avs tén d ef te r fo rd on D Di st an ce af te r ve hi cl e Ma tn in gla ng s fo rd on et s sido r Me as . al on g si de s of th e ve hi cl e Y ' r T I 40 50 60 70 80 90 Avs tén d ef te r fo rdon g Di st an ce af te r vehi cl e uoissimSUEJJ aq iI ;o uoinonpau Buiudmgpsuoissrmsueinsnfq q Ma tn in g tvér sko rr ik tn in g Me as . tr an sve rs al to dr ivi ng di re ct V T V U I U T 60 70 80 Avs tand ef te r fo rd on Di st ance af te r ve hi cl c m c \ T c M c N c-4 r c Ma tn in g la ng s fo rd on et s si dor Me as. al on g si de s of th e ve hicl e 7 p p p p h p I V Y 0 10 20 30 40 50 60 70 80 'S pe ed : 70 km /h Avs tén d ef te r fo rd on . Di st an ce af te r ve hi cl Ha st ighe t Va tt en dj up Ha te r de pt h: 2 mm
Surudwgpsuoissrmsuelqsnf1
[Z
/Z
m]
uoissimSUEJJ JqBiI go noiaonpag
Ma tn in g tva rs ko rr ik tn in g Me as . tr an sve rs al to dr ivi ng di re ct io n T 1 v f l I i f l O 10 20 3O 40 SO 60 70 80 90 Avs tén d ef ter fo rd on E Di st an ce af te r vehi cl e i Ma tn in g la ng s fo rd on et s si do r Me as . al on g si de s of th e ve hi cl e V Y I I O 10 20 30 40 50 60 7O 80 9O Avs ta nd ef te r fo rd on g ' et . . Ha St lg h Di st an ce af te r ve hi cl e Sp ee d : 90 km /h Va tt en dj up Wa te r de pt h : 2 mm
UOlSSTMSUEJJ JQETI go UOTJDRPBX
Burudmepsuoyssimsu9138nfq [7;/2 m] 1, 6 F i g 24 S t a n k ut b r e d n i n gs k ur vo r Sp at ia l di st ri but io n cur ve s fo r sp ra y St an da rd stan ks kyd d S t a n d a r d s p r a y p r ot e c t o r s M o d e l l G w 4 M o d e l G W 4 « Ma tnin g tva rs ko rr ik tn in g Meas . tr an sve rs al to dr ivi ng di re ct io n 1 1 1 1 v I 1 j V I 0 IO 20 30 40 50 60 70 80 90 Avs ta nd efte r fo rd on D i Di st an ce af te rve hi cl e 1 Matn in g la ng s fo rd on et s si do r Me as . al on g si de s of th e ve hicl e ' I V U I Y ' T I . 0 10 20 30 40 50 60 7O 80 90 Avs ti nd ef te r ford on g Di st an ce af te rve hi cl e Ha st ighe t Sp eed : 90 km /h Va tt endj up Wate r de th : 1, 5 m m noissymsuenn 3q311 go uoinonpau uiudmgpsuoissimsueJasnfq Ma tn in g tva rs ko rr ik tnin g Me as . tr an sve rsal to dr ivi ng di re ct io n O 10 20 3O 40 50 6O 70 80 90 Avs ta nd ef te r fo rd on [ 1 Di st an ce af te r ve hi cl e m W Ma tn in g la ngs fo rd on et s si do r + Me as . alon g si de s of th e ve hi cl e ' V V I I V V O 10 20 30 40 50 60 70 80 90 I I 'S pe ed : 70 km /h Avs ta nd ef te r fo rd on En ] . Di st an ce af te r ve hi cl e Ha st ig he t Va tt en dj up Wa te r de pt h: 2 mm 36
uoyssymSUEJJ nq yl JO uognanpay Suiudmgpsuoissrmsuexjsnfq [Z/Zm] 1, 6 1, 2 Ma tn in g tva rs ko rrik tn in g Me as . tr an sve rs al to dr ivi ng di re ct io n v 1 I I I l I 1 0 10 20 30 40 50 60 70 80 90 Avs ta nd ef te r fo rd on B Di st an ce afte r ve hi cl e Ma tn in g la ng s fo rd on et s si do r Me as . al ong si de s of th e ve hi cl e ' V Y I V V V V V vV O 10 20 30 40 50 60 70 80 90 Avs ta nd ef te r fo rd on E d Di st an ce af te r ve hi cl e Ha st ig he t S ee d : 90 km /h Va tt en dj up Wa te r de pt h : 2 mm F i g 2 5 S t a n k ut b r e d n i n g s k ur vo r uoissymsuejn )q811 30 uoinonpag SuiudwepSUOIssimsueJanfq S p a t ia l d i s t r i b ut i o n c ur ve s f o r s p r a y S t a n d a r d s t a n k s k yd d S t a n d a r d s p r a y p r o t e c t o r s M od e l l I wa n i c k i M o d e l I wa n i c k i Ma tn in g tva rs ko rr ik tn in g Me as . tr an sve rsal to dr ivi ng di rect io n 1 ' ' T V I ' I 1 I 10 20 30 40 SO 60 70 80 90 Avs tén d ef ter fo rd on D i Di st an ce af ter ve hi cl e Ma tn in g la ng sfo rd on et s si do r Me as . al on g si des of th e ve hi cl e V V V I V V ' 1, 10 20 30 40 50 60 70 80 90 Avs ta nd ef te r fo rdon D d Di st an ce af te r vehi cl e
UOISSTmSUEJ] :qSIT go uoinonpax Suiudmgpsuoissiwsueansnfq Mét ning tva rs ko rr ik tn in g Meas . tr an sve rs al to dr ivi ng di re f I T 60 70 80 Avs ti nd ef te r fo rd on U Di st an ce af te r ve hi cl Ma tn in g la ng s fo rd onet s si do r Me as . al on g si de sof th e ve hi cl e Ha st ig he t 'S pe ed : 70 km /h Va tten dj up Wa te r de pt h: 2 mm V V I 60 70 80 Avs tén d ef te r fo rd on Di st an ce af te r ve hi cl
uoissrmsu913 3q811 go uoyuanpag Buiudmgpsuoyssymsuejnsnfq F i g 26 S t én k ut b r e d n i n g s k ur vo r Sp at ia l di st ri but io n cur ve s fo r sp ra y S t a n d a r d s t én k s k yd d -S t a n d a r d s p r a y p r o t e c t o r s M o d e l l V T I M o d e l V T I Mt ni ng tva rs ko rr ik tn in g 10 q 10 Mét ni ng tvr s ko rr ik tn in g M t 1 t d , , d, _ Mi tn in g tvér s kd rr ik tn in g M l d . . d. 83 5' ra ns ve rs a ° rI VI ng Ir eC tl on Me as . tr an sve rs al to dr ivi ng di re ct io n 'e as ' Lr an sve rs a to rI VLng lr ec tl on $113u dtu? uoissymsuein 3q811 go uoinonpag psuoiss1msuelnsng morSSjmsueJJ JHSiT go noiaonpaa
Surudmgpsuoissimsunjnsnfj 1 ' i f ' , r r , 7 1 1 v 1 T r ' v I v I 1 y T r r v 1 f f q 0 10 20 30 40 50 60 7O 80 90 0 10 20 30 40 50 60 70 80 90 0 10 20 30 40 50 :0 t, d7 of t :0 d 90 Avs tén d ef te r fo rd on D Avs tn d ef te r fo rd on [ ] 0: :t zg ce ea fi zr Zzh izl e E] Di st an ce af te r VE hi CI e Di st an ce af te r ve hi cl e m Mét ning lén gs fo rd on et s si do r Mét ni ng lén gs fo rd on et s si do r [z/ zn q Me as -al on g Si de s 0f th e VC hi CI Q [ Me as .al on g si de s of th e ve hi cl e Z/ Zm ] Ma nn in g li ng s fo rd on et s sido r Me as . al on g si de s of th e ve hi cl e r ' v 7 T I r v I 1 * vi 1 Y 1 o 10 20 3o 40 50 60 70 80 9o 0 10 20 30 40 50 60 70 80 90 Avs tén d ef te r fo rd on [m ] Di st an ce af te r ve hi cl e r V V T T V V T T * 1 60 70 80 90 Avs tén d ef te r fo rd on Em ] Avs ti nd ef te r fo rd on En ] Di st an ce af te r ve hi cl e Di st an ce af te r ve hi cl e 0 in O \7 O m 0 N 0 - £ 0 Ha st ighe t SE ee d : 90 km /h Va tt endj up Wa te r de pth : 2 m m Ha st ig he t S p e e d : 70 km /h Va tt en dj up Wa te r de pt h: 2 mm 38
Fi g 27 St an kut br ed ni ng sk ur vo r S pa t i a l d i s t r i b ut i o n c ur ve s f o r s p r a y S t a n d a r d s t a n k s k yd d S t a n d a r d s p r a y p r o t e c t o rs M o d e l l M o ns a n t o M o d e l M o n s an t o . u u . . 10 u _ H . _ _ 10 Mét ni n tvr s korr ik tn in 10 Ma tn18 tva rs k0 rr 1ktn 1? 8_ _ i * Ma tn ln g tva rs kdrr lk tn in g 1 e as ir an sve rs al to dr ii iny di re ct 9 35 -tr an sve rs al to de rl ng dl re Ct lo n V~ Meas . tr an sve rs al to dr ivi ng di re ct io n . I E
[z]
uoissimsueaj Ju jl nogssymsueln nu y] 30 uoinnnpaa uoissymsuelj 3q811 go unjnonpag Buiudmgpsuo;ssimsunjnsnfq uiudmgPSUOjssimsuejjsnfq Suiudmgpsuoissimsuejasnfq go uoijnnpaa I 1 I I V I I I 1 I I I I I I I I I ' j r 30 40 50 60 70 80 90 0 10 2O 30 50 SO 60 70 80 0 10 20 30 40 50 60 70 80 9O . Avs tén d ef te r fo rd on [ J Avs tén d efte r fo rd on SY SE an d ef éi r forg ?n 1 Di st an ce af te r ve hicl e m Di st an ce af te r ve hi cl is an ce a er ve ic e 1 Mt ni ng li ng s ford on et s si do r Ma tn in g la ng s fo rd on et s si do r [ z/ a n Me as . al on g Si des of th e ve hi cl e Me as . al on g si de s of th eve hi cl e Ma tn in g li ng s fo rd on et s si do r [Z /Z m] Me as. al on g si de s of th e ve hicl e I I I I I I I I I V V I I I I I 1 I I ' 0 10 20 30 40 50 6o 70 30 90 0 10 20 30 #0 50 60 a 70 80 90 Ha st ig he t AV St én d af te r fo rd o g AV SC an d ef te r fo rd on D -Di st an ce af te r ve hi cl s ee d , 90 km /h Di st ance af te r ve hi cl e 6 V V I I I V Y 7 0 10 20 3O 40 50 60 7O 80 Avs tn d ef te r fo rd on . Di st ance af te r ve hi cl Ha st ig het S pe ed : 70 km /h Va tt endj up Wa te r dept h: 2 mm Va tten dj up Wa te r de pt hF i g 28 S t a n k ut b r e d n i n g s k ur vo r S p a t i a l d i s t r i b ut i o n c ur ve s f o r s p r a y S t a n d a r d s t a n k s k yd d UOISS}MSUBJJ 3q811 JO uornnnpeu Burudwgpsuoyssrmsuelnsn[1 S t a n d a r d s p r a y p r o t e c t o r s M o d e l l M o n s a n t o M o d e l M o n s a n t o Mt ni ng tvr s ko rr ik tn in g Me as . tr an sve rs al to dr ivi ng di re ct ion ' I O 10 20 30 4O 50 60 70 8O 9O Avs ti nd ef te r fo rd on [m ] Di st ance af te r ve hi cl e Ma tn in g lén gs fo rd on et s si do r Me as . al on g si de s of the ve hi cl e v T v I 1 V V 0 10 20 30 40 SO 60 7O 80 90 Ha st ig he t S-ee d Va tt en dj up Wa te r de pt h ' Avs tén d ef te r fo rd on Em ] Di st an ce af te r ve hi cl e
v \ N g_: uoissimsuelj 3q811 JO uninonpax uiudmepsuoissimsueljsnfq r 1 LZ /Z mJ F ig 29 0, 8 S t a n k ut b r e d n i n g s k ur vo r s o m vi s a r e xe m p e l p a i n ve r k a n a v o l ik a va t t e n d j up vi d h a s t i g h et e n 90 k m / h S t a n k s k yd d : S ta n d a r d s k a r m a r . S p a t i a l d i s t r i b ut i o n of s p r a y us i n g wa t e r d e p t has a p a r a m e t e r . S p e e d is 90 k m / h . S t a n d a r d s p r a y p r o t e c t o r . va t t e n d j up / wa t e r de p t h : __ _ _ _ _ -2 m m 1 , 5 m m Ma tn in g tva rs kb rr iktn in g Me as . tr an sve rs al to drivi ng di re ct io n ' I I I 1 I 1 t I 10 20 3O 40 SO 60 7O 80 9O Avs ta nd ef te r fo rd on E Di st ance af te r ve hi cl e Ma tn in g la ng s fo rd on ets si do r Me as . al on g si de s of th eve hi cl e Y ' I V 10 20 30 40 50 60 70 80 90 Sp eed Ha st ig he t Avs ta nd ef te r fo rd on D : 90 km /h Di st an ce af te r ve hi cle Va tt en dj up Wate r de pt h : 2+ 15 mm _ _ _ _ _ _ J F i g 30 S O H :n 73 ..< 5 C r: L4_J u 2 m _4 30 niudmgpsuoissimsuersnfjUOT73HPGH S t a n kut b r e d n i n g s k ur vo r s o m vi s a r e xe m p e l p a h a s t i g -h e t e n s i n ve r k a n . V a t t e n d j up : 1, 5 m m . S t a n k s k yd d : S t a n d a r d s k a r m a r . S p a t i a l d i s t r i b ut i o n o f s p r a y us i n g s p e e d a s a p a r a m e t e r . W a t e r d e p t h i s 1 , 5 m m . S t a n d a r d s p r a y p r o t e c t o r . h a s t i g h e t / s p e e d : 90 k m / h 7 0 k m / h Ma tnin g tva rs kd rr ik tn in g He as . tran sve rs al to dr ivi ng di re ct io n V 0 / y ' T V l V 7 I 1 10 20 30 40 50 6O 70 80 90 Avs tén d ef te r fo rd on D d Di st an ce af te r ve hi cl e Ma tn in g la ng s ford on et s si do r Me as . al on g si de s of th eve hi cl e V T I 1 I r Y I ' 10 20 3O 40 50 60 7O 80 9 Ha st ig he t Spee d 70 +9 O km /h 0 Avs ta nd ef te r fo rd on [m ] Di st ance af te r ve hi cl e Va tt endj up Wate r de th : 1, 5 mm uiudwepsuoissiMSUEJan[1 uoissiwsueij 3q311 JO unijonpag S t a n k ut b r e d n i n g s k ur vo r s o m vi s a r e xe m p e l p a h a s t i g h e t e n s in ve r k a n . V a t t e n d j up : 2 m m . S t a n k s k yd d : s t a n d a r d s ka r m a r . S p a t i a l d i s t r i b ut i o n of s p r a y us i n g s p e e d a s a p a r a m e t e r . W a t e r d e p t h is 2 m m . S t a n d a r d s p r a y p r o t e c t o r h a s t i g h e t / s p e e d : 90 k m / h 70 km/h Ma tn in g tva rs kbrr ik tn in g Me as . tr an sve rsal to dr ivi ng di re ct 0, 8 V I V T I I V l 10 2O 30 40 SO 60 70 80 Avs tén d ef te r fo rd on Di st ance af te r ve hi cl Ma tn in g la ng s fo rd on ets si do r Me as. al on g si de s of the ve hi cl e
Sp ee d Ha st ig he t Va tt endj up Wa te r de pth ' V V V V V 7 t 10 20 30 40 50 60 70 80 Avs tn d ef te r fo rd on Dist an ce af te r ve hi cl
4? Table l
Me?sure?entdirection Transversal At sides of vehicle
Speed (km/h) 90 70 90 70
Water depth
2
1.5
2
1.5
2
1.5
2
1.5
(mm) Uncovered 2,93 2,31 1,60 0,57 0,38 0,19 wheels Standard Swedish spray 2,39 1,74 1,06 0,83 0,50 (3,32 (3,24 (3,19 protector GW type 1 1,82 1,16 0,79 0,32 (3,27 (3,15 5 4 8:3
0w type 2
2,12 1,47 0,90
0,52 0,40 0,23
*8
M £1. }>~. S cw type 3 1,87 1,16 0,80 0,38 0,31 0,248*
LH O 8, GW type 4 2,09 1,23 0,87 0,43 (3,29 (3,21is
m
(Iwanicki)187136078
040033017
Monsanto 2,07 1,44 0,87 0,66 0,41. 0,30 0,19 (3,14 VTI 2,13 1,32 0,85 0,49 (3,29 (3,16Measurements of spray, here represented by the reduction of light
transmission. The reduction
along and behind vehicle. Type of measurement:
Transversal
Longitudinal
VTI REPORT NC. (at sides)
values are the averages over 100 m Value in table expressed as:
% light transmission reduction in
trans-versal direction (8m light path). Average % light tudinal path is Average 171A
over 3-103m behind vehicle.
transmission reduction in longi-direction per 2 m (i e light 2m). Average of both sides. over -7-93m behind vehicle.
Table 2
Measurementdirection Tra sversaln At SideS 0f V8 1Ch' l8 H .35 :1 B
mm: oo m am Speed (km/h) 90 70 90 (55,3 (5.: JE 00> DOT) COM
£38 8 2 6
3 a
water depth
2
1.5
2
1.5
2
1.5
2
1.5 0W
8'0
0
(mm)
$318 $8 28
Uncovemd
122,5 133
151
115 119,8 80,5
133,5 105
120
wheels Standard Swedish spray 100 100 100 100 100 100 100 100 100 100 100 protector0w typel
76
66,5 74,5
64
85
63,5
72,5
71
72
H8
3
0w typeZ
88,5 84,5
85
104123,5 97,5
86
108,5
97
3
H 0.. .'>~.3
GW type3
78
66,5 75,5
77
97
100
73,5 91,5
82
5';
LH O3
GW type4
87,5 70,5
82
86,5 90
88,5
80
88,5
84
it
IW. .
78
78
73,5
80,5102,5 71,5
76,5
85
81
(Iwanicki) Monsanto 86,5 83 82 79,5 81,5 94 79,5 71 82,5 81,5 82VTI
89
76
80
97,5 89,5
67
81,5 84,5
83
Measurements of spray (reduction of light transmission, in %) with reference to standard Swedish spray protectors. Corrections for water depth and speed included.
Improvement rel. standard Sw. protectors
% A
30 20 10' 0Fig 32
spray44
-10 -. ~20-1 30 30 20 10 OSK
Fig 33 GWl
GWZ GW3 Measurement
r.
GW4 IW VTI "transversal"101 -20-Fig 32-33 OSK GWl GW2 GW3 Measurement GW4 IW "sides"
Results from spray measurements.
occuring combinations of speed and water depth
have been combined with equal weight to a single figure representing each spray protector for
VTI
Figures for the
both transversal and side measurements. VTI REPORT NO. 171A
Experimental accuracy
The precision associated with the respective values in table 1 is presented in table 3. The values shown in table 3 are confidence intervals for 95% confidence
(5% uncertainty). A full analysis of variance has not been done, but a t-test (for dual comparisons) was made on the spray protector comparisons that are interesting. This type of test is however not giving as many signi ficant differences as a full analysis using all data. Based on the t-tests it is possible to say the following
of the values in tables l and 2 and figures 32 and 33: about the significance (for 5% uncertainty)
Transversal measurement:
(OSK)
any other tested arrangement.
0 Uncovered wheels are significantly worse than
0 Every difference between REF (standard protectors)
and any other tested protector is significant.
0 Model GW 1 is significantly better than the others
except GW 3 and IW. Those three are difficult to classify, but the probability is:>50% that GW 1 is the best.
0 Model GW 3 is significantly better than the others
except GW 1 and IW.
0 Model IW is significantly better than GW 2, REF and OSK.
As an approximation can be said that differences;>lO% are significant.
46
Side measurement:
0 Model GW 1 is significantly better than the other
spray protectors except IW, M and VTI. The proba-bility that GW 1 is better than even those is
0\
however much greater than 50 °.
0 IW, M and VTI is significantly better than OSK and
GW 2.
As an approximation can be said that differences >20% are significant.
Systematic inaccuracy
Comparisons of the kind made in this project are rather accurate when the systematic inaccuracies are concerned. The inaccuracy that is not corrected in any way is
roughly estimated to«<5%. This figure then consists of
contributions from calibration and water depth measure-ment uncertainty.
Table 3
MeisureWent Transversal At sides of vehicle
direction Speed (km/h) 90 70 90 70
water depth
2
1.5
2
1.5
2
1.5
2
1.5
(mm) Uncovered 0,28 0,19 0,14 0,13 0,09 0,06 wheels Standard Swedish spray 0,15 0,10 0,09 0,07 CL07 0,04 0,03 0,04 protector GW type 1 0,14 0,17 0,10 0,07 0,07 0,03 s... o8
3 GW type 2 0,22 0,11 0,19 0,05 0,04 0,048
pii?
a GW type 3 0,26 0,15 0,16 0,09 0,08 0,04 LH o m E: GW type 4 0,16 0,14 0,18 0,06 0,09 0,05 94m
(Iwanicki)019008016
008004005
Monsanto 0,20 0,16 0,08 (JAMS 0,09 0,05 0,04 0,03 VTI 0,22 0,12 0,08 0,09 0,05 0,03Precision for measured spray as presented in table 1. 95% confidence intervals (5% risk level). The number of samples per average is 8-25 (normally 10-13).
48
Results from subjective evaluation
The results of the subjective estimations made by the subjects are summarized in table 4 and fig 34 37. The corresponding precision is also indicated. For the estimations in fig 34, i.e. all estimations combined, t tests were made showing that all differences are sig nificant (5 % uncertainty) except comparisons between:
GW 1 - GW 3 GW 3 - IW VTI - M
GW 2 - REF
A possible systematic inaccuracy is the changing ambient light which will expose the spray cloud more or less. For example the extreme values for GW 2 and GW 4 at 90 km/h, 2 mm, may be due to unusual sunlight. Those measurements were made earlier in the morning than any other measurement.
Some photo comparisons between the best and the worst spray protecting arrangements and the standard protec-tor are shown in fig 38 40.
The results can be summarized as follows:
0 Uncovered wheels are extraordinary bad concerning
spray. The spray was many times worse when the standard protectors were removed leaving the tires uncovered.
0 Spray protectors GW 1 and GW 3 are the best and
scored a 35-65% improvement relative to the standard protectors.
0 Models IW, M and VTI made an improvement bigger than
20% relative to standard protectors.
0 Model GW 2 was approximately equal to standard
protectors.
Table 4
Speed (km/h) 90 70 Total
N
ater depth
2 1.5 2 1.5E '
S l .conf.95%
(mm) mationinterv.
UncoverEd
296
255
206
253
5
wheels Standard
Swedish spray ref ref ref ref
protector GW type 1 66 64 36 55 6 Ho
3
3 GW type 2 123 96 96 105 78
a.?
Ed GW type 3 58 61 54 58 11 U) I44 0 m 2: GW type 4 129 67 71 89 5 E! IN (Iwanicki) 75 54 69 66 7 Monsanto 103 91 45 71 78 12 (90) VTI 101 78 51 77 9Results of subjective estimation from film/slides The figures are percen of overall spray nuisance.
tages relative to the standard protectors. The
column to the right gives the total estimation for the respective spray protector when all the tests are equally weighted.