Master thesis
Underpricing of US FinTech IPOs
THESIS WITHIN: Master Thesis within Business Administration in Finance NUMBER OF CREDITS: 15 credit
PROGRAMME OF STUDY: International Financial Analysis AUTHOR: Islam kobeisy
Tutor:Andreas Stephan JÖNKÖPING : December, 2018
Master Thesis within Business Administration in Finance
Title: Underpricing of US FinTech IPOs
Authors: Islam Mostafa Ahmed Kobeisy
Tutor: Andreas Stephan
Date: December, 2018
Key terms: Fintech, IPO, Underpricing, Ex-ante uncertainty.
Abstract
This master thesis examines the effect of ex-ante uncertainty about the intrinsic value of US FinTech IPOs stock on the underpricing level. Baron (1982) Asymmetric information model and Beaty and Ritter (1986) the ex-ante uncertainty model were tested using regression analysis by selecting different proxies of ex-ante uncertainty (Firm Age and Market capitalization, IPO proceed and Number of uses of proceed, Venture backing and Underwriter reputation). The Data set consists of 62 US FinTech IPOs during the period from January, 2005 to July, 2017. The underpricing level of US FinTech IPOs was 20.46%. The market capitalization, venture backing and the number of uses of proceed were found to be significant in determining the level of underpricing. The thesis also concludes that Baron (1982) and Beaty and Ritter (1986) models don’t hold for the FinTech IPOs during the period from January, 2005 to July, 2017.
Acknowledgment
The satisfaction that accompanies successful completion of this thesis would be uncompleted without mention people whose ceaseless cooperation made it possible. I have received generous help from Professor Andreas Stephan, and I would like to thank him for his great efforts and recommendations. Also, great thanks to Professor Urban Österlund for his guidance , my friends and family, specially my parents who gave me great support during my studies at Jönköping University.
Contents
1. Introduction ... 1
1-1 General... 1
1.2 The purpose of the thesis ... 2
1.4 Main results ...Error! Bookmark not defined. 1.5 Set up thesis ... 3
2.Literature Review ... 4
2.1 FinTech ... 4
2.2 Types of FinTech companies ... 5
2.2.1 Lending Technology ... 5
2.2.2 Wealth Tech management ... 5
2.2.3 Payment and billing technology ... 6
2.2.4 Money Transfer ... 6
2.2.5 Blockchain- cryptocurrency ... 6
3. Initial public Offer (IPO) ... 7
3.1 IPO process ... 8
3.2 Underpricing ... 10
3.3 Evidence of Underpricing ... 10
3.4 Causes of underpricing ... 11
4. Hypothesis ... 17
4.1 Underpricing of US FinTech companies ... 17
4.2 Age ... ... 18
4.3 Market capitalization ... 19
4.4 Proceeds ... 20
4.5 Number of uses of proceed ... 21
4.6 Venture backed IPO ... 21
4.7 Reputation of the Underwriter ... 22
5.Data...24
5.1 Descriptive statistics ... 25
6.Methodology ... 26
6.1 Underpricing ... 26
7.
.Results ... 29
7.1 Underpricing of USA FinTech companies ... 29
7.2 The relationship between underpricing and ex-ante uncertainty proxies ... 30
7.2.1 Testing firm characteristics ... 30
7.2.2Testing the firm characteristics and the IPO characteristics ... 33
8. Conclusion ... 36
9. Reference list ... 38
10. Appendix ... 44
Appendix 1 ... 44 Appendix 2 ... 48 Appendix 3 ... 50 Appendix 4 ... 521. Introduction
___________________________________________________________________________ 1-1 General
On 19 March 2008, the largest IPO in the history of FinTech industry occurred, Visa Inc IPO took place on the New York Stock Exchange, raising $17.9 billion, through selling 406 million common shares, the share that was expected to be sold at the range ($37- $42) was offered to the public at $44. The share price jumped during the first trading day and close at $56. Visa Inc Left almost $12 for each share on the table, and the market was surprised by the remarkable underpricing level of Visa Inc IPO. Next day the underwriters exercised their overallotment option and purchased 40.6 million shares, which increase the gross proceed to become $19.1 billion. It was considered one of the largest gross proceed in FinTech IPOs. Recently, Many FinTech companies around the world went public; net Copenhagen, chimpchange “USA”, Coasset’s, kicker “Australia”, mybucks “Germany” and free agent “London”.
All firms need to raise capital to finance new projects, expand operations or to start up their business. One of the best ways that newer and less established companies have found to raise quick capital is to make a stock offering. An initial public offering (IPO) is the first sale of stock by a company to the public, in general the overall reasons for firms to go public is to raise equity capital and to provide more liquidity for its current shareholders, by giving them the opportunity to sell their shares on a public market (Ritter and Welch, 2002). Although, the IPO processes become much tougher due to the extensive sits for regulations that required a lot of disclosure of the company financial information and also the efforts required to develop interest in the offered stocks. It’s obvious that FinTech companies will always seek the opportunities to become a public company because of; the credibility, liquidity and the advantages of their stocks becoming a currency.
FinTechs are companies that use innovative technology and provide financial services to consumers all over the world. They help business owners and consumers to manage their financial operations through software and algorithms that are used on smart phones or computers. There are many sectors within the industry such as;
Lending tech, Wealth tech management, Payment and billing tech, Remittance and money Transfer technology, Retail banking technology and Blockchain-
cryptocurrency tech (KPMG and CB Insights, 2016). The global investment in Fintech industry increased from $4.05 billion in 2013 to $12.2 billion by the end of 2014. USA has the largest share in FinTech industry but Europe has the Fast growing FinTech Industry in the world. FinTech investment in Europe increased from $264 million in 2013 to $623 million in 2014 (Accenture Report, 2015).
1.2 The purpose of the thesis
Many researchers have investigated the IPO performance in general, but there was
little research in the area of FinTech industry. Nowadays, FinTech industries are growing so fast and many firms start their IPO process, while other firms are anticipated to go Public soon. The thesis will investigate whether the US FinTech companies have experienced underpriced IPOs during the period from January, 2005 to July, 2017. And if so, what was the average level of underpricing compared to the underpricing level of US companies. According to Ritter (2017), the underpricing level of US companies during the period from 2001 to 2016 was 14.4%. If US FinTech IPOs was found to be more underpriced, it will give advice to investors to invest in US FinTech IPOs, and that was the reason behind selecting a recent period for the analysis purpose. Also, the thesis will carry the investigation further by testing Beaty and Ritter (1986) ex-ante uncertainty theory.
The thesis will examine the stock performance of 62 US FinTech companies with an initial public offer during the period from January, 2005 to July, 2017 in short term performance (underpricing), to answer the following question:
Does ex-ante uncertainty about the intrinsic value of the USA FinTech companies’ stocks lead to underpricing of the Public offer between January, 2005 and July, 2017?
Underpricing phenomenon in US IPOs market has been documented by many researchers and economists during the past half-decade, for instance Ibbotson (1975) confirmed 11.4% average underpricing on the US IPOS during the period from 1960 to 1969. Ritter (1984) examined 1075 US companies from 1977 to 1982 and found
16.3% average initial return. According to Loughran and Ritter (2002), the US IPOs left more than $27 billion on the table during the period (1990-1998), Alexander (1993) argued that underpricing level of US IPO between 1980 and 1987 was 16.09% and if an investor invested 1,000 dollars in each of these IPOs and sold the shares after one day of trading they would gain $698.840. Furthermore, Ritter and Welch (2002) found that USA IPOs between 1980 and 2001 were on average of 18.8% underpriced.
There are many explanations of the underpricing phenomenon in the US IPO market, The first explanation was provided by Baron and Holmström (1980) arguing that ex-ante uncertainty between the issuing firm and underwriter cause underpricing, in other words, there is a conflict of interest between the issuing firm and underwriter, where the latter wants to lower the associated costs and expenses from marketing the offer by lowering the public offering price. Another explanation was provided by Rock (1986), he argued that information asymmetry between informed and uninformed investors can cause underpricing, which is a reward for “the winner curse problem” to the less informed investors to encourage them to invest in the public offer. The thesis will present the theories behind underpricing and the causes of underpricing, which will be deeply discussed in the following literature.
1.4 Set up thesis
The structure of the thesis will be as follows, section 2 will give an overview about the main sectors of FinTech Industry, and Section 3 will present the IPO process, evidence on underpricing, causes of underpricing. And will elaborate on the relationship between underpricing and the ex-ante uncertainty. Also, Baron (1982) Asymmetric information model and Rock (1986) winner’s curse model among other models will be discussed. Section 4 will formulate the hypothesis and discuss the ex-ante-uncertainty proxies used in the analysis. After that, section 5 and 6 will present the data and the methodology. Section 7 discusses the regression analysis results and finally, the thesis end with conclusion, limitation and future research.
1. Literature Review
2.1 FinTech
FinTech companies are a business that uses technology to develop new financial services. It is an innovation of new technology that aims to defeat the old traditional financial methods. FinTech companies are effectively operating in many countries with customer from all over the world, these companies provide services such as; lending, equity finance, investment and banking services. It also provides Robo-advisory service which can introduce customers to a professionally managed portfolio with low fees. Nowadays, many people prefer doing their financial transaction using their Smart phones and laptop via platforms and web applications. For this reason sooner or later the traditional financial methods will disappear.
What is shocking! Despite the major development of financial services there is no academic consensus on common definition of FinTech and since the question “what is FinTech“ currently one of the most searched query over searching engines, so in the following part we will try to find a comprehensive meaning of the word FinTech.
According to Oxford Dictionary FinTech is “Computer programs and other technology used to support or enable banks and financial services”. Oxford definition of the FinTech is literally unjust and weak. Hence the needs for a broader definition drive us to explore more behind the heading meaning of the word. Arner, Barberis and Buckley (2015)defined FinTech as, firms that mix technology with business models to enhance the financial services. Past researcher tries to define FinTech Company as those that offer technologies for banking and corporate finance, capital market, payment and personal, data analysis firms and finance management. Silicon valley bank report adds to the definition, firms that use technology in personal finance and lending, payment and retail investment, equity finance, remittance, institutional investment, consumer banking, financial research and banking infrastructure, also E-commerce and Cybersecurity are included (Stockholm FinTech report, 2014). In the following section the main sectors of FinTech industry will be presented.
2.2 Types of FinTech companies
2.2.1 Lending Technology
FinTech lending companies operate as online peer-to-peer lenders (P2P). Simply, they lend money to Business and individuals through an online platform that match between the borrowers and lenders. They provide loans to individuals or institutions that were not able to get finance through traditional lending Banks. The P2P platform uses machine learning technologies and algorithms to estimate the client’s ability to repay the Debt. In most cases, loans are unsecured or backed with alternative collaterals. During the last decade the P2P companies experienced exponential growth, their volume had reached more than USD 100 billion by the end of 2015 (Huang and Robin, 2018). Many small and medium enterprises have been attracted to online P2P lending companies, this is because banking institutions are becoming more complex and time-consuming. One of the advantages of online lending is that they are able to reach the client wherever they are because they are not bound by a specific location, but there is also a concern about the potential failure of customers to repay their debts. Examples of FinTech lending companies are; LendingClub and OnDeck Capital.
2.2.2 Wealth Tech management
Tech companies that help individuals manage their personal bills, accounts or credit, as well as manage their personal assets and investments (KPMG and CB Insights, 2016). Wealth tech is a segment within FinTech that focuses on improving wealth management; these companies seek to transform the market by targeting inefficiencies in wealth management and create digital solutions to transform the investment management industry. This segment benefit includes; optimal portfolio management, improve the client experience and greater transparency. This subcategory of FinTech companies reached 74 financing agreements worth $657 million in 2016 and has been growing. CB insight identified 90 firms in 2016 that offer alternative traditional investment and developed technology to support investors. Robo-advisory alone (which is automated services that use machine learning algorithm to offer clients advice regarding their investment and receive 30% of all wealth Tech financing) will manage a trillion dollars by 2020 and 4.6 trillion dollars by 2022 (FT partners). There
are more than 200 Robo-advisory registered in the US Financial market, among them the popular companies Wealth front and Betterment and the latter worth $800 million.
2.2.3 Payment and billing technology
Payment and billing tech companies are companies that provide solutions varying from facilitating payments processing to payment card developers to subscription billing software tools (KPMG and CB Insights, 2016). The total value of the global retail payment transaction was estimated at 16 trillion US dollars and Digital payment contributed to 8% of the overall global retail payment market in 2015 and it is expected to increase to (18-24) % by 2020 (BCG, 2016).
2.2.4 Money Transfer
Money transfer companies include primarily Peer-to-peer platforms to transfer money between individual cross countries (KPMG and CB Insights, 2016). According to the world bank, the estimated total value of remittances in 2015 was $582 billion, $133.5 billion was sent from the USA that have 19% of the world’s migrants. The biggest recipients were; Mexico, $24.3 billion; China, $16.2 billion; and India, $10 billion (World Economic Forum 2016). FT partners “global money transfer” research identified two broad segments of the non-bank (global) money transfer industry, which are; (1)”International Payment Specialists”, who provide a solution to consumer with needs for cross-border and foreign exchange payments, (2) “the Consumer Remittance Providers” who provide service for clients to send remittance to their native countries. The consumer remittance provider attracts clients by lowering the prices and commission and offering mobile-based technology, popular examples of money transfer companies; Qiwi PLC and Xoom Corp. (Financial Technology Partners, 2017).
2.2.5 Blockchain- cryptocurrency
Blockchain and bitcoin companies are a well-known sector of FinTech. Companies in this sector are technology firms in the distributed ledger space, ranging from bitcoin wallets to security providers to sidechains (KPMG and CB Insights, 2016). Companies provide blockchain software or services for the trade in cryptocurrencies such as; Bitcoin, Ethereum and Ripple. These digital currencies are traded 24 hours a
day and all transactions are done via platforms on the internet. Bitcoin or the “digital gold”is a non-physical currency was created by“Satoshi Nakamoto” in 2009. Satoshi Nakamoto (2008) define the Bitcoin currency as peer to peer electronic cash system that allow for online payment from one party to another without interference of regular financial institutions. It is anonymous currency that has no kind of support from government or institutions (Grinberg, 2011). The total value of Bitcoin currency reached $112 billion US during 2018 (Blockgeek, 2018). The technology behind Bitcoin is Blockchain which is “distributed data store” or “Public ledger” that hold large record of all transactions. Blockchain technology registers all transactions that occurred automatically, without human intervention. Thus, making the blockchain technology efficient, compared to the traditional way of processing transactions. It makes the process quicker and lowers the costs because everything is done by computer algorithms.
2. Initial public Offer (IPO)
An initial public offer “ IPO” or “ public offering” is the process, in which unlisted firm is going public and selling new issued securities to public for the first time. Firms are motivated to go public to raise funds to finance its expansion plans or to pay its debt. There are potential benefits of going public. IPO provides liquidity to the existing shareholder and establishes a value to the firm and present a prestigious image.
At some point in time, a firm need to acquire a huge amount of money to introduce a new product or to expand in the market, such kind of capital is hard to get. Financial institutions and banks will not be able to lend such funds because they consider such investment is too risky and even for venture capitalists, who are interested in financing such firm activity. They may find themselves not able to continue investing until the firm show positive cash flow. Thus, the optimal solution for the company is to raise capital by going public. Also, Listing provides liquidity to the existing shareholder and entrepreneurs who are interested in diversifying their investment portfolio, in order to obtain a higher rate of return. This can be achieved by selling some of their shares to other investors. However, such sale must not be made during the initial public offer because public investors and investment bank will be a skeptic
and worry about such behaviour when entrepreneurs or private equity investors are leaving the company.
There are also disadvantages of the initial public offer; (1) There are significant legal, accounting and marketing cost associated with an initial public offer, (2) The company is periodically obligated to disclose its financial and business information, the consequences of information disclosure weaken the company position to competitors. (3) It also requires managerial attentions, time and effort to provide business reports and review financial statements. (4) In some case the firm fails to go public and subsequently the offer will be withdrawn which will have a negative effect on the company image and investors will not be interested to consider investment in such offer (lerner, 2007).
3.1 IPO process
The initial step in IPO is to select the underwriter which is called the “book-running” manager and other co-managers. There are specific criteria for the selection of the underwriter among them, the underwriter reputation which is based on his previous IPO’s performance, knowledge and experience in the firm industry, his outstanding research analyses of the market and to what extent he is committed to provide sufficient feedback about the value of the firm and estimated Earnings.
The underwriter is responsible for; (1) forming the syndicate that will help in selling of the stocks to public and (2) the letter of intent” which is a written agreement between the underwriter and the firm. The letter contains terms and condition that protect the underwriter against any other expenses “uncovered expenses” that could result from withdrawing the offer and also specifies the underwriter percentage of the gross proceeds which is 7% of the initial public offer proceed (Chen and Ritter, 2000), and it also contains a commitment by the issuing firm to allow 15% overallotment option to the underwriters (Ellis, Michaely and Maureen, 2000). This option is used to stabilize the market and support the stock price after the initial public offering. Furthermore, the intent letter doesn’t contain any information regarding the final price or the number of shares that will be distributed to public. After completing the agreement the underwriter start what is called “The due diligence process” in the
process the underwriter review the company financial statements and business reports and meet with the company management and talk to investors and suppliers. Meanwhile,the company start the registration process by filing a draft with the U.S. Securities and Exchange Commission (SEC ( “The securities act of 1933” prohibit selling any securities to public unless the company is registered. Once the registration form is submitted to (SEC) the registration form is transformed into “Red Herring” which is a statement of the firm prospect that is used to market the initial public offer. The underwriters start to market the IPO through “road show”.
First the “Red Herring” is sent around the country to all financial institutions, investors and sales people to inform them about the upcoming IPO event. Then both the underwriters and the firm start the “road show” by conducting regular visits to potential investors to present the firm business and its prospect of the public offer. Meanwhile, the underwriter starts to receive investor’s interest in the offer. However, the company cannot by any way sell any shares to investors prior to the official IPO date, the investors interest just represents a market indication that can help in determining the final share price and doesn’t hold any obligation for the company. Pricing process is one of the important steps in public offering after the SEC approval on the registration form. The firm's management board meets the underwriter on the day before the effective IPO date to determine the final share price and the number of shares offered taking into account “the order book” that contain records about investor interest in the public offer. After required price amendment is done, the firm executes the initial public offering on the effective date and the underwriter and the syndicate become legally obligated to sell the shares at the determined issue price to the Public.
The role of underwriter continues after the IPO. The underwriter is responsible for monitoring the stock performance and support the stock price in the market. This process is called “After market stabilization”. In a short period, only within 30 days after the IPO, the underwriter can support the stock in the market through executing “the overallotment option”, which is also called “green shoe”. According to the NASD regulations “Green shoe” option gives the right to the underwriter to buy from the company additional 15% of the firm shares at the initial offering price (Ellis et al, 2000). In most cases the underwriter sells 115% of the company share to the public if the stock price rises in the day after the public offering, the underwriter will declare that the offer size was 15% larger than the anticipated size. If the offer is weak and the
price drop below the initial price, the underwriter will not execute the “green shoe” option and buy back the additional shares. This action will support the stock in the market and stabilize the price (Lerner, 2007).
The final step in the process lasts for 25 days after the official date of IPO and it is called “The quiet period”. In such period the underwriters and the syndicate provide the company with information regarding the valuation of the IPO and estimated earnings.
3.2 Underpricing
The well-known phenomenon underpricing has been of the major interest of researchers during the last 30 years. This anomaly occurs when the offer price is below the real intrinsic value of the stock. Underpricing is the average of the stock initial return and it is calculated as the difference between the offer price and the first day closing price divided by the offer price, according to the following formula by Beatty and Ritter (1986):
Many researchers and studies documented the underpricing anomaly over many periods and across many countries. In the following literature we will shed the light on their empirical findings and results. Also, discuss the causes of underpricing and the relation between underpricing and the ex-ante uncertainty.
3.3 Evidence of Underpricing
One of the first empirical evidence on the existence of the IPO underpricing phenomenon was given by Ibbotson (1975), who confirm 11.4% average positive initial return on the US initial public offers during the period from 1960 to 1969. Ritter (1984) examine 1075 American companies during 6-year period among which 569 technology companies, from 1977 to 1982, 16.3% average initial return was documented. Furthermore, Ritter (2017) showed that the level of underpricing changed over time, the average underpricing during the period from 1980 to 1989 was 7.3% and that from 1990 to 1998 was 14.8% while during the “internet bubble period” from 1999 to 2000 was 64.5%, and during 2001 through 2016 the
underpricing level was 14.4%. The following graph show the number of initial public offers and the average of initial return from 1980 to 2017 (Figure 1).
Figure1.(Ritter,2017). https://site.warrington.ufl.edu/ritter/files/2018/07/IPOs2017Underpricing.pdf See (Appendix 4)
3.4 Causes of underpricing
Many economists developed theoretical models to explain the underpricing phenomenon. They try to answer the question, why companies leave money on the table? Many agree that underpricing is one of the methods that attract investors to the public offer by compensating them for the risk of buying the company share for the first time. While others believe that it can help the company to avoid the legal dispute. Another argued that it is a way to distribute the company equity among large populations of investors to prevent any hostile takeover. However, none of the previous can fully explain the phenomenon, in the following section we will deeply discuss several explanations for the causes of the underpricing.
0.0% 10.0% 20.0% 30.0% 40.0% 50.0% 60.0% 70.0% 80.0% 0 100 200 300 400 500 600 700 800 av erage ini ti al r etu rn Num be r of i po year
Number of ipos and average initial return (1980-2017
)
3.4.1 Asymmetric information model
Asymmetric information refers to the uncertainty about the real intrinsic value of IPO stock (Loughran & Ritter, 2001). Baron and Holmström (1980) discussed the conflict between the underwriter or the investment bank and issuing firm. Every party has different motivation through the public offer; the underwriter wants to lower the associated cost and expenses from marketing the offer and distributing the share to the public by lowering the public offering price. On the other hand, the issuing firm is interested in maximizing their potential revenue.
In most of IPOs the Issuing firm delegate the pricing process to the underwriters because they have information about the expected demand on the firm stock (Fabrizio, 2000). During the registration process underwriter and the syndicate announce the initial public offer through “Red Herring” and collect information about the market interest. So the underwriter has good information about the price of the offered stock clearly (Baron, 1982). But the underwriter believes that the issuing firm will not observe or compensate the work effort of marketing and distributing the shares. So underwriter always tends to underprice the Public offer to increase the probability of selling all offered shares and lower the associated cost and work efforts, subsequently increasing profits.
Baron model predicts that the IPO underpricing will increase if there is more ex-ante uncertainty. The model tries to solve the Asymmetry information problem by providing an overview of the main characteristics of an optimal contract between the underwriter and the issuing firm.
Muscarella and Vetsuypens (1989) tested the validity of Baron Model. They investigate 38 IPOs of investment banks during the period 1970 through 1987 and they assume that the underpricing should be less than regular since there is no information asymmetry problem. However, they find that investment bank IPOs were significantly much higher underpriced and not consistent with Baron Information asymmetric model, hence Baron model cannot fully explain the phenomenon (Allen & Faulhaber, 1989).
3.4.2 The winner’s curse
Another explanation was provided by Rock (1986), he argued that information asymmetry between investors can cause underpricing; this theory is known as “The adverse selection theory”. Rock hypothesizes that there are two types of initial public offer investors; informed investors who are institutional investors, and have access to high-quality information, and uninformed investors who don’t have any information about the intrinsic value of the offered stock. Both parties will act differently during the initial public offer. Disregarding the quality of the offer the less informed investors will participate in all IPOs, while the informed investors will only participate in underpriced IPOs that in turn will yield a higher return. So if there is an overpriced offer only the uninformed investors will lose money by participating in such offer. The continuous loss of the uninformed investors will force them to leave the IPO-market. And therefore, the underwriter will only find the informed investors in the market, which may reduce demand for stocks and reduce the profit margins. Underwriters understand the situation and his consequences, so the best idea for a successful IPO is to encourage the uninformed investors through underpricing the offer. Rock (1986) argued that the underpricing is a reward for “the winner curse problem” to the less informed investors to encourage them to invest in the public offer.
3.4.3 Signalling
Allen and Faulhaber (1989) explained the underpricing as signalling from the issuing firm to investors. Their model divides the market into two categories: good companies and bad companies. The good company wants to signal their high-quality prospect through underpricing its public offer and make it easy for the market to identify it. Investors know for sure that a poor quality company cannot recuperate the cost of underpriced IPO, and only good company that has good uses of the IPO proceed and better investment projects with higher potential profit in the future, has a good opportunity to recover from the associated cost of underpricing the initial public offer (Welch, 1992).
Ibbotson (1975) argued that underpricing, “leave a good taste in investor’s mouth” and firms that underprice its initial offer have a greater probability to be seen as a good company in the following successive offers. In other words, companies can sell small part of its shares in the initial public offer with a low price subsequently when
the market and investors observe the high quality of the offer, they can come back to the market and sell more shares with more favourable prices as the uncertainty about the company decreases.
3.4.4 Behavioural Explanations
Welch (1992) introduced different explanation for the underpricing phenomena; he argued that investor decision is influenced by the behaviour of the early investors. Shares are sold in markets sequentially, and investors imitate the behavior of early IPO subscribers and ignore all their own information. If the early investors find out that the IPO is overpriced, they will pass the information to the others. This irrational behaviour will create a “cascade” in the market, and the demand for shares will be intensively elastic. This may be the reason behind the underpricing, that the issuing firm is forced to underprice its offer to make sure that there are enough investors in the market.
3.4.4.1 Investor Sentiment Model
Investor sentiment is an irrational decision driven by investor emotion that makes the investors trade on basis of noise. In other words, investors tend to make their investment decision irrationally disregarding the fundamental data. Baker and Wurgler (2007) defined the investor sentiment as the “investor’s belief about the future cash flow”. An empirical evidence was provided by Derrien (2005) using the investor demand as proxy of the investor’s sentiment. The result showed that investor's sentiment was responsible for large initial return and negative long-run IPO return. Baker and Wurgler (2006) stated that when information asymmetry problem is critical investors sentiment become a significant factor in the valuation of the initial public offer. Also, Campbell, Rhee, Du, and Tang (2008) documented a significant positive relationship between investor sentiment and the level of underpricing. The first research that Induce investor sentiment as an explanation for the IPO underpricing was published by Ljungqvist, Nanda and Singh (2006) Arguing that sentiment investors hold optimistic feeling about the company future prospect that motivates them to participate in the public offer. They found that initial public offer will be underpriced even in the absence of asymmetric information.
Another behavioral explanation was presented by Loughran and Ritter (2002). In their research they put an answer for the question “Why company does not get upset
about leaving money on the table?” They stated that the issuing company cares about the level of wealth not about the change in the wealth. And the loss of "leaving money on the table" will be compensated by the gain from selling retained shares when the price adjusts to reveal the intrinsic value of the share after the initial public offer.
3.4.5 Litigation-risk
Companies tend to “leave money on the table” to decrease the probability of being sued by disappointed investors after the IPO. Section 11 of the Security Act 1933 gives investors the right to sue the issuing company and the underwriter for wrong pricing due to providing misleading information. This motivates the underwriter to put more efforts during the due diligence process. According to Ibbotson (1975) companies sell the issued stock at a lower price to avoid the lawsuit from shareholders who are frustrated by the performance of the IPO. Lowry and Shu (2002) found that 6% of US IPOs during the period from 1988 through 1995 have been sued for omission of relevant information in their prospectus. The consequences of the missing information resulted in wrong share pricing and loss to the shareholders. Tinic (1988) considers IPO underpricing as an insurance against the litigation costs that could result from dragging the company into judicial disputes. Examples of such costs are; legal fees, the reputation cost of both the underwriter and the issuer, and the opportunity cost of management time and efforts dedicated to resolving the conflict. Moreover, the issuing firm may face a higher probability of failure if they consider a second equity offer. Alexander (1993) found that there is a strong correlation between the first-day initial return and the probability of getting sued by investors; he explained that the underwriter should give great attention to audit the firm financial statement during the due diligence process to avoid lawsuits. In his empirical work, he found that the probability of being sued when the initial return is negative is higher than that if it was positive, according to his finding, companies that underprice its stock price more will eliminate the litigation risk and maintain its reputation in the market. Tinic (1988) tested “the legal liability hypothesis” and provide evidence on the relationship between litigation cost and underpricing, by comparing the average underpricing of two groups of IPOs before and after the “Security Act of 1933”. The first group consist of 70 IPOs occurred between 1923 and 1930 while the second group was 134 IPOs during the period 1966 through 1971. He found that the average
level of underpricing for the first group (before The Security Act of 1933) was 5.2%, while the second group (after the security Act of 1933) was 11.1%. The result supports the “insurance hypothesis” and showed that IPOs that occurred after the security Act was more underpriced to hedge the issuing company against any potential litigation risk. Tinic (1988) also, stated that the greater due diligence skills during the period before the security Act reduced the need for underpricing.
On the other side, Drake and Vetsuypens (1993) gave evidence against the “legal liability theory” by taking two samples of 93 IPOS that are matched in; IPO year, offer size, and underwriter prestige but the first sample was sued by investors while the second sample wasn’t. By comparing the two samples they found that the sued firms were just underpriced as the other sample. Furthermore, the underpriced firms were sued more than the overpriced firms. Lowry and Shu (2002) criticized the above argument explaining that the comparison didn’t take into consideration the probability of getting sued into consideration. They argued that underpricing reduces the legal liability risk, but the greater the risk the more underpricing is required.
3.4.6 The ex-ante uncertainty theory
Beaty and Ritter (1986) extended Rock (1986) model and included the ex-ante uncertainty about the value of the offered stock. They assumed that the winner curse will be worse if the ex-ante uncertainty increased. They argued that as the uncertainty about the value of the firm increase investors will be less encouraged to invest in the public offer since it will bring greater risk. Investors were expecting that they will get more compensation by lowering the public offering price, in other words, more underpricing. The underwriter is forced to lower the share price to meet the market demand because uninformed investors will prefer not to participate in the offer and leave the market. Beaty and Ritter (1986) followed Ritter (1984) approach; they used the company age, sales revenue and the offer volume as proxies for ex-ante uncertainty in their empirical work. In the following part we present the hypothesis and ex-ante uncertainty proxies.
3.
Hypothesis
4.1 Underpricing of US FinTech companies
Underpricing is a percentage difference between the offer price of the share sold to the public investor and first day closing price, it refers to the increase in the price of the IPO on the first trading day Barry and Jennings (1993). It also can be measured as the “Amount of money left on the table”, Example of one of the largest cash raised IPO in the history of the financial technology companies was the initial public offer of Workday, Inc (Wikipedia). On October 12, 2012 the company launched its IPO on the New York Stock Exchange. Its shares were offered at $28 and ended with closing price $48.69, raising $637 million through selling 22.75 million class A shares, this means that the underwriters of the IPO, in this case Morgan Stanley and Goldman Sachs, sold the shares at a price lower than its intrinsic value. In other words, this means that Workday, Inc left around $20 per share on the table. Alexander (1993) in his research, he answered the question “how much investor could gain if they invest in IPO”, the result of the research was quite remarkable, he argued that underpricing level of US IPO between 1980 and 1987 was 16.09%, and if an investor invested 1,000 dollars in each of these IPOs and sold the shares after one day of trading they would gain $698.840, this in fact what motivate investors to seek more information about the quality of the IPO and thus a higher return on their investment. Furthermore Ritter and Welch (2002) found that USA IPOs between 1980 and 2001 were on average of 18.8% underpriced. According to Loughran and Ritter (2002) the US IPOs left more than $27 billion on the table during the period (1990-1998), In the 1980s, the average first-day return on initial public offerings (IPOs) was 7%. The average first-day return doubled to almost 15% during (1990-1998), (Loughran & Ritter, 2004). Ritter (1984) investigated 1075 American companies during a 6-year period among which 569 technology companies, from 1977 to 1982, and documented 16.3% average initial return. Based on the previous discussion and empirical findings, we can formulate the following hypothesis:
4.2 Age
One of the most fundamental characteristics of the firm is the company age. The age of the firm is considered as a proxy of ex-ante uncertainty and it is calculated as the difference between the founding data and the first trading day-in years.
Older companies proved that they are able to stay and work effectively in the market for long period due to their history and reputation. Because of that investment in the older companies is considered less risky than investment in younger companies. There is less uncertainty when we deal with a company that has been in the market for a long time. Also, availability of historical financial information that investors can get at no cost can disclose the intrinsic value of the firm stocks and even make the pricing process less uncertain. The availability of information increases the probability of accurate estimates of the firm size and value of its asset.
Muscarella and Vetsuypens (1989) and Ritter (1984) stated that there was less uncertainty among the IPOs of older companies in contrast to the younger companies. They found that it is difficult to measure the right value of younger company’s shares, and therefore older companies had less average underpricing due to the availability of information while the younger companies put money on the table to encourage investors and compensate them for less information.
Ritter (1984) investigated the behaviour of US IPOs for 6 years period, from January, 1977 to December, 1982. Their findings proved a significant inverse relationship between the firm age and the level of underpricing. Also, Lungqvist and Wilhelm (2003) did a research on 2178 IPOs between January, 1996 and December, 2000. They found a significant negative relationship between the log of issuing company age and underpricing. Habib et al. (2001) proved similar result using 1409 of IPOs listed on NASDAQ during the period from 1991 to 1995.
Based on the empirical findings of the previous researches we can formulate the following hypothesis:
- The age of a FinTech company has a significant negative effect on the level of underpricing.
4.3 Market capitalization
Firm size is considered as a proxy for ex-ante uncertainty of the firm share value. As a measure of the firm size, I used the market capitalization which is the value of the outstanding shares multiplied by the share price, using market capitalization as a measure for the value of the firm is due to lack of information about the company total asset’s before the IPO. The ex-ante uncertainty proxy Market capitalization is measured in natural logarithm to reduce the right skewness of the data distribution (How, Izan and Monroe, 1995).
There is less uncertainty about the big firms when they are going public. They are always monitored by investors, government, shareholders, stakeholders and media (Zhang, 2006). Also, there is no interest in gathering information about small companies that will result in no large gains after the IPO. Securities with less information available hold a greater risk and such shortage in information will drive the market and investor to demand higher abnormal return for holding such securities (Barry & Brown, 1984).
However, many researchers investigate the relationship between market capitalization and underpricing. Mercado (2011) investigated 282 US initial public offers that occurred from 1998 to 2000, he found that a significant positive relationship between the company's market capitalization and IPO underpricing. Islam, Ali and Ahmad (2010) studied 173 IPO’s in Bangladesh stock exchange during the period from 1995 to 2005, they documented a positive relationship between market capitalization and level of underpricing, and this means that the size of the company positively influenced the degree of underpricing. Furthermore, Sohail and Nasr (2007) pursue the significance of the signalling hypothesis advanced by Allen and Faulhaber (1989) and Welch (1989) they found a significant positive relationship between the level of the underpricing of the new issues and the firm's market capitalization.
In this line with previous researches findings, we can assume the existence of positive relationship between the level of underpricing and market capitalization, hence we can postulate the following hypothesis:
- The FinTech company's market capitalization is positively correlated with the underpricing.
4.4 Proceeds
Beatty and Ritter (1986) found that uncertainty had a greater effect on the expected level of underpricing, in their research they consider the gross proceeds raised from the initial public offers as a good proxy for ex-ante uncertainty. They study 1028 US companies that went public during the period from 1977 to 1998, in their research they used the inverse of IPO’s proceed as a proxy ex-ante uncertainty. They documented a significant positive relation between the inverse of proceed and level of uncertainty. Their finding proved that larger IPOs with higher value of proceeds hold less uncertainty and small IPO issue size was more speculative. Dorsman, Simpson, and Westerman (2013) found that investors were interested in large IPO’s information and the intrinsic value of its stocks. How, Izan and Monroe (1995) Provided an empirical evidence of underpricing from Australian IPOs by studying 340 IPOs from 1980 to 1990 and found that larger firms in term of proceeds are less underpriced. In contrast, Michaely and Shaw (1994) studied the period between 1984 and 1988 with a sample consisted of 947 IPOs in USA and documented a significant positive relationship between the IPO’s proceed and underpricing even when they try to add the square of the proceed as additional variable in the regression to test the nonlinear relation, they found that the coefficient is not significant. Their research showed that larger issues tend to be more underpricing. Furthermore, the exist of an inverse relation between the firms proceed and underpricing hold true, but the use of proceeds as a proxy for uncertainty may be misleading because proceed is independent from any risk consideration (Habib and Ljungqvist, 1998). However, Megginson and Weiss (1991) used the natural logarithm of proceeds and identified a significant relation with the initial return, in the present study the natural logarithm of the proceed was used. Based on Beatty and Ritter (1986) and Megginson and Weiss (1991) findings, we can formulate the following hypothesis:
- FinTech company proceed is negatively correlated to the level of underpricing.
4.5 Number of uses of proceed
One of the IPO characteristics that is considered as a proxy of ex-ante uncertainty of the intrinsic value of the firm stock is the number of uses of proceed. Many firms transparently disclose their investment and production plans with detailed information about their cost allocation. While other firms don’t mention any specific uses, and leave the IPO gross proceeds to the firm management to decide (Schenone, 2004). Securities and Exchange Commission (SEC) regulation enforce the issuing firm to reveal more information about the number and nature of uses of proceeds from the speculative issuers, as they consider the number of uses as ex-ante uncertainty proxy that describe the uncertainty in company future (Beaty and Ritter, 1986).
Despite SEC requirements firms are unwilling to give detailed information about their specific uses of the IPO proceeds because of two reasons; (1) the firm will clearly reveal serious information about its strategy and investment plans in market to competitors at an early point in time and (2) reviling such information may expose the firm more to legal liability. Beaty and Ritter (1986) argued that issues for which there is greater ex-ante uncertainty have a greater number of the uses of proceeds listed. The greater the ex-ante uncertainty, the greater is the expected underpricing. And the lower number of uses of proceed imply a lower ex-ante uncertinity. Beaty and Ritter (1986) documented a significant positive relationship between the number of uses of proceeds and initial return using log (1+ number of uses of proceed) in the regression analysis.
Based on the empirical finding of Beaty and Ritter (1986) we can assume the following hypothesis:
- The greater The number of uses of gross proceeds of FinTech IPOs the higher the level of underpricing.
4.6 Venture backed IPO
Venture capitalist always seeks high rates of return on their investment using their skills and knowledge in financial markets. They are waiting for the perfect opportunity to exit the market and get money out of their investment. One of the optimal exit strategies is to initiate a public offer. Venture capitalist plays an important rule in the company management through helping the firm to set up strategy, investment objectives and enhance its performance to survive in the market.
Venture capitalist study the firm performance and it’s market behavior and provide technical and managerial advice, market can easily identify the venture backed firms' behavior and such behavior is rewarded by less underpricing, According to William and Weiss (1990) venture capitalist can lower the cost of going public. On the other hand, less experienced venture capitalist can take the firm to public too early, such behavior is called “grandstanding”, and it aims to establish a good reputation for the venture capitalist by announcing early public offer. Grandstanding is costly for the firm and the venture capitalist because the firm will be required to lower the public offer price to satisfy the investors demand on its securities (Berlin, 1998).
However, Barry, Muscarella, Peavy and Vetsuypens (1990) investigated 433 IPOs during the period from 1978 to 1987 and found significant evidence for the existence of a negative relationship between the ventured backed companies and level of underpricing. They also stated that venture capital firm is able to attract prestigious underwriters more than the non-venture backed firms. In this line with the empirical finding of Barry et al. (1990) we can formulate the following hypothesis:
- FinTech venture capital backed company underpricing is lower than the non-venture capital backed company.
4.7 Reputation of the Underwriter
The reputation of the underwriter is considered as a proxy for ex-ante uncertainty. Underwriter is a financial intermediary between the firm and the market. One of the important steps for a company to initiate the public offer is to hire an underwriter or investment bank. Underwriter and the company work together to set the share price which will be sold to public by the underwriter who will also, purchase all the firm shares and in turn sell them in the market to the investors. The higher the quality of the underwriter chosen the more useful information provided to investors (Titman and Trueman, 1986). Ellis et al. (2000) found a significant link between the initial public offer underpricing and the underwriter trading profit, and concluded that underwriter benefit from underpricing the firm IPOs. Underpricing almost contributes 23 % of the underwriter total profit and the larger percentage of profit come from the fees. Even after the selling, the role of the underwriter continue. Ellis et al. (2000) investigated
306 initial public offer on NASDAQ from September, 1996 until July, 1997 and defined the role played by the underwriter after IPO as the most active dealer or the market maker, according to Ellis et al. (2000) results, underwriter handle 60% of the share trading volume during the few days after IPOs. Fabrizio (2000) believed that hiring higher quality underwriters will result in lower levels of uncertainty, and investors assume that prestigious underwriter price the share as close as possible to its intrinsic value (Sharma & Seraphim, 2010). Other studies also support this point of view, Beatty and Welch (1996) and Cooney, Singh, Carter and Dark (2001) found that the quality of the underwriter is inversely related to the level of underpricing, and prestigious underwriters were associated with less risky offers (Beatty & Ritter, 1986 and Carter & Manaster, 1990).
On the other side, other researchers believed that the higher the reputation of the underwriter the higher the level of underpricing, such believe was documented by Dimovski, Philavanh and Brooks (2011), they examined 358 Australian IPOs from 1994 to 1999, their result suggested that prestigious underwriter are associated with higher levels of underpricing, and they documented a significant positive relationship between the underpricing and the underwriter reputation. This evidence supports the findings of Loughran and Ritter (2004) that high reputable underwriters always tend to underprice the initial public offer for their own favor, in other words underwriters tend to sell the firm IPO share at a lower price to their clients, the huge demand will push the price and make higher profit (Huang and Levich, 1998). However, Carter and Manaster (1990) studied 501 US IPOs from 1979 to 1983, their work revealed that high prestigious underwriter prefers to select low risk firms that has no intention to underprice its offer to encourage and compensate investors for risk, Carter and Manaster claimed that the higher underwriter quality was associated with the lower IPO return, and the inverse relationship between the underwriter reputation and level of underpricing was confirmed.
According to specific criteria. Griffin, Lowery and Saretto (2014) presented a rank for underwriters that have good reputation in a table range from (1-9), in which nine is the highest score of underwriter quality and one represent an underwriter with low quality. An investment bank or underwriter that has poor quality is not listed on the table, which means that his rank on reputation is zero. In the present study, we have
been using Griffin et al. (2014) ranking list as reference for underwriter quality. According to our analysis, we introduced a dummy variable to distinguish between reputable and non reputable underwriters, in other words, any underwriter that has at least 1 rank in the table was assigned to a dummy variable value equal 1, and underwriter who was not found in the list was assigned to a dummy variable value equal 0.
However, The debate about the relationship between underwriter reputation and underpricing has been of major interest of many researchers. Baron (1982), Beatty and Ritter (1986), Carter and Manaster (1990), Fabrizio (2000), Cooney et al. (2001) and Beatty and Welch (1996), among others have the same point of view regarding the debate about the inverse nature of the relation between the underwriter quality and the level of underpricing. Despite, Dimovski et al. (2011) findings, it is more logical to assume that underwriter reputation is inversely related with the level of underpricing and then we can formulate the following hypothesis:
- Underwriter reputation has a significant negative relationship with the level of underpricing.
4. Data
The thesis data consists of 62 US FinTech companies that went public from January, 2005 to July, 2017. The list of companies was created using the database of FT partners (2017) and the Nasdaq KBW financial technology Index, the database cover most of FinTech companies in the US market and some of these companies went public during the period from 2005 to 2017. The companies were investigated manually by searching for IPO information. The other source of the data was collected from; FinTech reports, articles, researches and websites such as “yahoo finance” and “crunch base”.
After constructing the FinTech companies list, the regression date; the founding date, IPO date, proceeds, market capitalization, whether the company is venture backed or not, and the name of the underwriter was gathered using Thomson Reuters, and when there is missing data a search for the IPO admission document was
conducted then completing the missing information. Also, the offer price and first day closing prices were gathered using data stream and yahoo finance (Appendix 2).
5.1 Descriptive statistics
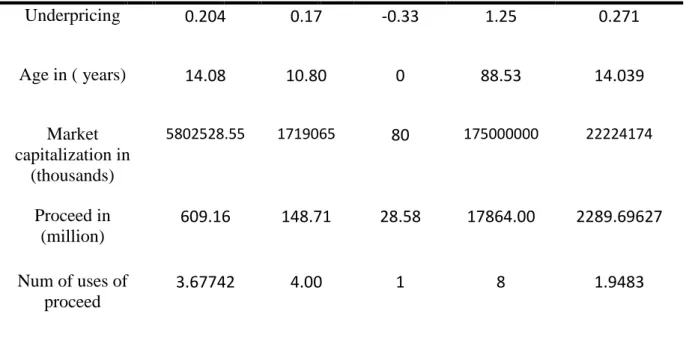
The average underpricing level in US Fintech IPOs equal 20.4%. There is a big spread in the underpricing level, the minimum underpricing level in the data belong to Dollar Financial corporation, and it equals (-0.33) and the maximum (1.25) belong to Nymex holdings Inc. That does explain the high standard deviation (0.271). What catch attention in the data set is the market capitalization extreme values. The market capitalization differs widely, the minimum market capitalization is $80,000, it belongs to liquid holdings group INC (which is a small FinTech company with 72 employees up to date, and the company was delisted on Sep 24, 2015), the maximum market capitalization belongs to largest U.S. IPO, Visa Inc with ($175) billion, (the market capitalization of Visa Inc on November 30,2018 was $280.57 billion), both values are extreme and are considered as outliers in the data set which could negatively affect the analysis. These values cause a high standard deviation ($22.22) billion. The average US FinTech age is (14.08) years, and the age range from (0) to (88.53) years, the zero value belongs to Nymex holdings Inc and the largest age belong to Cowen Group Inc. The average proceeds of US FinTech IPOs $609.16 million, the highest proceed belong to visa Inc with $17.8 billion and the lowest belong to liquid holdings group Inc with ($28.58) million. The average number of the uses of proceeds in the data set is (3.6) (Table 1).
Table 1: Descriptive statistics of the US 62 FinTech companies.
Variable Mean Median Minimum Maximum Standard
deviation Underpricing 0.204 0.17 -0.33 1.25 0.271 Age in ( years) 14.08 10.80 0 88.53 14.039 Market capitalization in (thousands) 5802528.55 1719065 80 175000000 22224174 Proceed in (million) 609.16 148.71 28.58 17864.00 2289.69627 Num of uses of proceed 3.67742 4.00 1 8 1.9483
5. Methodology
In this section the methodology of the thesis will be discussed, underpricing is calculated and used as the dependent variable and ex-ante uncertainty proxies as independent variables, the relationship is examined in two multivariate regressions, the first regression test the firm characteristics variables only and the second regression analysis add the IPO characteristics for further investigation.
6.1 Underpricing
Underpricing is a percentage difference between the offer price and first day closing price; it is calculated using the following formula:
Underpricing = (1)
Testing firm characteristics variables
The First model test the ex-ante uncertainty proxies of the firm characteristics (age and the market capitalization), the natural logarithm was taking to the two variables after adding one to the firm age.
Underpricing = α + β1 *ln (1+Age) + β2* ln (Market Capitalization) +
є
t(2)
Testing firm characteristics and IPO characteristics
The second model adds four ex-ante uncertainty proxies represent the IPO characteristics among them two dummy variables.
Underpricing = α + β1* ln (1+Age) +β2* ln (Market Capitalization) + β3*ln (proceed) + β4*(# uses of proceed) +D1*(venture backed) + D2*(underwriter reputation) + єi (3)
The natural logarithm was taken for the IPO proceed, venture backed is a dummy variable determines whether the firm is venture backed or not (1 if the firm is venture backed). Also, underwriter reputation is a dummy variable determine whether the underwriter posses a prestigious reputation or not (1 if the underwriter reputation is good).
From the OLS regression results, The following hypothesis will be tested using the student’s t-test
H1: US FinTech companies have positive level of underpricing
H2: The Age of a FinTech company has a significant negative effect on the level of
underpricing.
H3: The FinTech company’s market capitalization is positively correlated with the
underpricing
H4: FinTech company proceed is negatively correlated to the level of underpricing.
H5: The greater The number of uses of gross proceeds of FinTech IPOs the higher the
level of underpricing.
H6: FinTech venture capital backed company underpricing is lower than the
non-venture capital backed company.
H7: Underwriter reputation has a significant negative relationship with the level of
underpricing .
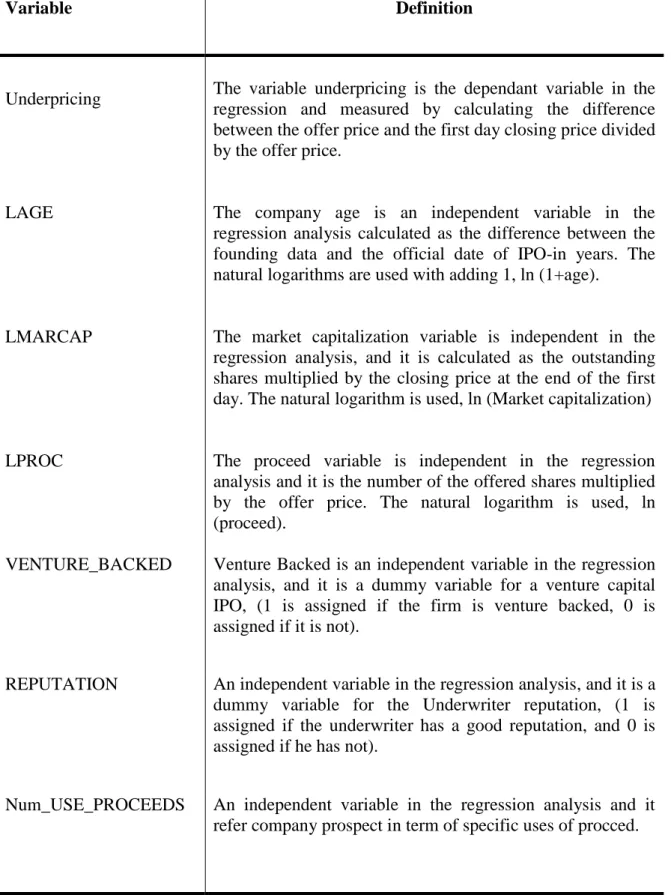
Table 2. Variables definition
Variable Definition
Underpricing The variable underpricing is the dependant variable in the regression and measured by calculating the difference between the offer price and the first day closing price divided by the offer price.
LAGE The company age is an independent variable in the regression analysis calculated as the difference between the founding data and the official date of IPO-in years. The natural logarithms are used with adding 1, ln (1+age).
LMARCAP The market capitalization variable is independent in the regression analysis, and it is calculated as the outstanding shares multiplied by the closing price at the end of the first day. The natural logarithm is used, ln (Market capitalization)
LPROC The proceed variable is independent in the regression analysis and it is the number of the offered shares multiplied by the offer price. The natural logarithm is used, ln (proceed).
VENTURE_BACKED Venture Backed is an independent variable in the regression analysis, and it is a dummy variable for a venture capital IPO, (1 is assigned if the firm is venture backed, 0 is assigned if it is not).
REPUTATION An independent variable in the regression analysis, and it is a dummy variable for the Underwriter reputation, (1 is assigned if the underwriter has a good reputation, and 0 is assigned if he has not).
Num_USE_PROCEEDS An independent variable in the regression analysis and it refer company prospect in term of specific uses of procced.
6.
Results
7.1 Underpricing of USA FinTech companies
Underpricing of US FinTech companies data set is indicated by the average underpricing of all data. To be able test the first hypothesis which is (H1: US FinTech
companies has positive level of underpricing), this mean that, the average of
underpricing is significantly different from zero, so underpricing variable was tested on its significance (Table 3).
Table 3. Underpricing of US FinTech companies.
underpricing t-statistic Std.Dv
US FinTech companies 0.204636 5.945320* 0.271021
* Significant at 1%
US FinTech companies are significantly underpriced with 20.4%. In light of this result, we cannot reject the hypothesis H1. According to Ritter (2017), the
underpricing level of US companies during the period from 2001 to 2016 was 14.4%. By comparing this level with our result, it appears that, FinTech companies are more underpricied than the overall US companies by 6%.
The table (4) provides insights into the average underpricing per year in US FinTech companies in the data set; the table reports the number and year of IPOs, average underpricing and the average proceed during the period from 2005 to 2017. There are a big range between the lowest and the highest underpricing level in the data. The two highest underpricing levels of US Fintech companies was 37.9% in 2006 caused by 4 companies, 37.5% in 2012 caused by 8 companies, the lowest underpricing was 6% in 2016 caused by 2 companies. The number of IPOs of US FinTech companies during the period (2012-2015) was 32 IPOs and the highest number of IPOs was 10 IPOs in 2014. The period from 2012 to 2015 seem to be a hot period for US FinTech companies. The highest proceed was reported in 2008 due to IPO of Visa Inc which is one of the largest public offer in the history of FinTech companies.
Table 4. Average underpricing by years of US FinTech companies in the dataset.
years
Underpricing average Proceed average (million) IPOs num 2005 17% 134.17 8 2006 37.9% 210.96 4 2007 14% 516.63 4 2008 32% 9055 2 2009 15% 1121.43 2 2010 16% 151.38 6 2011 - - - 2012 37.5% 241.25 8 2013 14% 201.64 6 2014 22% 478.64 10 2015 7% 499.25 8 2016 6% 192.46 2 2017 32% 109.54 2
7.2 The relationship between underpricing and ex-ante uncertainty proxies
Table (5) reports two regression analyses using OLS regression. The first model is regression analysis of the firm characteristics in which two variables are tested (the company age and the market capitalization), and the second model tests both the firm characteristics and the IPO characteristics (Four variables are added to the regression analysis; IPO proceed, number of uses of proceed, venture backed, underwriter reputation).
7.2.1 Testing firm characteristics
The firm age is negatively correlated with the level of underpricing. This means that the older the US FinTech company at the IPO date, the lower the level of underpricing, however the regression result report that this inverse relationship is not significant with (t-statistic equal -0.056 and p-value equal 13.52%), hence we can
Table 5 . Overview of the Regression model of US FinTech companies
variables Model 1 Model 2
Constant -0.418*** (-1.83) -0.688* (-2.911) LAGE -0.056 (-1.51) -0.052 (-1.485) LMARCAP 0.053* (3.192) 0.050** (2.459) LPROC 0.019 (0.5) Num_USE_PROCEEDS 0.0311*** (1.896) VENTURE_BACKED 0.1667** (2.44) REPUTATION 0.025 (.265) R-squared .1515 .296 Adjusted R-squared .1228 .219 F-statistic 5.27 3.864 Prob(F-statistic) .0078 0.0027
*** Significant at 10%, ** Significant at 5%, * Significant at 1% (See appendix 1)
reject the hypothesis (H2:The Age of a FinTech company has a significant negative