J
Ö N K Ö P I N GI
N T E R N A T I O N A LB
U S I N E S SS
C H O O LJÖNKÖPING UNIVERSITY
E m i s s i o n Tr a d i n g
Auctioning vs. Grandfathering
Paper within: Economics
Author: Johan Liljenberg 840213 - 3592 Willy Rudman 850214 - 4895 Head Tutor: Åke Andersson,
Assistant Tutor: James Dzansi Jönköping 13/11/2009
Bachelor Thesis in Economics
Title: Emission Trading; Auctioning vs. Grandfathering
Authors: Willy Rudman 850214-4895
Johan Liljenberg 840213-3592
Tutors: Åke Andersson
James Dzansi
Date: 2009-11-13
Keywords: Auctioning, EU ETS, Green House Gases,
Grandfathering, Allocation
Abstract
This thesis examines the debate between the auctioning of green house gas permits vs. the free distribution of green house gas permits, also known as grandfathering. The authors’ purpose is to discover which allocation system is more suited under the European Union Emissions Trading Scheme (EU ETS). To help draw the conclusion, data and views have been collected from different known researchers within the emission trading field and – compared to different theories and the view of the authors.
Evidence suggested that auctioning as an allocation system is more efficient than a system based solely on free allocation (e.g. grandfathering). Evidence of this can be found in the electricity sector by comparing the electricity prices the consumer stand to pay before and after the producing firm receives there emission rights for free. When the producing firms receive their emission rights free of charge they stand with the option to sell their rights or to use them in their production. By selling its electricity the producers wants to recover their forgone opportunity and can do so via the price paid for by the consumer.
By also looking at the two systems under distribution one can also see that auctioning is more efficient since under this system, the polluters end up buying the right to pollute from the public. With a system based on grandfathering, the affected firms under EU ETS will receive windfall profits when given the emission rights for free as they can choose to store and sell the rights at a later date.
Kandidatuppsats i Nationalekonomi
Titel: Handel med utsläppsrätter; Auktionering vs. Gratis
tilldelning
Författare: Willy Rudman 850214-4895
Johan Liljenberg 840213-3592
Handledare: Åke Andersson
James Dzansi
Datum: 2009-11-13
Nyckelord: Auktionering, EU ETS, Växthusgaser, Gratis tilldelning,
Allokering
Sammanfattning
Denna kandidatuppsats undersöker debatten kring auktionering vs. gratis tilldelning av utsläppsrätter även kallat grandfathering. Målet med uppsatsen är att fastslå vilket tilldelningssystem som är bättre anpassat för användning i Europeiska Unionens handelssystem med utsläppsrätter, (EU ETS).
För att komma fram till en slutsats, har författarna samlat data och teori från diverse kända forskare inom området och jämfört dessa med sina egna ekonomiska teorier och tankar.
I rapporten framgår det att auktionering som tilldelningssystem är sannolikt mer effektivt än ett tilldelningssystem baserat enbart på gratis tilldelning. Detta går att påvisa bland annat genom att jämföra priset av elektricitet som konsumenten får betala både innan och efter att företagen erhållit gratis utsläppsrätter. När företagen som verkar inom energisektorn får sina utsläppsrätter gratis står de med möjligheten att sälja dem vidare eller att använda sig av dem. På så vis om företagen väljer att producera elektricitet kan de inte längre sälja sina utsläppsrätter och måste på så sätt kompensera detta beslut, vilket de ofta gör via en höjning av priset för konsumenten.
Ser man även till själva tilldelningssystemet är auktionen av utsläppsrätter ett bättre val då det gör så att de företag som släpper ut växthusgaser även får stå för notan. Vid gratis tilldelning får företagen som är berörda av EU ETS en oväntad inkomst som de kan spara eller använda när de behagar.
Table of Contents
Definitions ... V
1
Introduction ... 1
1.1 Problem and Purpose ... 2
1.2 Method ... 3 1.3 Limitations ... 3 1.4 Previous studies ... 3
2
Background ... 5
2.1 Kyoto and EU ... 5 2.2 EU ETS ... 62.2.1 EU ETS in Sweden; The grandfathering process ... 8
2.2.2 The Auctioning process ... 9
3
Theories ... 10
3.1 Tragedy of the commons ... 10
3.1.1 The open access problem ... 10
3.2 Game theory ... 13
3.2.1 Prisoners Dilemma ... 14
3.2.3 Iterated Game ... 17
3.3 Emission trading ... 17
3.3.1 Clean development mechanism (CDM) ... 18
3.3.2 Joint Implementation (JI) ... 19
3.4 Opportunity cost ... 20
4
Quantitative Findings in Previous Studies ... 21
4.1 Auctioning vs. Grandfathering on prices ... 21
4.2 Auctioning vs. Grandfathering and the allocation of allowances ... 24
5
Analysis ... 26
5.1 Auctioning vs. Grandfathering on prices ... 26
5.2 Auctioning vs. Grandfathering on the distribution ... 27
6
Conclusion ... 30
7
Suggestions for further studies ... 31
8
References ... 32
Appendix 1 ... 35
Figures
Figure 1: The relationship between number of vessels and total catch of fish ... 11
Figure 2: Efficiency ... 13
Figure 3: Electricity price with and without opportunity cost ... 24
Tables Table 1: Different emission reduction programs ... 4
Table 2: The allocation of allowances in Sweden during period one and two. ... 8
Table 3: A matrix showing the prisoners dilemma ... ...15
Table 4: A matrix showing stable and unstable equilibrium ... ...15
Table 5: A matrix showing a dilemma between Firm I and Firm II ... ...16
Table 6: A matrix showing the pay off between Sweden and Finland...16
Table 7: A matrix showing the pay off between Sweden and Finland...17
Table 8: Change in economic surplus and cost-effectiveness of policies in 2012...22
Table 9: Electricity price, fuel prices, and carbon emission allowance price in 2012...23
Definitions
1Emission trading can sometimes give rise to unfamiliar concepts. Thus we have chosen to explain some of the most common definitions.
Annex I Countries
Mostly industrialised countries that were members of the OECD in 1992, and the countries with economies in transition including the Russian Federation, the Baltic States, and several Central and Eastern European States. These countries are Australia, Austria, Belarus, Belgium, Bulgaria, Canada, Croatia, Czech Republic, Denmark, Estonia, Finland, France, Germany, Greece, Hungary, Iceland, Ireland, Italy, Japan, Latvia, Liechtenstein, Lithuania, Luxembourg, Monaco, Netherlands, New Zealand, Norway, Poland, Portugal, Romania, Russian Federation, Slovakia, Slovenia, Spain, Sweden, Switzerland, Turkey, Ukraine, United Kingdom, United States of America
Annex II Countries
This group consists of developed countries: Australia, Austria, Belgium, Canada, Denmark, Finland, France, Germany, Greece, Iceland, Ireland, Italy, Japan, Luxembourg, Netherlands, New Zealand, Norway, Portugal, Spain, Sweden, Switzerland, United Kingdom, United States of America
Annex III
A report composed by the UNFCCC-committee regarding guidelines and rules of emission trading in EU.
Annex B Countries
EU-15 , Australia, Bulgaria, Canada , Croatia, Czech Republic, Estonia, Hungary , Iceland, Japan, Latvia, Liechtenstein, Lithuania, Monaco, New Zealand , Norway, Poland, Romania, Russian Federation, Slovakia, Slovenia, Switzerland, Ukraine, US
CER Certified Emission Reductions
The output earned by engaging in clean development mechanism projects. One CER equals one tone of CO2 and they can be traded, sold or used by industrialised countries to a meet a part of their emission reduction targets under the Kyoto Protocol.
Distortionary Taxes
Taxes that discourage certain behaviour. CMD Clean Development Mechanism
The Clean Development Mechanism (CDM), defined in Article 12 of the Kyoto protocol, allows industrialised countries (Annex I countries) to invest in projects that reduce emissions in developing countries where the cost of emission reduction is lower than domestically.
JI Joint Implementation
Joint Implementation allows any Annex I country to invest in projects that reduce greenhouse gas emissions in other Annex I countries. It is similar to CMD, but its focus is on the industrialised countries whereas CMD focus on the developing countries.
EU-15 European Union-15
Was the number of member countries in the European Union prior to 1 May 2004. These were: Austria, Belgium, Denmark, Finland, France, Germany, Greece, Ireland, Italy, Luxembourg, Netherlands, Portugal, Spain, Sweden, and United Kingdom.
ERU Emission Reduction Unit
By reducing greenhouse gases equivalent to one tone, an Emission Reduction Unit is awarded to the participating party. Synonymous with Joint Implementation
GHG Greenhouse gases
The six greenhouse gases mentioned in the Kyoto Protocol are: Carbon dioxide (CO2), Methane (CH4), Nitrous oxide (N2O), Hydro fluorocarbons
(HFCs), Per fluorocarbons (PFCs), and Sculpture hexafluoride (SF6).
OECD Organisation for Economic Co-operation and Development
An international organisation helping governments of the developed countries to tackle the economic and social challenges of a globalised economy.
UNFCCC United Nations Framework Convention on Climate Change
An international environmental treaty formed at the Earth Summit, held in Rio de Janeiro in June 1992. The objective of the treaty is to stabilise greenhouse gas concentrations in the atmosphere at a level that would prevent dangerous anthropogenic interference with the climate system.
Windfall Profits
1
Introduction
This part of the thesis will introduce the reader to the chosen topic. It will give the reader an insight in our problem and purpose. It will also inform the reader what method we will use and earlier studies on this topic.
"The vast majority of the world’s climate scientists have concluded that if
the countries of the world do not work together to cut the emission of greenhouse gases, then temperatures will rise and will disrupt the climate. In fact, most scientists say the process has already begun."
President Clinton, October 22, 1997 During the last decade, the impact of industrialisation on global warming has been enormous; the increasing usage of gasoline, oil and coal has led to rising temperatures (UNFCCC 2008a). Consuming these resources at the current rate will enhance the already existing amount of natural green house gases (GHGs) in the atmosphere, thus creating a warmer environment and a change in climate (UNFCCC 2008a). For people the impact has already been shown in the numerous natural disasters that have recently been appearing such as storms, floods, heat waves and tropical cyclones. Global warming has undisputedly become a worldwide crisis creating a need for cooperation between nations to take control over GHG emissions and to come up with ideas on how to reduce GHGs (UNFCCC 2008a).
In the beginning of 2005 EU became the largest GHG emission market involving five2
energy intensive sectors; 25 countries and 13 000 industries, representing nearly half of the total amount of CO2 emissions in the EU (Dornau 2005; Åhman, Burtraw, Kruger,
Zetterberg 2005). The goal for the EU is to lower the amount of GHGs in the atmosphere by 8 percent compared to 1990 levels in the period from 2008 to 2012 and thus reach the target under the Kyoto protocol (Lefevere 2005).
The carbon market is estimated to be worth approximately $64bn. As more and more industries will be included (e.g. airline industry to be included as of 2012) the market size will increase over the next couple of years (Harvey 2008).
Emission trading has become a cost-effective way for firms to lower their emission by conducting trade in a country where it is least costly to produce emissions (Brushel,
2 Power and heat generation, mineral oil refineries, iron and steel (incl. coke ovens), pulp and paper and
Peterman & Wolfram 2007). Hence the market for emission trading has become very important and increased attention has been given to its development (Brushel, Peterman & Wolfram 2007).
However the emission market has brought up one big problem, how should the emission permits be allocated between different interest groups so that the market becomes as efficient as possible?
The distribution of emission allowances will have an effect on the participating parties if the permits are distributed so to create an incentive affecting economic behaviour and thus involving a cost in reaching the emission target (Åhman et al. 2005). The emission trading scheme uses such an incentive based mechanism known as “cap and trade”. Firms that are emitting GHGs need permits that can be obtained from the government. Government then reduces the numbers of permits available in the market by putting a cap on the level of emissions. For every year the pool of emission allowances becomes smaller and smaller – making the competition for these permits increasingly intense and thus more and more expensive (So, now you’ve bought an emission trading scheme 2008).
The authors of this thesis will give an account of the problem regarding the distribution of the emission permits. This paper will explain the European Emission Trading Scheme (EU ETS) that was established to tackle global warming. Much of the attention will be given to the relationship between economic theory and emission trading.
1.1 Problem and Purpose
Emission trading as a system to help lower the amount of GHGs in the atmosphere is nothing new3. However EU ETS is the largest of them all, involving 27 European countries
and thus incorporates cross national cooperation. Thus the question has been how to allocate emission allowances between different members.
According to Neuhoff and Matthes (2007), auctioning carbon permits is favoured as it does not generate windfall profits nor does distort operation and consumption choices. Nevertheless in September 2007, Lithuania auctioned 552 000 carbon allowances. At a sales price of €0.06 per tonne, revenues became €33 120. These revenues only just covered Lithuanians administrative compliance costs and as such, they come to display the downside of the auctioning process under EU ETS (CCC Newsdesk 2007).
For the period2005-2012 the EU ETS will distribute almost all of its emission allowances gratis via a system known as grandfathering. However for the period running from 2013-2020, it has been proposed that free allocation will be replaced by a system relying entirely on the auctioning of allowances.
The purpose of this thesis is to determine which of the above mentioned options (grandfathering or auctioning) is more efficient.
1.2 Method
The authors have aimed to stick to a hierarchy of qualified information. This means that the preferred order of information is scientific journals with peer review; dissertations; edited books with peer review; monographs published by scientific publishers; working papers and at last Internet sources. Most information will be found in university databases. Although the trading of emissions rights is a relatively new phenomenon, the topic has been widely discussed. Therefore, the strength of the method used is that a plentiful of articles, interviews, debates and documentaries has covered the field of the thesis, so it will be easy to attain several different perspectives of the matter. The authors will summarise, compare and analyse the retrieved information to serve the purpose of the thesis.
1.3 Limitations
There are not enough data available on this topic to conduct an econometric model and therefore the problem will be solved, as mentioned in section 1.2, through comparing and analysing previous studies and results from other researchers.
1.4 Previous studies
Regarding the implementation of the Kyoto protocol, Bohm (2002) attempts to distinguish between grandfathering and auctioning with respect to efficiency and distribution. He reaches the conclusion that the distributional effects of GHG allocation can only be evaluated after specifying which permit scheme is used and in combination with what intention. For example if auctioning is used it is important to explain what the revenues are used for and if grandfathering is used it is important to determine if it is combined with any form of rent capture. Thus, under these circumstances it cannot be said that auctioning is generally more cost-effective than grandfathering as it depends on how the revenues from auctioning is used and how that outcome will effect efficiency. Under a scenario where the choice is between grandfathering with no rent capture and auctioning where reduction of
distortionary taxes is made, auctioning appears to become the most cost-effective option (Bohm 2002).
Focusing on grandfathering, Christophe Böhringer and Andreas Lange (2005) examine the most optimal design of a grandfathering scheme within EU. They try to investigate if free allocation of emissions should be based on historical output levels or if it should be based on a system where the allocations are constantly updated over time. They compare their findings between a closed system where a regulatory body decides on all allowance allocation (e.g. EU ETS) and an open system where the regulatory body only determines a small part of the allocation of the allowances e.g. sub-global system). They find that in a closed system the allocation of allowances should not be based on historical emissions outputs since it will almost leave all firms equal and not affect their decisions. To reduce the inefficiencies that arise in the EU ETS due to allocation based on historical outputs they suggest a system where the allocation is auctioned or lump-summed in an open system (Böhringer & Lange 2005, p. 2052).
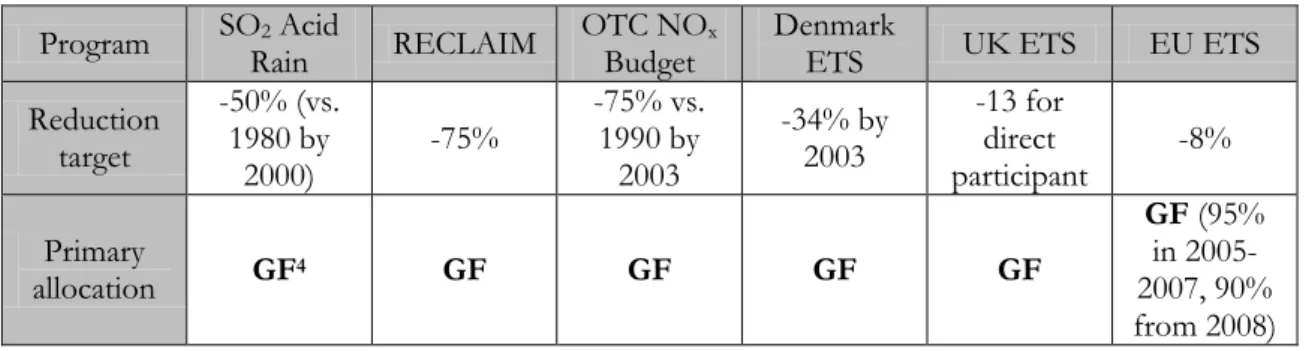
Hansjürgens (2005) compares the different emission trading schemes that are currently in use or have been used and finds them all to have been using grandfathering as an allocation method. Auctioning might be more economically efficient, still allocation of allowances gratis can work well since it reduces the political resistance from interest groups and it also reduces the burden of the trading schemes (Hansjürgens 2005).
Table 1: Different emission reduction programs Program SO2 Acid
Rain RECLAIM OTC NOBudget x Denmark ETS UK ETS EU ETS Reduction target -50% (vs. 1980 by 2000) -75% -75% vs. 1990 by 2003 -34% by 2003 -13 for direct participant -8% Primary allocation GF4 GF GF GF GF GF (95% in 2005-2007, 90% from 2008) Source: Hansjürgens (2005) 4 Grandfathering
2
Background
This chapter aims to explain why there was a need for an emission trading scheme and the way towards its creation.
2.1 Kyoto and EU
In 1997 the Kyoto protocol was adopted by the 3rd conference of the members to the
UNFCCC, as a first step towards a reduction in the global GHGs emissions (Blass 2006). Whereas the convention acknowledges that the industrialised countries should reduce their emissions, the protocol binds the parties to reduce their emissions and hence sets a very important limit for the industrialised countries (Zapfel 2005).
In 1998, the members of EU5 agreed to differentiate the Kyoto protocol targets among the
members in the so called “EU burden share agreement” (Lefevere 2005). This agreement is the spine of the EUs implementation of the Kyoto protocol. The agreement concludes that all member countries should reduce their emission targets by 8 percent between the years 2008 and 2012 compared to 1990 levels (Lefevere 2005).
The Kyoto protocol standardises three flexibility mechanisms to lower the overall cost of achieving emission targets for the commitment period 2008-2012:
Emission trading, Joint implementation
Clean development mechanism (Freestone 2005).
These three mechanisms of the Kyoto protocol are considered to be very important to the establishment of the EU ETS.
2.2 EU ETS
The EU ETS was established by directive 2003/87/EC and is a cornerstone in the fight against climate change (Blass 2006).
The EU scheme is constructed out off six fundamental keystones: a) It is a cap and trade system,
b) The schemes main focus is on coming from the big industrial emitters, c) The implementation is done in phases, with periodic evaluation and
opportunities for expansion to other sectors and gases,
d) The allocation plans for emission allowances are done periodically, e) It includes a strong compliance framework,
f) The market is EU-wide, but it is possible to conduct emission reduction in the rest of the world through the use of CDM and JI.
(Blass, p.31 2006).
Since the start in 2005, EU ETS has become the world‟s first and largest trading system for carbon dioxide and is the main driver behind the fast expansion of emission trading around the world (European Commission 2008a). Inspired by the US model to fight acid rain during the 1990s the EU ETS allows firms to reach Kyoto targets cost effectively (European Union 2008). The goal of EU ETS is to create an efficient marketplace for GHG emission allowances with least reduction in employment and economic development within the European Union (Energimyndigheten 2008).
The emission allocation for each EU country is done in accordance with Annex III which sets out the criteria for the emission allocation (Åhman et al. 2005). For example, members are not allowed to allocate additional emission for a period after (ex post) the deadline for a period (Åhman et al. 2005). Thus each countries regulatory body must decide in advance how many allowances is needed and in which sector, since it is not possible to redistribute these allowances during the trading period (Åhman et al. 2005). For the first period, 2005-2007, most of the allowances will be given away for free with approximately 5 percent being auctioned. For the second period, 2008-2012, 90 percent is given away for free (Åhman et al. 2005).
The distribution of allowances is still considered to give great freedom for each EU member. The EU members have the possibility to decide how much should be allocated to
the different participants in the scheme. Each member develops its own National Allocation Plan (NAP) which EU has to approve (Åhman et al. 2005).
The initial trading period for EU ETS was the three years after the introduction in 2005. The second, current, trading period runs from 20086 to 2012 and overlaps the first
commitment period of the Kyoto protocol, during which member states of the EU and other industrial countries most reduce their GHG targets by the limits agreed on (EU ETS: The EU‟s Innovative emission trading scheme 2008). To guarantee that these countries meet their Kyoto targets, the EU together with the individual countries have caped the emissions at an average of 6.57 percent below 2005 levels (EU ETS: The EU‟s Innovative
emission trading scheme 2008).
By 2020, the EU is prepared to reduce GHG emissions by 20 percent compared to 1990s levels (EU ETS: The EU‟s Innovative emission trading scheme 2008). Guidance has been drawn from the experience gained during the first trading period. Changes will include:
Instead of having 278 national caps, one EU-wide cap will prevail on the market.
The annual emission cap will decline along a trend line with the goal of having reduced emissions by 21 percent compared to 2005 levels by 2020.
Allocation of emissions allowances will be done primarily by auctioning and not by grandfathering.
EU ETS will grow; include more industries and additional gases. (EU ETS: The EU‟s Innovative emission trading scheme 2008)
Sectors not yet included in the Scheme are building, transport, agriculture and waste distribution however the aim is to reduce the emissions by each individual sector with 10 percent compared to the 2005 levels by 2020 as well. From 2012 the aviation sector will be included in the EU ETS (EU ETS: The EU‟s Innovative emission trading scheme 2008).
6 It is important for the reader to understand that there is a difference between EU ETS trading period and
the Kyoto commitment period. The first trading period within EU runs from 2005 to 2008 and the second from 2008 to 2012. It differs from the Kyoto commitment periods, with the first period running from 2008 to 2012.
7 Or as previously stated; equivalent to 8% compared to 1990s levels. 8 As of 2008 the EU consists of 27 countries.
2.2.1 EU ETS in Sweden; The grandfathering process
The Emission Trading Act (2004:1 199, Lag om handel med utsläppsrätter) and the Emissions Trading Ordinance (2004:1 205, Förordning om handeln med utsläppsrätter) govern the first emission trading period in Sweden (Naturvårdsverket 2008). Firms affected by the law have been requested to apply for an allocation of emission allowance (Naturvårdsverket 2008). Different allocation principles hold for the different firms with the Environmental Protection Agency, National Board for Industrial and Technical Development (NUTEK), but the Energy Agency holds the final decision regarding the allocation matter (Naturvårdsverket 2008). After this step the emission allowances are allocated to the different firms free of charge (Naturvårdsverket 2008).
All participants must have an account where their transactions are registered and thus the emission allowances can be accessed electronically via the Swedish Emission Trading Registry (ETR). This registry is linked to the EU electronic registry (CITL) making it easy for EU to follow the data (Naturvårdsverket 2008).
In accordance with the EU directive 2003/87/EC, all Swedish firms that are included in the trading scheme must from the first of January 2005, have a permit to emit carbon dioxide (Naturvårdsverket 2008). Without such a permit allowances cannot be allocated and firms that are affected may not conduct their operations (Naturvårdsverket 2008). To qualify for a permit the operator must monitor and report emissions in a reliable way (Naturvårdsverket 2008).
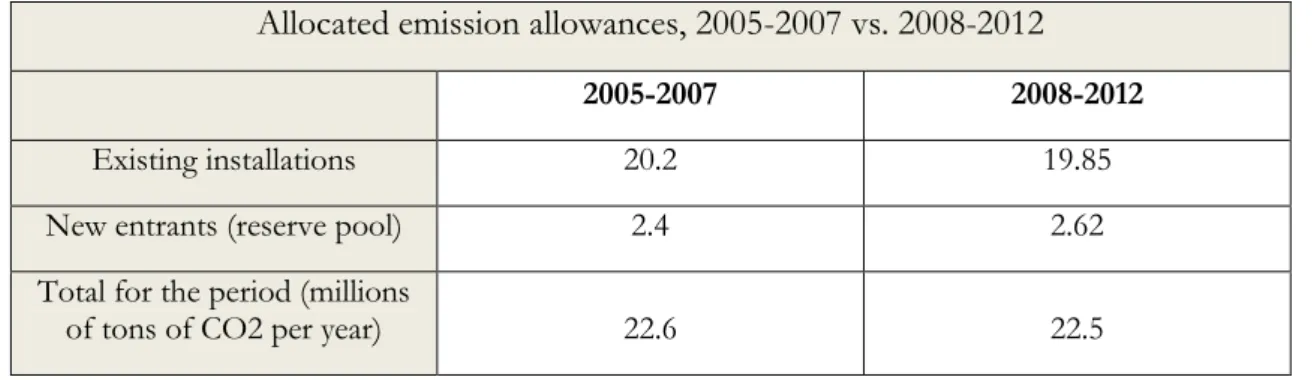
For the period of 2008-2012, the emission allowances in Sweden corresponded to 19.8 million tons of CO2, a reduction compared to the first period (2005-2007) which had 20.2 million tons allocated (Naturvårdsverket 2008).
Table 2: The allocation of allowances in Sweden during period one and two. Allocated emission allowances, 2005-2007 vs. 2008-2012
2005-2007 2008-2012
Existing installations 20.2 19.85
New entrants (reserve pool) 2.4 2.62
Total for the period (millions
of tons of CO2 per year) 22.6 22.5
The reduction from period one compared to period two can be explained by a larger amount of installations that were included in period two. Final decision on the emission allowances are made by the Swedish Environmental Protection Agency. The councils work is based on the information given by the participants themselves in their allocation plan as well as on the rules and procedures adopted by the government in its Ordinance on Emission Trading (SFS 2004:1205). Today 700 industries in Sweden are included in the EU ETS (Naturvårdsverket 2008).
2.2.2 The Auctioning process
As of today there are not many rules and regulations concerning the auctioning process as it to be developed for the EU member. The existing rules are for example that the market place has to be non-discriminatory and can therefore not cancel out any potential buyers. There should be a standardised system when it comes to the volumes auctioned as well as the times when the auction will take place (European Commission 2008b).
As mentioned earlier, only a small portion of the EU ETS allowances have been auctioned during the first trading period (2005-2007). During the recent and second trading period (2008-2012) there are more allowances up for trade even though the majority of emissions are still being given for free. 2013 will be the start of the “major” trading period. Some industries will have to trade all their emission allowances and will not receive any for free. Firms within the electricity sector will be one of the affected. From 2013 the EU ETS emission allowances will be auctioned to three interest groups namely;
1. EU ETS member countries will receive 88 percent of the allowances on the basis of how much they emitted in the period 2005-2007.
2. EU ETS members with lower GDP per capita will receive 10 percent of the allowances.
3. 9 member states that managed to lower their green house gases by 20 percent in 2005 will receive the remaining allowances.
3
Theories
This chapter is devoted to explain the chosen theories namely the theory of the Tragedy of the commons, the theory of Opportunity cost and the theory of Emission trading.
3.1 Tragedy of the commons
Many forms of natural resources are not (and cannot) be privately owned (Goodstein 2008). Since this is the situation when it comes to emission permits, free market systems will generate more pollution than what it would do under a regulated system and thus affect safety, efficiency and sustainability (Goodstein 2008). There are two reasons for this: the first one is regarding the open access problem, which can arise when natural rescores are commonly held. The second issue is regarding the public goods problem (Goodstein 2008).
3.1.1 The open access problem
The open access problem was noticed by Garret Hardin (1968). To explain his theory, Hardin used an example of a herdsman that whose cattle fed on common property. The harder would try to keep as many cattle as possible on the common property and hence it would lead to a private gain for the herder in the form of an additional animal available for sale or consumption. However it would also lead the herder to a small private loss since this additional animal would leave less to consume for the rest of the cattle. The social cost for the herder would be much larger since most of the loss from the now degraded grazing area would be borne by other herders (Hardin 1968). If the herder would act rationally he would seek to maximise his own private gain. He would do this by adding more and more cows to the grazing area and as such the idea was to be named “Tragedy of the commons” by Hardin. “Ruin is the destination towards which all men rush, each pursuing his own best interest in a society that believes in the freedom of the commons” (Hardin 1968 p. 1245). The open access problem can also be used to explain the occurrence of overfishing and why the atmosphere is polluted.
A factory owner might install an inexpensive machine in his factory that generates a considerable amount of air pollution, even though he and his family is living nearby and will be exposed to the pollution. The factory owner will gain full benefit of the pollution (the earnings from „‟inexpensive‟‟ production), while his family bears only a small portion of the total risk (Goodstein 2008).
Suppose that a kilogram of fish (cod) costs one dollar and that the marginal cost for running a vessel (including salary for the crew and fuel) is $250 per day. Given this information, the crew of the fishing boat should continue to fish as long as, on average, the catch exceeds 250 kilograms. The long run relationship between the number of vessels and their catch can be described in the figure below (Goodstein 2008).
Figure 1: The relationship between number of vessels and total catch of fish
Source: Goodstein (2008)
As it is possible to see, the maximum amount of cod captures per day is reached when using six boats. Using seven vessels and the catch level diminishes, reflecting fishing beyond a sustained yield level (Goodstein 2008). If eight vessels are being used, the return on the breeding stock becomes smaller and eventually there will be a decline in the population of fish. Using six vessels is optimal since the catch exceeds the cost. From 7 vessels and onwards the initial cost of $250 will not be covered. The example above ignores a second externality. As the table can explain, after four boats being used, the catch is being diverted from the new entrance to other boats. Having open access to the fishing waters, the individual owner to a vessel and his crew, do not recognise and do not care about these negative externalities (Goodstein 2008). As a result, boats will continue to go out even if the revenue and catch will decline in the industry in total (Goodstein 2008).
As pointed this suboptimal fishing behaviour arises because each vessel is concern solely about its cost and revenue streams with no regard to the sustainability of the fishing stock. The policy question therefore relates to how to induce each vessel to internalise its activities on the sustainability of the fish stock. One solution is to impose a Pigouvian tax on each vessel. This problem can be shown mathematically. The starting point is to note that each vessel‟s owner is interested in maximising the profit function:
max
𝑄𝑖 𝑉𝑖 = 𝑃𝑄𝑖 − 𝐶 𝑄𝑖 (1)
where 𝑉𝑖 is the profit, 𝑃 is the prevailing market price per unit of fish and 𝐶(𝑄𝑖) is the total cost of running the vessel. Hence, in absence of externality or rather from the vessel‟s perspective optimization entails
𝜕𝑉𝑖
𝜕𝑄𝑖 = 𝑃 −
𝜕𝐶(𝑄𝑖)
𝜕𝑄𝑖 = 0 (2) Thus, the individual profit maximising vessel continues to fish up to the point where the private marginal cost of harvesting an extra unit of fish is equal to the market price. Formally: 𝑃 = 𝑀𝐶 (3) In consideration of the problem above, this profit maximising rule may lead to overfishing as illustrated in Figure 1 above. Assume that the sustainable level of fishing is given by 𝑄 represented in Figure 1 as 2100. Then the constraint on all fishing vessels in the open access water is: 𝑛 𝑄𝑖 ≤ 𝑄
𝑖=1 . In other words, the sum of fish harvested by all vessels should not exceed the sustainable level of 2100. Then the profit maximising problem is
max
𝑄𝑖 𝑉𝑖 = 𝑃 𝑄𝑖− 𝐶 𝑄𝑖 (4)
subject to 𝑛 𝑄𝑖 ≤ 𝑄 𝑖=1
In a Lagrange form, this reduces to
max
𝑄𝑖 𝐿 = 𝑃 𝑄𝑖− 𝐶(𝑄𝑖) − 𝜆 𝑄𝑖− 𝑄
𝑛
𝑖=1
(5)
Optimising equation (5) with respect to 𝑄𝑖 yields: 𝜕𝐿
𝜕𝑄𝑖 = 𝑃 −
𝜕𝐶(𝑄𝑖)
Noting that 𝜕𝐶 𝑄𝑖
𝜕𝑄𝑖 =MC implies that:
𝑃 = 𝑀𝐶 + 𝜆 (7) The additional element here is the Lagrange multiplier or the Pigouvian tax, 𝜆, on fishing. Equation (7) shows that each vessel, maximising profit subject to the sustainability constraint, will harvest up to the point where the marginal cost plus the tax rate equals the unit price of fish. What the sustainability constraint or the overfishing tax does is to effectively increase the total cost of fishing such that it is in interest of each vessel to cut down fishing to a sustainable level 𝑄 or in this case 2100.
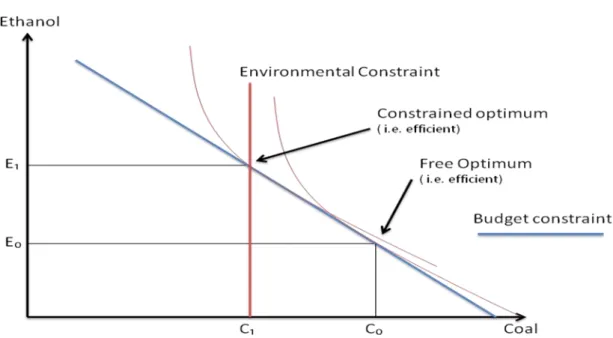
Figure 2: Efficiency
Figure 2 above further helps to explain the problem and shows where the efficient level of consumption should be. In this example either coal or ethanol can be consumed. Coal is more pollutant to the environment than ethanol. The environmental constraint shows where the limit for consuming coal is. From this level and onwards it will not be possible to uphold a sustainable environment. The optimal consumption point is at and
3.2 Game theory
As we have seen, the open access problem can demonstrate why there is a tendency for commonly held resources such as clean air and fisheries to be over exploited. One question that has been raised is why governments do not do anything about these problems?
(Goodstein 2008). The answer is because we run into something called the public goods problem (Goodstein 2008).
Public goods are goods that individuals can consume in common for example public roads. They are no excludable9. Once the roads are being build it is impossible to exclude some
people from driving on them. Under a free market system public goods can become a problem because of transaction costs and free riding. Consider a good enjoyed in common, such as clean air in Sweden. Now suppose that Finland increases its output GHGs into the atmosphere. The Swedish government could now ask the Finnish government to lower their pollution, and if not, turn to the EU and hopefully obtain a ban requiring Finland to lower their output of GHGs into the atmosphere (Goodstein 2008). Taking all these steps is known as a transaction cost and as the above given example clarifies; they can for the most parts become very high. (Goldstein 2008). However if Sweden decides to go through with all these steps, the people living there will not only benefit from this action, but the entire world. Some of the EU members countries can refuse to help Sweden and instead free ride on the government‟s action. This example explains why it is not always worth to any individual (person, industry, country) to overcome the transaction cost as there will always be someone having the possibility o free riding, even if the social benefits might far outweigh the cost (Goodstein 2008).
3.2.1 Prisoners Dilemma
As mentioned earlier, “free riding” might be a reason for nation‟s unwillingness to engage in CO2 reduction. John Von Neumann and Oscar Morgenstern (1946) developed game
theory. A famous part of the game theory is the prisoner‟s model.
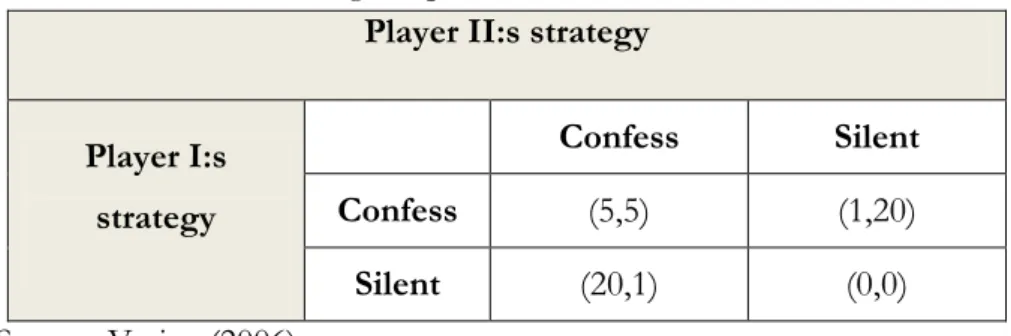
The prisoner dilemma is a game in which the best outcome will be achieved when everyone performs their best action in respect to the other players. Consider a game consisting of two players, player I and player II. They each have two options, either to confess or to stay silent. The payoff in this case is described below; the payoff is the number of years they will get in prison with respect to their actions. The best outcome will be if they both stay silent, hence they will get zero year each in prison. If one player confesses and the other is silent, the one who confesses will get one year and the one who is silent will get 20 years (Varian 2006).
Table 3: A matrix showing the prisoners dilemma
Player II:s strategy Player I:s strategy Confess Silent Confess (5,5) (1,20) Silent (20,1) (0,0) Source: Varian (2006)
Also when a game is played the different possible solutions are categorised. Shown below is the outcome from the game played above. Since the two players probably do not want to risk 20 years in prison they will both confess, hence, this will be a stable equilibrium.
Table 4: A matrix showing stable and unstable equilibrium
Player II:s strategies
Player I:s strategies Confess Silent Confess Stable equilibrium Unstable disequilibrium Silent Unstable
disequilibrium equilibrium Unstable
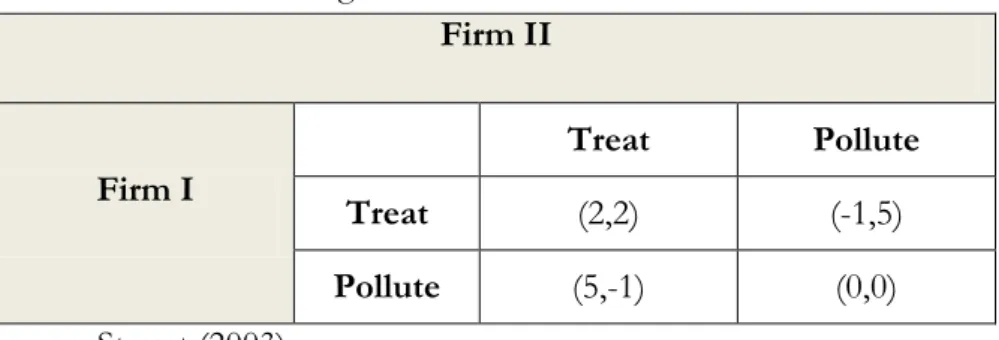
Now, consider a game in which the two participants will only interact once and thus will not be able to influence subsequent behaviour (Starret 2003). There are two firms (I, II) that are using the same lake as input for their production or to pollute. These firms are identical and their only option is to pollute the lake or to treat their waste in any other way. Their cost and benefits are (per firm): Cost of treatment: 6, Benefits from clean water: 8, Benefits if one firm pollutes: 5, Benefits if both firms pollute: 0 (Starret 2003). The firm‟s situation can be described in the matrix below.
Table 5: A matrix showing a dilemma between Firm I and Firm II Firm II Firm I Treat Pollute Treat (2,2) (-1,5) Pollute (5,-1) (0,0) Source: Starret (2003)
Firm I and Firm II have four possible combinations to make. If for example both firms treat, they will both get a benefit of 8 and pay 6 in treatment cost and thus receive 2 in net return. If Firm I treats, but firm II pollutes, they will each receive 5 in benefit but Firm I will pay a cost of 6 so the net returns are (-1, 5) (Starret 2003). In spite of what Firm I is expected do, Firm II: s desire will always be to pollute and vice versa. E.g. if firm I treats, firm II will get 5 rather than 2 by polluting and if firm I decides to pollute, the outcome will be o rather than -1 by polluting (Starret 2003).
As we can see, both firms are motivated to free ride and under no communication between the firms; the expected outcome would be for both firms to pollute. In the end both firms will reach an inefficient solution and they would both be better off if they had jointly reached a common strategy (Starret 2003). Described is below a situation of this cooperation strategy.
3.2.2 Cooperations in games
Table 6 shows the payoff table for two countries when they are not cooperating. The Nash equilibrium in this case is not the efficient outcome. Due to the fact that both countries do not cooperate, both Sweden and Finland will pollute and thus end up with €1 each as they do not want to risk ending up with €0.
Table 6: A matrix showing the payoff between Sweden and Finland.
Finland
Sweden
Not pollute Pollute
Not
Pollute (2,2) (0,3)
Pollute (3,0) (1,1)
Source: Perloff (2008)
If both countries instead choose to cooperate they have the pay off as shown in table 7. Due to the fact that they do not have the same pay off in this game the outcome becomes
more uncertain. If they do not pollute profits might be forgone and they both loose. If they on the other hand cooperate they could both receive €5 each. Given this, it would be crucial for the two firms to uphold their own part of the agreement. What happens if the agreement is not enforced? Even though they have an agreement, how do we know that one of the firms will not break it and do what they think is best?
Table 7: A matrix showing the payoff between Sweden and Finland.
Finland
Sweden
Not Pollute Pollute
Not
Pollute (2,2) (3,4)
Pollute (4,3) (5,5)
Source: Perloff (2008)
3.2.3 Iterated Game
When a game only played is once, the participants will make their choices with respect to what they believe the other player will choose. Iterated game theory is when a game is played more than once. This gives the player a chance to adapt their game to what has happened in previous rounds of that particular game. In the end, an iterated game will normally have a Pareto efficient outcome (Varian 2006).
The Nobel laureate Elinor Ostrom has researched both Tragedy of the commons and Game theory. She discusses the problem when it comes to the “commons” and how this could be solved via cooperation. In her experiments she conducts exercises where the participants interact with each other. The experiment is played over and over but the participants do not know which game will be the last. They always make their decisions with respect that there might be one more round. (The Royal Swedish Academy of Sciences 2009)
3.3 Emission trading
As previously stated; the market for emission trading is relatively new, but the topic has been discussed for a long time. Pigou (1920) suggested that the implementation of an emission fee would be one way to internalise the environmental cost of pollution into private decisions. Crocker (1966) augmented for a cap on emissions, letting the market decide the price of emissions rather than the government via an emission fee. In Weitzman‟s (1974) paper, he discussed “cap-and-trade” versus emission taxes and found them to have an equivalent effect on efficiency as long as there was no uncertainty
regarding the marginal cost of abatement. However, under the occurrence of uncertainty these two systems can differ in their efficiency output. According to Weitzman (1974), emission taxes produces higher or lower social benefits under uncertainty than a “cap-and-trade” system.
The total number of permits issued equals the emission target for a given country, region or market. Under the trade system the different firms can settle on whether to hold more permits and pursuing less emissions reduction, or by selling permits and pursuing a larger emission reduction (Burtraw & Evans 2008). Thus, firms with relatively higher marginal costs in terms of pollution are likely to compensate the firms with relatively lower marginal cost for extra emissions reductions by purchase so that together they meet the emission cap (Burtraw & Evans 2008). There is no restriction on how many permits a firm can store under a trading period. Carrying forward unused allowances to another trading period is encouraged as it promotes early reduction and improves economic efficiency (Zapfel 2005). The key outcome of this trading instrument is that the firms trading emission allowances will reach an emission reduction that equates to the marginal cost of emission reduction for all the firms under the cap system and thus reduces the cost of meeting the cap (Burtraw & Evans 2008). Trading is a lucrative approach to achieve emission targets and it requires little information of the regulator regarding compliance cost (Burtraw & Evans 2008).
3.3.1 Clean development mechanism (CDM)
Some sectors and countries emit more GHGs than others, and the cost of reduction is not the same everywhere (Clarke & Thompson 2008). One approach to confront this problem would be to start mitigation efforts wherever the emission reduction could be achieved at the least cost (Clarke & Thompson 2008).
Set up under the Kyoto protocol, this is what CDM tries to encourage (Clarke & Thompson 2008). Emission reduction at the least cost is possible to achieve through allowing firms from the developed world to meet some of their emission targets by initiating GHG reduction projects in the developing countries where the cost of emission reduction is lower (Clarke & Thompson 2008). Since CMD is market based, „‟credits‟‟ can be generated in a developing world through projects that corresponds to their emission reduction. Examples of this could be the installation of solar panels or wind power. For a project to be qualified as a CMD project, several key issues need to be fulfilled (Clarke & Thompson 2008): Approval needs to be given by the government in the developing country. Projects are done either unilateral or with funding from a party who‟s credits are
used to reduce GHG targets in a developed country. Projects are also looked at to make sure that the reduction in emissions are „‟new‟‟ and would not have occurred anyways (Clarke & Thompson 2008). To see what level of GHGs that would have been generated if the CMD project had not been performed, an emission baseline is calculated (Clarke & Thompson 2008).
Some criticism has been raised regarding the uneven distribution of CMD projects (Clarke & Thompson 2008). Brazil, China, Korea and Mexico are expected to stand for 84 percent of all CMD credits by 2012. China alone will stand for approximately 53 percent. These countries may be the main emitters; however sustainable development is needed in other geographic regions as well (Clarke & Thompson 2008).
3.3.2 Joint Implementation (JI)
Being a global pollutant, it is not relevant where the emitter of GHGs is located. For some policy makers a dilemma arises as the only regions that have committed themselves to reduce emission targets comes from the OECD member states and the eastern European countries (Michaelowa 1998). Unfortunately the developing countries, with their currently high emission intensities and low abatement cost, have not accepted such targets (Michaelowa 1998). Consequently there is a need for a system that grasps reduction opportunities in the developing world.
With the adoption of the Kyoto protocol in 1997, the Annex B countries were assigned a certain amount of permits for the first commitment period 2008-2012. They can use and transfer these assigned amounts to or from other Annex I countries (Van der Gaast 2002).
Since the cost of GHG reduction is lower in some countries than in others (e.g. lower in central Europe than in Western Europe) the Annex B parties are considered to be well suited for JI projects under the Kyoto Protocol(Van der Gaast 2002).
Thus the efficiency of a national climate policy can be increased if the marginal cost of reduction is lower abroad and for that reason governments‟ emission reduction abroad could be used to reach national emission targets (Michaelowa 1998). The outcome for the developing country would be that it takes advantage of new technology and foreign investment while both the developed and the developing parties will meet their Kyoto commitments on a cost-effective way (Van der Gaast 2002).
Whether a government will rely on a command and control mechanism, use an incentive-based approach, or any other instrument to reduce GHG emissions will not matter if no
other country will do the same (Goodstein 2008). Global warming is a global problem and requires a joint solution. Emission reduction can be described as a public good, a good that is consumed in common. If Sweden cuts back on CO2 emissions by 30 percent, the
whole world would benefit from their action. Thus any country would desire to see Sweden lower their emissions and then “free ride” on its action. With every country being in a “free riding‟‟ position they will have a great incentive to cheat. The above given example is considered to be a reason why many nations are unwilling to engage emission reduction. The fear that other countries will not comply is too large (Goodstein 2008).
3.4 Opportunity cost
Opportunity cost is a measurement that economists use. It can be described as “the value of a resource in their next best available use” (Goodstein 2008, p. 170). An example of this would be the introduction of pollution control (e.g. a smog law) that would cost $2 billion annually (Starret 2003). By not investing $2 billion annually on this law, society could have spent this money on other goods and services and thus this is an example of opportunity cost (Goodstein 2008). Another example would be that of taxes and free permits (e.g. grandfathering) in pollution control. Taxes and permits both sets a price on the emissions so if a firm pollutes it will come at a cost. Using taxes as pollution control, this would mean that less taxes equals less pollution. Using on the other hand free distribution of permits, pollution would now be treated as an opportunity cost because a decrease of the pollution would yield more permits for sale in the market (Goodstein 2008).
4
Quantitative Findings in Previous Studies
The aim of this chapter is to explain our findings regarding the auctioning vs. grandfathering debate. A greater part of our findings regarding this debate is based on the information given in Frank Converys (2009) paper „‟Reflections-The emerging literature on emission trading in Europe‟‟. The purpose of his paper was to identify the most interesting and most useful work in the emission literature so far. He surveys fifty-two researchers within the emissions trading field and especially those that were active in the field or/and contributed to the European Association of Environmental and Resource Economist (EAERE) annual meeting in Gothenburg, Sweden in 2008 (Convery 2009, p 122). Each researcher was asked to list published materials within the field of emission trading that they found to be of particular value. Below is the most recognised work analysed with regards to the auctioning versus grandfathering problem.
4.1 Auctioning vs. Grandfathering on prices
In their work; Tradable carbon permits auctions: How and why to auction and not to grandfather, Cramton and Kerr (2002) discuss the most efficient way to meet carbon targets. According to them grandfathering should not be used as it gives the energy companies all the scarcity rents in the market and thus creates windfall profits to the owners. Instead government should engage in auctioning of the permits because the permits will go to those who are in need of them and because government would get the scarcity rents instead of the energy companies (Cramton & Kerr 2002). Consequently these revenues created from auctioning could be used by governments to reduce distortionary taxes.
Cramton & Kerr further discusses the different allocation methods and mentions that auctioning would become a highly efficient system if the government would sell the permits in periods. The earnings gathered from these auctions could be refunded to the citizens via tax cuts. This form of revenue recycling could therefore be seen as a system where the polluters end up buying the right to pollute from the public (Cramton & Kerr 2002 p.2). Using USA as an example they conclude that the government could miss out on a potential profit of $134 billion annually by grandfathering the allowances. By 2010 the targets is to distribute 1.340 million tons of permits and the marginal cost of these targets will range from $25 to $150.3. With a permit price of $100 per ton, the US government could raise as much as $134 annually, equivalent of 2 % of 1995 GNP (Cramton & Kerr 2002 p.2). By capping the market as emission trading does, it creates a relatively high price
on the emission permits due to scarce supply. Hence if the permits are allocated for free via grandfathering, the consumers will still end up paying for the higher prices (Cramton and Kerr 2002). An example of this occurred in the 1980s cellular industry (Cramton and Kerr 2002). The Federal Communication Commission gave cellular licenses for free to the different participants. This did not generate lower prices for the customers; the prices remained at the same level. Today the FCC is auctioning out these cellular licenses and the result has been a downward trend on the price as the winners of the auction enters the market (Cramton & Kerr 2002 p.2).
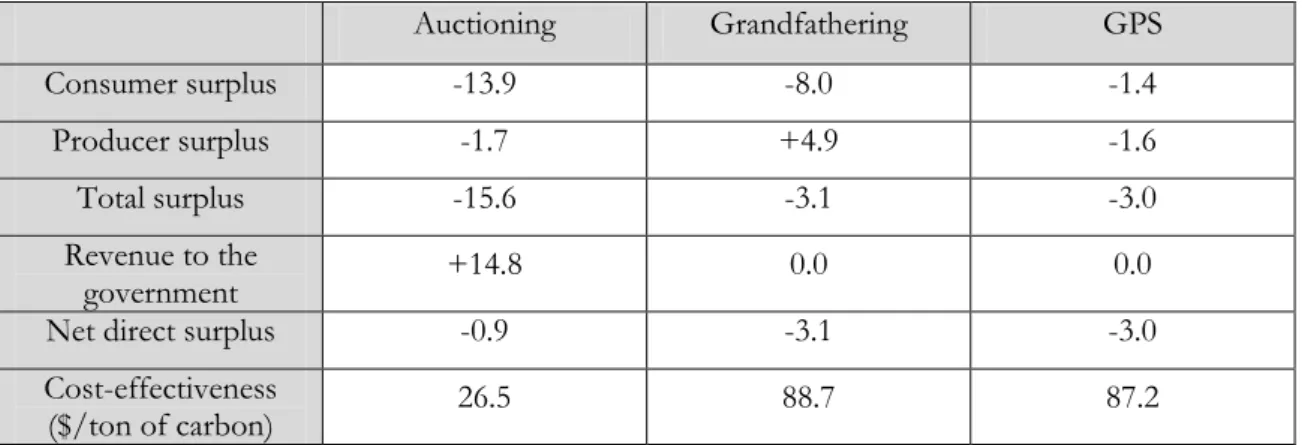
Considering the cost-effectiveness and distributional impacts in the electricity sector, Burtraw, Palmer, Bharvikar and Paul (2001), discusses which system is more suited; auctioning, grandfathering or generation performance standards (GPS). Burtraws et al's (2001) main finding is that auctioning is more cost effective than grandfathering but just as cost effective as GPS. They base their results on how the different allocation methods affect the electricity price. Even though generation performance standards might not increase electricity price much, it still increases the economic cost significantly. Auctioning on the other hand does increase the electricity prices more than both grandfathering and GPS, but it is also the single allocation method that causes the smallest change in efficiency cost. This can be seen in table 8. Looking at grandfathering, producers are better off than under a GPS or auctioning-system but it also makes the consumer worse off as can be seen in the table below.
Table 8: Change in economic surplus and cost-effectiveness of policies in 2012. (Billion 1997 $; 35 million mtC reduction) Auctioning Grandfathering GPS Consumer surplus -13.9 -8.0 -1.4 Producer surplus -1.7 +4.9 -1.6 Total surplus -15.6 -3.1 -3.0 Revenue to the government +14.8 0.0 0.0
Net direct surplus -0.9 -3.1 -3.0
Cost-effectiveness
($/ton of carbon) 26.5 88.7 87.2
Source: Burtraw et al (2001), p. 39
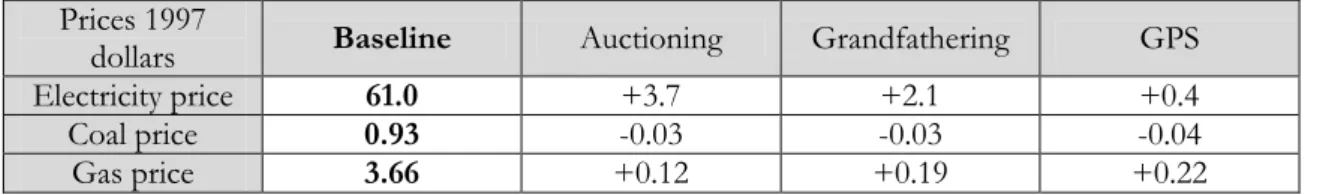
Basing an allocation system to 100 percent on auctioning would increase the electricity prices most but it would also give the lowest gas prices. On contrary GPS would increase
gas prices most but also have the least effect on electricity prices. Grandfathering would be in between in both cases. This is seen in table 9.
Table 9: Electricity price, fuel prices, and carbon emission allowance price in 2012 (35 million mtC reduction).
Prices 1997
dollars Baseline Auctioning Grandfathering GPS
Electricity price 61.0 +3.7 +2.1 +0.4
Coal price 0.93 -0.03 -0.03 -0.04
Gas price 3.66 +0.12 +0.19 +0.22
Source: Source: Burtraw et al (2001), p. 36
Woerdman, Couwenberg and Netjes (2007) also reflect over the electricity sector and its prices. They ask the question: “should energy consumers pay for the allowances that the energy producers obtain for free”? (Woerdman, Couwenberg & Netjes 2007 p. 5). To answer this question they incorporate opportunity cost in their reasoning. When receiving the permits for free, the energy firms have the possibility to sell them instead of using them. By selling its electricity the producers wants to recover their forgone opportunity and can do so via the price. Because the emission market puts a price on the remaining emissions, the permits can no longer be seen as free (Woerdman, Couwenberg & Netjes 2007). “Consuming the right to emit when producing output is a cost to the firm. If producers are to be motivated not to sell those rights, then the proceeds of such a sale need to be compensated via the energy prices” (Woerdman, Couwenberg & Netjes 2007 p. 5).
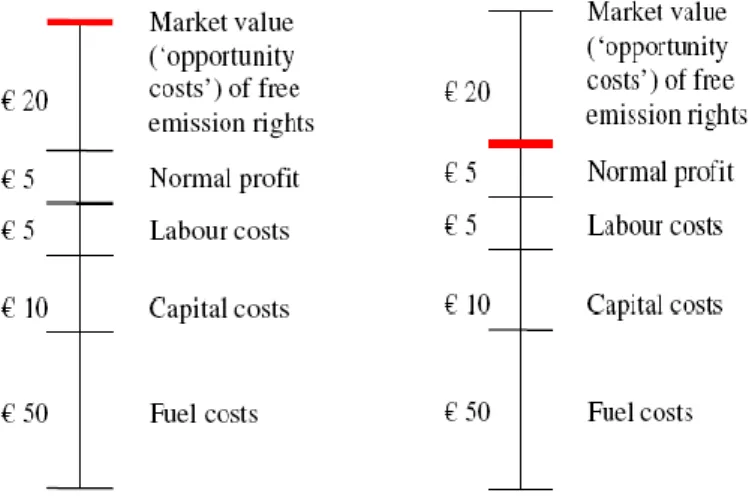
A unit of electricity costs $65. Incorporated in the price is $50 for the fuel cost, $10 for the capital cost and $5 for the labour cost. $5 is considered to be the profit. Hence in equilibrium the price becomes $70 or a unit of electricity. Immediately when introduced on the market value of an allowance is added to the price. With a mark-up price of $20 the price for the unit of electricity becomes $90. Consequently this mark-up is passed on to the consumer. It is passed on because the electricity producer could have sold them. When the producer keeps emission rights he or she must bring in revenue lost (by not selling the permits) via the electricity price (Woerdman, Couwenberg & Netjes 2007).
Figure 3: Electricity price with and without opportunity cost
Source: Woerdman, Couwenberg & Netjes (2007) p. 23
The figures above show that the electricity producers are making a profit of $25 per emission permit sold. This profit is made out one part consisting of a $20 opportunity cost and a $5 profit (Woerdman, Couwenberg & Netjes 2007).
4.2 Auctioning vs. Grandfathering and the allocation of
allowances
Hepburn, Grubb, Neuhoff, Matthews and Tse (2006) discuss the benefits of auctioning vs. grandfathering on the EU ETS. They try to determine which mechanism is more suited when compared under:
Economic efficiency, revenue recycling and the relationship with eco-taxation Rent distribution and equity consideration
Competitiveness effects Legal considerations
Reducing distortions and perverse dynamic incentives, Transaction costs of allocation processes
Source: Hepburn et al (2006)
Hepburn et al (2006) comes to the conclusion that auctioning is superior to grandfathering in all aspects. The researchers conclude that auctioning is likely to increase the macroeconomic efficiency of the EU ETS and that it will have a small impact on competitiveness. Auctioning will also reduce distortions arising when using free allocation, and is better suited for the EU State aid legislation than grandfathering. Hepburn et al
(2006) do acknowledge that free allocation is a subsidy that can help companies maintain a solid balance sheet when being confronted with higher operating costs. It gives the companies a possibility to protect their market share by under-pricing (Hepburn et al 2006). Given this, the conclusion is that grandfathering can act as a temporary subsidy to support firm‟s balance sheets (Hepburn et al 2006). Hepburn et al also argues that auctioning has an administrative and a transactional cost and thus the implementation efficiency of the EU ETS may depend upon the design of the auctions.
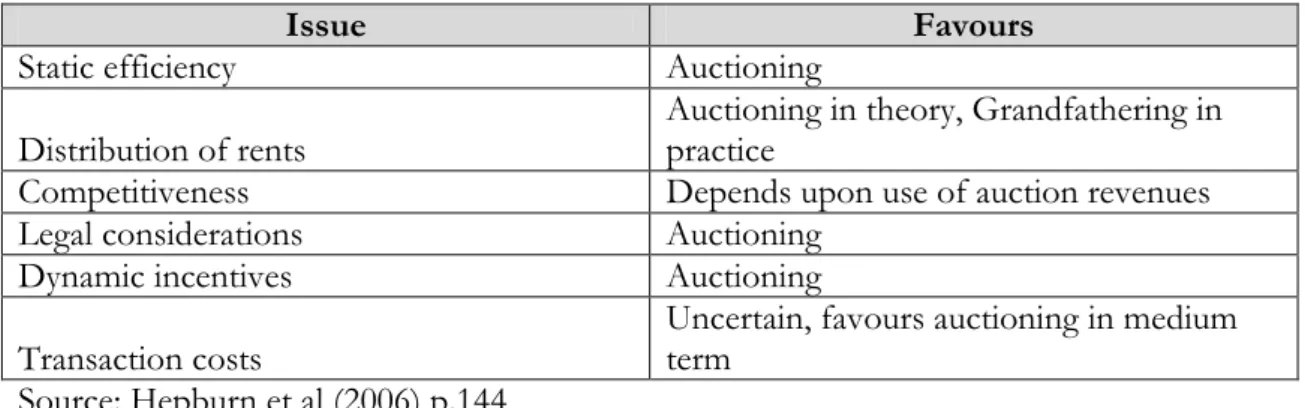
Table 10: Summary of issues10
Issue Favours
Static efficiency Auctioning
Distribution of rents
Auctioning in theory, Grandfathering in practice
Competitiveness Depends upon use of auction revenues
Legal considerations Auctioning
Dynamic incentives Auctioning
Transaction costs Uncertain, favours auctioning in medium term Source: Hepburn et al (2006) p.144
Hepburn et al further discusses their findings with respect to auctioning. They conclude that when using auctioning management‟s attention to CO2 will probably increase if the
permits are auctioned out rather than given away for free and this will probably help to increase market efficiency. Auctioning may also offer comfort against price volatility and projections uncertainties (Hepburn et al 2006. P. 138). The researchers also see auctioning as a good allocation method as it will help to protect industrial competitiveness in the long run. When using grandfathering there is a possibility for lobbying activities by the firms that receives the permits for free (Cramton & Kerr 2002).
A summary of findings can be viewed in appendix 1.
5
Analysis
Here we have chosen to analyse our findings. Our analysis is divided into two parts; the first part relates to the effect on prices and the second part to the effect on allocation.
5.1 Auctioning vs. Grandfathering on prices
Both Cremton and Kerr (2002); and Woerdman, Couwenberg and Netjes (2007) favours auctioning when looking at the energy prices. Cramton and Kerr (2002) brings up that the price of energy will most likely increase for the consumers if the permits are allocated via grandfathering to energy producers. They indicate that by using a system that is capping the market, just as EU ETS does, the permits will become higher priced due to scarce supply. This is further supported in the example they give of the 1980‟s cellular industry. At first the participant were given cellular license for free by the FCC. As it turned out this did not generate lower prices for the consumers but prices remained at the same level. However when the FCC started to auction out licenses a downward trend was seen in prices. Woerdman, Couwenberg and Netjes (2007) also support the idea that energy prices will most likely increase when one is using a system entirely based on grandfathering. When a firm is given their permits for free they stand with the option to sell their permits instead of using them. As mention by Cramton and Kerr (2002), the EU caps the market and thus the allowance becomes valuable assets. Therefore it becomes costly for a firm to produce their products and must be compensated. This can be done through energy prices. Burtraw et al (2001) finds that there is a relationship between grandfathering and an increase in electricity prices. When using a system that is entirely based on grandfathering prices tend to increase for both electricity and gas. However there is a larger increase in the price of electricity when using auctioning and there is a higher price increase for gas when using GPS. But there still is an increase in price for gas and electricity when using grandfathering and the economic cost is higher when using grandfathering than auctioning or GPS. It seems interesting that Burtraw et al (2001) finds auctioning to increase electricity prices more than under the use of grandfathering. This is opposite to what has been found by the other authors.
As been shown, auctioning is favoured over grandfathering when compared to energy prices. A reason could be opportunity cost which is also mentioned by Woerdman, Couwenberg and Netjes (2007). When firms are given permits for free they receive a valuable asset, an asset which value will depend on how much permits are on sale in the market. When receiving the permits, each firm under EU ETS has the option to sell these
permits if they have a surplus or to buy more if they have a deficit. Thus a firm cannot be producing at the same time as it is selling its permits, but rather the firm must make a choice. If a firm is producing a product it is considering that to be of most value. And hence to sell the permits is considered to be the next best thing. So if the firms want to collect the funds they miss out on by producing their product instead of selling permits, they can so do via the price of the product. Therefore the higher are due to grandfathering according to Cremton (2002) and Kerr; Burtraw et al (2001) and Woerdman, Couwenberg and Netjes (2007) can be related to the opportunity cost. We believe it is interesting that the above mentioned researches find grandfathering to be the allocation system that increases energy prices most. According to us the price of the emission permits should not be different (at least not significantly different) weather they are grandfathered or auctioned. As EU cap the emission market, less permits will be available for the total market meaning that the demand for permits will increase and as a consequence the price as well. The increase in price can be related to the cap and thus most be seen as independent whether or not the permits are allocated via grandfathering or auctioning. If firms are grandfathered the permits, we agree and clearly see that since they are free (and thus comes with a value), firms would like to be compensated if they are to use them. Hence they will according to Woerdman, Couwenberg and Netjes (2007) incorporate the opportunity cost. But the opportunity cost cannot be higher than the price of the permits and as such the price for the emission permits would be the same as the prevailing market price when using grandfathering. If we instead choose a system where the permits are auctioned, the price of the permits will be determined by the market (supply and demand) and since the market is capped, the price for the permits would according to us, be the same whether or not they are grandfathered or auctioned.
5.2 Auctioning vs. Grandfathering on the distribution
When it comes to the allocation of allowances, there are different views on the benefits a system entirely based on auctioning would have as well as a system entirely based on grandfathering. Cramton and Kerr (2002) favour auctioning since it is an allocation method that does not give rise to unexpected profits which grandfathering does. Since the permits comes with a value, firms in the energy sector will most likely try to obtain as many permits as possible. The example given shows that a situation in which auctioning is used would, in the optimal situation, yield a potential profit worth $134 billion annually. Thus by auctioning the government could use these funds on other activities such as tax cuts. Burtraw et al (2001) also support the idea that grandfathering creates distortionary taxes