J
Ö N K Ö P I N GI
N T E R N A T I O N A LB
U S I N E S SS
C H O O LJÖNKÖPI NG UNIVER SITY
B a n k i n g S e c t o r R e f o r m
a n d
E c o n o m i c G r o w t h
Case study of the South Korean banking sector reform
Paper within subject: Bachelor thesis within economics Author: Miao Yu & Chenshuang Liu
Tutor: Åke E. Andersson & Sara Johansson Jönköping, September, 2007
Abstract
South Korea experienced a financial crisis in 1997 after more than 30 years of fast eco-nomic growth. During the crisis its gross domestic product (GDP) decreased sharply and many enterprises went bankrupt. The stated-owned banks in South Korea suffered huge losses and investors lost confidence in investing in the South Korean financial market. One result of the crisis reveals the weakness of the South Korean economy- government intervention in the banking sector.
This paper provides the reason for the financial crisis in 1997 in the introduction sec-tion. The following section is a theoretical framework, in which we have presented two macroeconomic models: the Solow model-growth accounting formula and the Ricardo-Viner model. With empirical findings, we show how the South Korean government re-sponded after the crisis with three approaches to banking reform. We include the two macroeconomic models in the analysis of how the three approaches affected the eco-nomic growth in South Korea during the reform process in the analysis section. Finally, we conclude that the South Korean banking sector reform has provided a success and briefly discuss how China should implement the South Korean useful experiences into its ongoing process of banking sector reform.
Table of Contents
Abstract ... i
Abbreviation... 1
Figures and Tables ... 2
1
Introduction... 3
1.1 Background to reform ...4
1.2 Previous studies ...5
2
Theoretical Frameworks... 7
2.1 Solow model – The growth accounting formula...7
2.2 Ricardo - Viner Model...10
3
Three approaches in the reform ... 13
3.1 Public funds injection relocates capital investments ...13
3.1.1 Capital investments to conglomerates and other firms in South Korea before the crisis ...13
3.1.2 The NPLs coursed by the capital misallocation ...15
3.1.3 Public funds injection improves NPLs and relocates capital investments ...16
3.2 Increase of FDI in the banking sector after the reform...18
3.2.1 South Korean banking sector allowed FDI entry ...18
3.2.2 Changes in the South Korean banking sector brought by FDI entry 19 3.3 Restructuring and the productivity of the South Korean banking sector 20 3.3.1 Financial Supervisory Commission (FSC) ...20
3.3.2 Mergers and Acquisitions (M&A) ...21
3.3.3 Downsize employees and reorganization of managing board ...22
4
Analysis ... 24
4.1 Relating to the Ricardo-Viner model before the banking reform ...24
4.2 Relating to the Ricardo-Viner model after the banking reform...25
4.3 Increase of banking sector FDI stimulates overall FDI ...26
4.4 Improvement of productivity led to reduction of cost of loans ...27
4.5 Increase in total investments and real GDP ...28
5
Conclusion ... 30
Abbreviation
BOK = Bank of Korea
CAR = Capital adequacy ratio FDI = Foreign direct investment
FSC = Financial Supervisory Commission GDP = Gross domestic product
H&C = Housing & Commercial Bank IMF = International Monetary Fund KB = Kookmin Bank
KEB = Korea Exchange Bank KFB = Korea First Bank KRW = Korean Won
M&A = Mergers and Acquisitions MPK = Marginal product of capital NPL = Non-performing loan
ROA = Returns on assets SB = Shinhan Bank
SMEs = Small and medium enterprises WB = Woori Bank
Figures and Tables
Figure 1, Diagram of the Solow model Figure 2, An economy’s product function
Figure 3, Causes and effect of banking capital investment mobility
Figure 4, Proportion changes of bank loans for conglomerates and other firms (1994-1997)
Figure 5, Comparison of ROAs between the top 30 conglomerates and other firms (1993-1997)
Figure 6, Comparison in debt/equity ratio of the top 30 conglomerates and other firms (1993-1997)
Figure 7, Proportion changes of bank loans for conglomerates and other firms (1998-2004)
Figure 8, The trend in debt/equity ratio of top five conglomerates in average (Unit: %) Figure 9, South Korean banking capital investment mobility before and after the reform Figure 10, Average ROA index of the South Korean banks (1996-2002, unit: %) Figure 11, Combination of banking sector FDI and overall FDI
Figure 12, Changes of South Korean outstanding credit of private households in percent of GDP (1995-2005, unite: %)
Figure 13, Comparison of changes of real GDP and total investment (unit: %)
Table 1, ROAs of the top five conglomerates (unit: %)
Table 2, The banks’ ROAs and ratio of NPLs in South Korea (1991-1997, unit: %) Table 3, The ratio of NPLs during the South Korean banking sector reform (1998-2001) Table 4, Foreign ownership changes in South Korean domestic Banks (1997 & 2003, unit: %)
Table 5, CARs of 24 major South Korean banks at the end of 1997
Table 6, Changes in the Number of national banks (Jan. 1998 ~ Dec. 2002)
Table 7, The changes in South Korean banks’ employees, branches and net income over 1997
Table 8, Changes of South Korean banks’ productivity through restructuring reform (1997-2002, unit: 1billion KRW, %)
1 Introduction
During the process of economic growth in South Korea in the last 40 years conglomer-ates played a major role in its economy. Conglomerconglomer-ates are business groups which are controlled by large South Korean families. They are also government-assisted corporate groups. The economic policy of centrally managed resource allocation at that time in South Korea allowed the government to distribute freely capital support to conglomer-ates. The justification for sustaining conglomerates was that the government believed that large-scale investments were necessary to achieve economies of scale. The gov-ernment did not, however, pay the same attention to other firms which were not con-glomerates. During this period, these other firms had hard restrictions on taking loans from state-owned banks, though they had better business performance compared to conglomerates. The channel of distributing capital investments was through state-owned banks, which indicates that the government could intervene in the financial market and allocate capital to firms which were favored by the government, even though these pro-vided a lower return on assets (ROA). The excessive investments with low ROA had undermined the economy’s efficiency and brought losses to state-owned banks in South Korea. The South Korean government’s intervention in the banking sector finally be-came one of the major reasons for the 1997 financial crisis. After the financial crisis, the government recognized that it had played a crucial part in the huge losses in the banking sector; which explains the banking sector reform in 1998, in order to achieve a rapid economy recovery from the crisis.
In this paper, we want to discuss whether the South Korean banking sector reform has enjoyed a positive influence on its economic growth after the financial crisis in 1997 with the assistance of macroeconomic theories.
We will first introduce the background to the banking reform; secondly, we state two selected macroeconomic theories: the Solow model-growth accounting formula and the Ricardo-Viner model; thirdly, we will explain the three approaches to the banking re-form in South Korea, which are the public funds injection, foreign direct investment (FDI) in domestic banks and the restructuring of state-owned banks. The subsequent discussion will be an analysis of how these three approaches improved banks’ profit-ability and productivity related to the two theories, hence stimulating economic growth in South Korea after the crisis. For the approach of the public funds injection by the government, we are going to relate it to the Richardo-Viner Model and analyze how the government adjusted the misallocation of capital investments. After the capital invest-ments have been reallocated efficiently during the reform, we use the Ricardo-Viner Model again to analyze how the capital reallocation had a positive effect on the capital share in South Korea. Concerning the approach of FDI in domestic banks, we will dis-cuss how the increase in banking sector FDI has stimulated the total FDI. Regarding the approach of the banking sector restructuring, we will argue that it has improved the productivity so as to reduce the cost of lending, hence to increase national investment as a whole. Combining the two results from the approaches of FDI in domestic banks and the banking sector restructuring, we include the Solow model - Growth accounting for-mula to show that increases in the total FDI and national investment enhance capital growth in South Korea. Finally we conclude that because of increases both in capital share and capital growth, there is a positive growth in the total output according to the Solow model - growth accounting formula, which means that the banking sector reform has stimulated the South Korea economy. In the concluding section, we will discuss
briefly the successful experiences of the South Korean banking sector reform and refer to the ongoing process of the Chinese banking reform during the accession to the World Trade Organization (WTO) accession.
1.1 Background to reform
South Korea is an example of a successful transition from a traditional to a modern economy. Its government started an economic reform in the 1960s by means of indus-trial policies which enabled its economy to have a high growth rate through out more than 30 years. The sustained high economic growth in South Korea was mainly based on a bank-oriented financial system to support its national industries’ development. The core of the system was a highly centralized government and nationalized banks. The government had the right to intervene in the banking activities by allocating capital to the firms which were favored by the government but normally with low or even nega-tive ROA. The banking sector was not well developed due to inadequate transparency and market principles ignored during the period of economic reform (Borensztein and Lee, 1999).
During the period from the 1960s to the middle of the 1990s, the South Korean gov-ernment concentrated on building up heavy industries as the strategy for economic growth. The five major industries included shipbuilding, semiconductors, steel, cars and petrochemicals. As a result, 30 chaebols1 conglomerates were established, which han-dled more than 75% of all economic activities in South Korea. There were extremely strong insider relationships among banks, conglomerates and the government. In other words, most of the conglomerates were favored in receiving loans from the state-owned banks (Fukawa, 1997).
The purpose of supporting those conglomerates was that the government favored large firms and believed large-scale investment was necessary to achieve economies of scale (Kwon and Shepherd, 2001). In its “1993-97 Financial Sector Reform Plan,” the gov-ernment gave more and more freedom to state-owned banks in setting interest rates and allocating their loans. Under the “plan”, the government supported those conglomerates by allocating capital to them with a lower interest rate, or even a negative interest rate. For instance, in 1965, the government used the indirect credit control system to supply funds to those conglomerates. Basically, the indirect finance system referred to state-owned banks. Some banks lent up to 45% of their capital to a single conglomerate, compared with normal limits of 15-25%. Some banks were even more egregious and lent up to 300% of their capital to one chaebol group (Korea Economic Update, 1998). Therefore, these conglomerates usually had an abundance of capital for business opera-tions, but unfortunately they had a lack of adequate transparency for the usage of capi-tal. As a result, they were not profitable in the1990s. Furthermore, the over investment to less profitable conglomerates undermined the economic efficiency and flexibility. The deficient loans led to an accumulation of large numbers of NPLs in state-owned banks. Unfortunately, the government always had to make up for the losses, because it feared that the losses might threaten the stability of the South Korean banking system (Duck and Barry, 2002). In order to avoid bankruptcies of conglomerates, the
ment directed state-owned banks to provide rescue loans, and the central bank provided subsidized re-discounts to the banks. Under the protection provided by the government, and with the lack of prudent regulation, state-owned banks’ lending to conglomerates continued to be aggressive, which increased by 17% annually between 1990 and 1996 and was much higher than South Korea’s nominal GDP growth rate (Kataoka, 1999). This produced considerable potential risk and also led to ‘financial repression,’ which was reflected in the low ROA on bank assets, a rate which is among the lowest in emerging economies (Noland, 1996).
When the economy became sluggish and several conglomerates suffered bankruptcy in 1997, South Korean banks fell into serious trouble. Ten of South Korea’s 26 state-owned banks claimed losses in the middle of 1997. By the end of October 1997, the to-tal amount of NPLs held by state-owned banks was 51% of their toto-tal loans.The finan-cial crisis erupted at the beginning of November 1997 and the South Korean govern-ment decided to rehabilitate banks and revitalize the banking system through a reform (Kataoka, 1999).
1.2 Previous studies
Chung and Eichengreen (2002) pointed out that economic growth in South Korea from the 1960s through the mid-1990s was based on the approach of centrally managed re-source allocation made by its government. The rere-sources were mainly allocated to the enterprises which were favored by the government. This accelerated growth was at the cost of distortions in the long run. At first, over-investment to the government-favored firms led to overcapacity, which destroyed the economy’s efficiency. On the other hand, deficient loans in the banking sector led to the accumulation of large numbers of NPLs. An inefficient and inflexible economy could easily collapse into a crisis.
O. Yul Kwon and William Shepherd (2001) also claimed that the South Korean banking sector has long been criticized for its inefficiency due to government intervention. It was the main cause of the financial crisis in 1997. Fortunately, the South Korean gov-ernment clearly recognized this and launched its banking reform immediately. One of the approaches of banking reform is public funds injection, which is defined as fiscal support to dispose of banks’ NPLs. The government provided financial aid to purchase NPLs in order to compensate for the banks’ losses. The other two approaches are FDI entry to domestic banks and banking sector restructuring. Banking sector restructuring was mentioned as the most pressing task for South Korea when confronted by the crisis. The government’s first move was to rebuild financial institutions based on market prin-ciples in order to minimize the taxpayers’ burden. Other measures have also been im-plemented for restructuring. The government pressed for bank mergers, and consoli-dated various supervisory agencies into a financial supervisory commission (FSC). The main tasks for FSC are to prohibit the holding of risk assets and to order the restoration of depleted capital. Furthermore, the labor forces in the banking sector have been re-duced in order to improve efficiency and competitiveness. The conclusion was an in-crease in productivity since restructuring.
From previous studies of FDI into banking sector focusing on transition economies, there is much evidence to show that foreign penetration increases economic growth by enlarging capital accumulation due to enhancing efficiency and the stability of the do-mestic banking system, and also by putting competitive pressure on dodo-mestic banks.
The paper written by Calomiris (2000) connecting the banking reform before and after the recession in Argentina concluded that FDI makes a significantly structural change in the domestic banking system, which helped the Argentine economy overcome its reces-sion and grow further. By the year 2000, there were 60% of private sector deposits in banks with a foreign controlling share in Argentina. He emphasized that FDI has creased the competition within the Argentine banking sector. Foreign banks provide in-centives to improve auditing, accounting, and rating institutions. FDI reduces the size of the external finance premium because of lower barriers, which helps the foreign banks to develop the implementation of the Argentine banking sector with their positive im-pacts on quality, pricing and availability of banking services.
Bayraktar and Wang (2006) investigated the direct and indirect factors of foreign banks’ entry in influencing economic growth. They found that the direct factor is the asset share of foreign banks, which has a significant positive effect on the growth rate of GDP per capita, and the indirect factor is the level of financial sector openness. The re-search showed that a higher share of foreign banks results in lower overhead costs and net interest margins, which means a higher efficiency, hence leading to economic growth. They concluded firstly that foreign banks which reduce the cost of borrowing by offering higher quality financial services may directly stimulate economic growth domestically due to a higher level of FDI; and, secondly, if foreign bank entry increases the efficiency and competitiveness of domestic banks, it may increase economic growth indirectly. As to domestic financial intermediaries, they are expected to improve their operations thanks to competition and the instructive nature of better financial environ-ment.
2 Theoretical Frameworks
2.1 Solow model – The growth accounting formula
The Solow model is a model of economic growth initially contributed by MIT's Robert Solow in the 1950s. The model assumes that GDP is produced according to an aggre-gate production function technology. Opening up a national financial market draws ad-ditional domestic and foreign investment, which leads to an increase in the rate of capi-tal accumulation and GDP growth. Economic growth results from an increase in labor quantity and quality (by population growth and education), an increase in capital (by savings and investment) and an improvement in technology (Todaro & Smith 2006). In this paper, we focus on the production function taken from the Cobb-Douglas form (Wicksell, 1954). Although it is relatively simple, it contains a few very useful insights into the dynamics of economic growth.
Y=AKθ
N (1-θ) (0< θ<1) (1)
In the equation, Y is the gross domestic product, K is the stock of capital (human capital and physical capital), N is labor, A is the productivity of labor and θ is the elasticity of the output with respect to capital.
In the Solow model, there are a few major assumptions:
• Factors of production, i.e. labor and capital, are allowed to be interchanged be-tween each other.
• Capital-output and capital-labor ratios are not fixed. • There are diminishing returns with the use of these inputs
Assuming the production function: y = f (k)
y represents Y/N and k represents K/N. The slope of this equation reflects the assump-tion of diminishing marginal returns to capital.
Assuming the saving per worker’s function: S=sy
S represents savings and s is a coefficient. The Solow model can be reformed as: ∆k=sy-(n+d)k
∆k represents the change in capital per worker; n represents ∆N/N, which is the labor growth rate; d represents the percent depreciation of the capital stock.
One can tell that the change in capital per worker is determined by three things: 1. It’s positively related to saving per worker
2. It’s negatively related to labor growth. 3. Depreciation erodes the capital stock.
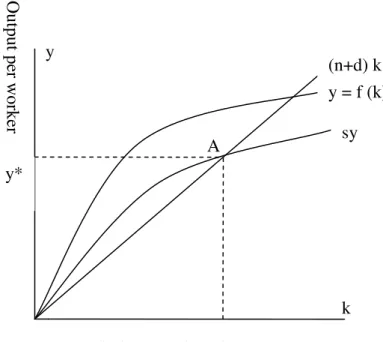
Figure 1, Diagram of the Solow model
From Figure 1, the vertical difference between the curves sy and (n+d) k represents the change in capital per worker; the two curves intersect at point A, which is named the steady state (long run or potential level of output per worker) of the Solow model. At the steady state A, output is growing at the rate of n but output per worker is constant. Equation (1) can be rewritten as:
log(Y) = log (Kθ
AN1-θ)
= log (A) + log (Kθ
) + log(N1-θ)
= log (A)+ θ log (K)+ (1- θ) log (N) (2)
Now taking the derivative of equation (2), we get the required formula: ∆Y/Y = (1-θ) ×∆N/N+θ×∆K/K+∆A/A (3)
In the equation (3), ∆Y/Y is the output growth rate, θ is the capital share, 1-θ is the labor share, ∆N/N is the labor growth rate, ∆K/K is the capital growth rate and ∆A/A is the rate of technical progress.
There are three factors behind an output growth: • Technological progress
For instance,
1. Larger quantities of output for given quantities of inputs, (e.g. a new oil production that allows a machine to operate at a higher speed). 2. Better products, (e.g. steady improvements in flight safety). 3. New products, (e.g. invention of mobile phones or computers).
A y
k Capital per worker
(n+d) k y = f (k) sy k* y* O ut put pe r w or ke r
4. Improvements in human capital, (e.g. introducing a foreign advanced managing training program for domestic enterprises).
• Capital deepening, (i.e. increases in capital per worker). • Labor widening, (i.e. increases in labor force).
The Growth Accounting Formula considers more broadly about how growth rates are determined and recognizes the roles of labor, capital and technology in economic growth (with N and K weighed by their importance in production). Economic growth requires policies that encourage saving and investment and generate technological advances, which improves productivity of capital (Harrod, 1948 & Domar, 1957). This paper concentrates mainly on how reforms in the banking sector contribute to eco-nomic growth. Only capital factors will be in focus in this paper, because banks have the duty to manage all the capital transactions between borrowers and lenders. The rea-son for ignoring the labor factor and technology factor is that the banking industry does not have very much influence on these two factors.
After the crisis, the South Korean economy started to recover from the tough economic situation, meanwhile consumers’ disposable incomes gradually increased. As we all know, in financial market equilibrium, an increase in disposable income increases sav-ings (Bade & Parkin, 2002). Countries with a high saving rate experience faster growth of output. For example, Singapore had a 40% saving rate and a 5-6% GDP growth from 1960 to 1996 (Financial Supervisory Service).
Improving banking performing productivity is the major goal of a banking sector re-form. According to Devaney and Weber (2000), pure technical efficiency change, scale efficiency change and technological change affect productivity. FDI usually brings ad-vanced technologies and offers skill training programs to national banks in a reform process. On the other hand, Frei et al (1998) argued that an appropriate employment model for the given strategy has a positive effect on productivity improvement. Both privatization and consolidation process in banking reform clearly contributes to a posi-tive evolution of productivity (Vincenzo et al, 2005). The direct outcome from bank productivity increasing is reducing the cost of lending, since banks become more profit-able and efficient. More projects acquire loans from banks and more investments will occur at home and abroad, which brings higher investment quantity.
A higher saving rate and more investment will lead to a higher stock of capital per worker, which eventually brings a higher level of output per worker. The more an economy is able to save and invest out of a given GDP, the greater the growth of that GDP will be (Harrod, 1948 & Domar, 1957). In the banking sector and concerning the equation (3), if there is an increase in saving or investment after banking reform, it will lead to an increase in capital (∆K↑), hence a positive effect on capital growth (∆K/K↑), eventually reflect on output growth (∆Y/Y↑), which means economic growth.
2.2 Ricardo - Viner Model
The Ricardo - Viner model (Ricardo, 1817) demonstrates the effects of trade in an economy in which one factor of production is specific to an industry. This model as-sumes that there is a single factor of production - labor, which is mobile across the home country and foreign country. The free movement of a labor force between the home and foreign country can adjust the real wage to be become the same in two coun-tries.
The Ricardo-Viner Model assumes labor as a factor of production (Rudiger at al 1998). This paper uses capital as a factor of production to indicate that capital in banking in-vestments is movable between the firms favored by government and other firms. Land and capital are the only scarce resources. Thus the output of each country will depend on the quantity of these factors available. The relationship between the supply of capital investment on one side and the output of the economy on the other is referred to as the economy’s production, which is denoted by Q (K).
Figure 2, An economy’s product function
Source: Rudiger at al (1998)
Figure 2 shows how a country’s output grows with accumulation of capital, keeping the supply of land fixed. The slope of the product function measures the increase in output that would be gained by investing a little more capital, and is thus referred to as the marginal product of capital (MPK), which is the additional output resulting from the use of an additional unit of capital. As the curve is drawn in the figure, the MPK is assumed to fall as the ratio of the capital to land rises. This is normal: as a country seeks to invest more in a given amount of land, it must move to increasingly capital-intensive tech-niques of production, and this will normally become increasingly difficult the further the substitution of capital for land goes.
In the South Korean case, the firms favored by government are less profitable and it is hard for them to pay back loans, which means that capital invested in them will end up with a lower MPK than those in other firms (Chung and Eichengreen 2002). This clearly creates an incentive for banks to reallocate capital resource to a profitable firm. Banks would also like to make profits from investments.
Capital K Q (K) Output Q
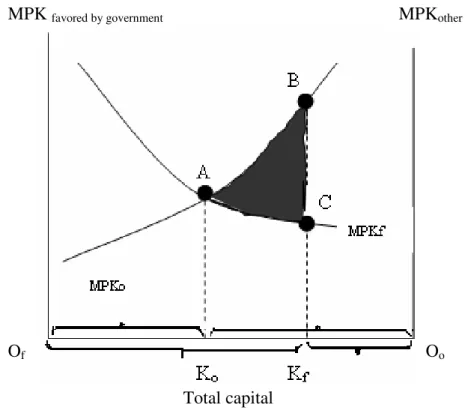
Figure 3 illustrates the causes and effects of capital mobility. The horizontal axis repre-sents the total capital. The capital invested in the firms favored by government is meas-ured from the left, the capital invested in other firms from the right. The left vertical axis shows the MPK in firms favored by government (MPKfavored by government); the right vertical axis shows the MPK in other firms (MPKother). In this case of capital invest-ments in the banking sector, the paper considers ROA as MPK, since ROA is the meas-urement of profits gained on capital investments. Initially we assume that OfKf repre-sents capital investments in the firms favored by government; KfOo is capital invest-ments in other firms. Giving this allocation, the MPK would be lower in the firms fa-vored by government (point C) than in other firms (point B). In the capital investments by banks, the main cause of this phenomenon is government intervention. If capital in-vestments can move freely to whichever firm offers the higher MPK, it will move from the firms favored by government to other firms until the MPKs are equalized. Let’s as-sume that if the government abolishes its intervention in the banking sector, the vertical line from BC will shift in the direction of equilibrium (point A) because the market can efficiently adjust capital to flow towards the other industries which yield higher returns (Rudiger at al 1998).
Figure 3, Causes and effects of capital mobility
Source: Rudiger at al (1998)
As we assumed before, Q (K) represents economy’s production, so Qf (Kf) represents the capital employed by the firms favored by government and Qo (Kf) represents the capital allocated to other firms.
In order to maximize GDP, which is in terms of Qf (Kf) + Qo (Ko),
let’s subject it to Kf + Ko = K (Total capital supply)
MPK favored by government MPKother
Of Oo
and set the Lagrangian function:
l
= Qf (Kf) + Qo (Ko) – λ (Kf + Ko – K ) (4)Let’s calculate the first derivative to maximize the Г value. d
l
/dKf = dQf/dKf – λ = 0d
l
/dKo = dQo/dKo– λ = 0dQf/dKf = dQo/dKo = λ (5)
The equation (5) indicates the situation at GDP maximization, which is represented as the point A in Figure 3. The eventual distribution of the capital investments by banks will be OfKo capital investments in the firms favored by government, OoKo capital in-vestments in other firms. Only at the equilibrium (point A) the capital allocation is effi-cient, and there is no capital waste.
Three points should be noted about this redistribution of the capital investments by banks.
• It leads to a convergence of MPK. MPKs rise in the firms favored by gov-ernment, but fall in other firms.
• It increases national MPK as a whole. We can see from Figure 3 that other firms’ gain is larger than the firms favored by government loss, by an amount equal to the colored area ∆ABC in the figure.
• Despite the increase in MPK, the firms favored by government experience contraction at the beginning of the change. Due to the government interven-tion, those less profitable firms would originally receive a lot of capital aid from state-owned banks, but after the change they will end up with less in-vestment (Rudiger at al 1998).
From growth accounting equation (3), θ represents capital share, which implies θ=K× MPK/Y. If MPK overall increases as mentioned above, it leads capital share (θ) to in-crease and θ×∆K/K to inin-crease at the same time, which eventually results in a raise in total output (∆Y/Y↑), stimulating economic growth.
3 Three approaches in the reform
At the end of the year1997, the financial crisis slowed down the South Korean economy growth. Foreign and domestic investment declined sharply because investors lost confi-dence in South Korean banks. At the beginning of 1998, the South Korean government started a thoroughgoing banking reform with mainly three approaches: public funds in-jection, allowing FDI entry, and banking sector restructuring.
3.1 Public funds injection relocates capital investments
3.1.1 Capital investments to conglomerates and other firms in South Korea before the crisis
Before the financial crisis, during the government intervention in the banking sector, the capital was misallocated and banks suffered losses. The following Figure 4 is about the proportion changes in bank loans for conglomerates and other firms in South Korea dur-ing the period from 1994 to 1997.
Figure 4, Proportion changes in bank loans for conglomerates (1994-1997)
Source: Bank of Korea (BOK), financial statement analysis, (various issues)
The figure above shows us that the proportion of bank loans to conglomerates was in-creasing each year from 1994 to 1997. By contrast, the proportion of bank loans to other firms was decreasing. For example, conglomerates took 46.1% of total loans in 1994, and this increased to 52.7% in 1997. Other firms only received 47.3% of total loans in 1997, and they had 53.9% of total loans in1994 (BOK, Financial Statement Analysis).
As mentioned before, the conglomerates in South Korea were owned by large families and had a very close relationship with the government. Furthermore, the operation deci-sions of conglomerates’ owners were based on expanding the range of business not its efficiency. In other words, the conglomerates only pursued size growth rather than pro-ductivity or efficiency improvement, which made them suffer losses in the 1990s. The top five famous conglomerates in the 1990s were: Samsung, Hyundai, LG, Daewoo and Kia, which accounted for more than 50% of South Korea’s GDP (Evolution of South
Korea's giants, 2007). The following Table 1 shows the top five conglomerates’ ROAs from 1995 to 1997.
Table 1, ROAs of the top five conglomerates (unit: %)
Sources: Sung Noh (1996, 1997, and 1998)
ROA is an index of measuring how profitable a firm is. A high ROA means that a firm’s management is efficient at using its assets to make a profit. From Table 1, one can see that the top five conglomerates were not very profitable during the period from 1995 to 1997. Through the average ROA, one can tell that it has declined from 4.95 in 1995 to 0.69 in 1996 and even dropped sharply to -0.34 in 1997, which means that the top five conglomerates were in a totally unprofitable situation before the crisis and were not able to pay back bank loans.
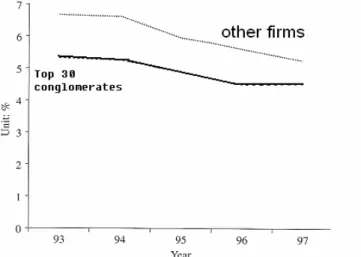
On the contrary, during the period of the 1990s other firms were developing relatively fast. Most of them depended on high technologies and market opportunities to make profits on their business. According to Chung & Eichengreen’s (2002) investigation on comparisons in ROAs between the top 30 conglomerates and other firms as in Figure 5, they demonstrated that the ROAs of other firms were roughly 6% and much higher than the top 30 conglomerates on average from 1993 to1997. Meanwhile, they also graphed the comparison in debt/equity ratio between the top 30 conglomerates and other firms as in Figure 6, which shows that other firms had much lower debt/equity ratio than con-glomerates during the same period. Ratio of debt to equity is a measure of a company’s financial leverage calculated by dividing its total debt by stockholder’s equity. The higher debt/equity ratios of the conglomerates indicate that they have been financing their growth heavily depending on the debts from the state-owned banks.
1995 1996 1997 Hyundai 3.55 1.12 0.14 Samsung 10.48 0.50 0.50 LG 6.60 1.30 -0.51 Daewoo 1.72 1.35 0.66 Kia 2.39 -0.82 -2.49 Average 4.95 0.69 -0.34
Figure 5, Comparison of ROAs between the top 30 conglomerates and other firms (1993-1997)
Figure 6, Comparison in debt/equity ratio of the top 30 conglomerates and other firms (1993-1997)
Source: Financial statement (2000), (Both Figure 5 and 6)
3.1.2 The NPLs coursed by the capital misallocation
The role of the banking sector is to ensure that capital resources are efficiently allo-cated. Efficient capital resource allocation is based on market forces and aimed to bene-fit projects. In South Korea, the banking system was not well developed during the pe-riod from the 1960s to 1990s. The banks gave loans depending more on firms’ size rather than profitability. By contrast, in a developed country, whose banking system is normally well established, not only large firms but also small firms are able to obtain capital resources. One more issue in South Korea’s case is that the government aided large firms when they were unable to pay back loans to banks. The unprofitable con-glomerates slowed down the South Korean economic growth. The South Korea’s GDP was 4.8% in 1997 which was 2% less than the two preceding years. In the 1990s, the South Korean government bailed out debt for conglomerates from banks, because the government considered that large firms were “too big to fail”. This action led also to South Korean banks suffering huge losses from failed investments in risky projects. As
a result, the high ratio of NPLs was the main problem for South Korean banks. It af-fected directly banks’ profitability. The following Table 2 is about the banks’ ROAs and ratio of NPLs in South Korea from 1991 to 1997.
Table 2, The banks’ ROAs and ratio of NPLs in South Korea (1991-1997, unit: %)
Year 1991 1992 1993 1994 1995 1996 1997
ROAs 0.55 0.68 0.51 0.54 0.34 0.27 -0.9
Ratio of NPLs 6.6 6.7 7.0 5.6 5.2 3.9 6.0
Source: The banks’ ROAs from Bank of Japan; the ratio of NPLs from BOK, Financial Statement Analysis
According to Table 2, one can see that ROAs of South Korean banks decrease almost each year from 1991 to 1996, except 1994. This indicates that South Korean banks were not profitable in that period. The ratio of NPLs has been rather high during the same pe-riod. The high ratio of NPLs caused banks’ capital adequacy ratio (CAR) to be lower than the international standard which was 8% (Chung and Eichengreen 2002). The CAR is a ratio of a bank’s capital to its risks. It determines the capacity of the bank in terms of meeting time liabilities and credit risks. The problem of the huge amounts of NPLs in South Korean banks was one of the crucial reasons for the financial crisis in 1997.
3.1.3 Public funds injection improves NPLs and relocates capital in-vestments
The injection of public funds was a fiscal financial support for the banking reform and it was launched by the government with the purpose of reducing the huge amounts of NPLs. The South Korean government started by putting 4.4 billion Korean Won (KRW) into the banking system in July 1997. The public funds injection eventually reached 64 trillion KRW at the end of 1998, which was nearly equal to 15% of the total South Ko-rean GDP in 1997. One half of the public funds were spent on reducing NPLs, and the other half was devoted to recapitalization, deposit payments, etc (Financial Supervisory Service). Table 3 below is about the ratio of NPLs during the South Korean banking sector reform after the financial crisis.
Table 3, The ratio of NPLs during the South Korean banking sector reform (1998-2001, unit: %)
Year 1998 1999 2000 2001
NPL ratio 7.4 13.6 8.8 3.3
Source: Financial Supervisory Service
From Table 3, one can tell that the ratio of NPLs was still quite high and reached its peak at 13.6% in 1999. After the public funds injection rose to its peak at the end of 1998, the ratio of NPLs declined regularly from 8.8% in 2000 to 3.3% in 2001, which indicates that the purpose of public funds injection to improve the condition of NPLs has been achieved.
The public funds injection was an external reform for banks to write off bad loans. Fur-thermore, banks also decided to make some internal reforms such as strict regulation on loans, which ensured loans to firms be based on economic criteria such as profits not the sizes of firms. The following figure shows the changes in banks’ lending to conglomer-ates during the reform following the financial crisis.
Figure 7, Proportion changes of bank loans for conglomerates (1998-2004, unit: %)
Source: Bank of International Settlements, (2005)
Obviously, the proportion of loans to conglomerates have decreased very much from 36.1 % in 1998 to 12.4 % in 2004, comparing the proportion change before financial crisis as Figure 7 shows, which was increasing from 46.1% in 1994 to 52.7% in 1997. At the same time, other firms had received a higher and higher proportion of loans from 63.9% in 1998 to 87.6 % in 2004 (Bank of International Settlements, 2005). This change indicates that South Korean banks recognized the importance of credit risk man-agement, and they needed an increasing availability of direct financing for borrowers with good credit.
At the time of the banking reform, the public funds injection had also been used for re-structuring conglomerates in order to improve their financial situation. For example, the government established core competencies for conglomerates and eliminated debt guar-antees in order to prevent unconstrained investment of conglomerates through unrelated diversification (Bank of Korea). Figure 8 below is the trend in debt/equity ratio of top five conglomerates in average before and after the reform.
Figure 8, The trend in debt/equity ratio of top five conglomerates in average (Unit: %)
Source: BOK, Financial Statement Analysis
The graph shows us the trend of debt/equity ratio of conglomerates is increasing before the crisis and reaches its peak in 1997 and is decreasing each year during the reform. The improvement of the debt/equity ratio was because of a better financial management having been achieved and a restriction on loans to conglomerates having been settled in order to supervise conglomerates’ owners to allocate capital investment more efficiently (Chung and Eichengreen 2002). As a result, the ROAs of conglomerates improved as well. On the other hand, the ROAs of other firms have declined since many of them could not cope with losses in the crisis and went bankrupt. According to the source from Seong (2001), the ROAs of other firms were around 5% in 1999, which was nearly 2% lower than those in 1995.
3.2 Increase of FDI in the banking sector after the reform
3.2.1 South Korean banking sector allowed FDI entry
The South Korean government started its liberalization plan in the banking sector from the early 1990s. Moreover, the “FDI Promotion Act” was launched in 1998 and it in-creased the possibilities to open up the South Korean banking sector to foreign inves-tors. The aim of the “Act” was to create a transparent and open environment. For the purpose of facilitating the banking sector restructuring, FDI entry was allowed to the banking sector and there was a marked increase in 1999 (The Korea International Logis-tics Council, 2006).
The increasing foreign entry into the South Korean banking sector has led to a high de-gree of foreign ownership with the increasing stakes and foreign management controls. From the source of shareholders’ information concerning individual banks, there were seven major domestic banks, and five of them were foreign-owned banks in South Ko-rea in 2003.
The seven major domestic banks were: Kookmin Bank (KB), Woori Bank (WB), Hana Bank, Shinhan Bank (SB), Korea Exchange Bank (KEB), Hanmi Bank and Korea First Bank (KFB). The five foreign-owned banks were KB, SK, KEB, Hanmi Bank and KFB, which means at least 50% of their shares were owned by foreign investors according to the definition of a foreign bank by Claessens et al (1998). From Table 4 below, one can see the average percentage of foreign-owned shares varied from 12.34 % in 1997 to 53.83% in 2003. For example, foreigners owned 73.6% of total shares in KB, which was the largest bank in South Korea. The shareholders are Bank of New York and ING group2 , which hold 10.4% and 3.9% of the equity each. (Kim & Lee, 2004)
Table 4, Foreign ownership in South Korean domestic Banks (1997 & 2003, unit: %) Banks At the end of 1997 At the end of 2003
Hanmi Bank 29.4 89.1 KB 0 73.6 KEB 2.7 71 SB 23.4 51.8 KFB 0.98 49.6 Hana Bank 21.3 37.2 WB 8.6 4.5 Average 12.34 53.83
Source: Bank of Korea, Financial statement Analysis
Through Table 4, one can see a significant increase of foreign ownership for the South Korean domestic banks in 2003 compared with 1997 before the financial crisis.
3.2.2 Changes in the South Korean banking sector brought by FDI entry Foreign banks’ entry has a positive effect on assisting the South Korean government to achieve its rapid privatization goal. For instance, KFB and Seoul Bank were the worst sufferers among all the state-owned banks in the crisis; KFB had 0.98% and Seoul Bank had 6.39% for CAR in December 1997, which were all far below 8% as international standard. At the end of 1997, both banks were ordered to take steps to improve their or-ganization. After the discussion between the South Korean government and the Interna-tional Monetary Fund (IMF) in December 1998, the government sold a majority stake of KFB to an association of American institutions, Newbridge Capital, to an estimated cost of 600 million to 1 billion KRW. One year later, the government settled a deal to sell Seoul Bank to HSBC Holdings for $900 million, which brought 51% of the new en-tity shares (Kataoka, 1999).
The South Korean government has also made some changes in management and gov-ernance framework in relation to FDI entry. From World Bank data in 1999, there were two third of board seats occupied by foreign directors in cooperate governance; there were six of the eleven majority-owned domestic banks changing their top management. At the end of 2003, there was one foreign president and one foreign vice president who controlled the management, and five foreign directors in KEB; there was a foreign president and three foreign vice presidents directly in charge of the KFB, with twelve foreign directors; other major domestic banks such as KB and Hanmi Bank also had more than two foreign directors on their board of directors. Foreign directors’ entry management framework reduced the risk of autocracy on the part of the president in bank management.
The opening by domestic banks to foreign banks has positive effects on making a trans-parent process of transferring savings to borrowers. Lack of transparency was one of the major causes of NPLs’ problem, because foreign investors could not achieve any accu-rate idea of the South Korean banks’ losses; therefore they lost confidence in investing in the South Korean market during the crisis. Foreign banks entry has hastened the fi-nancial development by improving access to banking services. It has been discussed that foreign bank entry makes it possible to improve the quality, pricing and availability of financial services in the domestic financial market by enabling the application of more modern banking skills and technology in South Korea (Levine, 1996). Many South Ko-rean banks also selected foreign experts as auditors during the reform, in order to im-prove their independence and professionalism.
3.3 Restructuring and the productivity of the South Korean
banking sector
In terms of the overall banking sector, South Korea has certainly been pressing ahead with thorough reconstruction in order to improve its banking system productivity so as to restore confidence in both domestic and overseas financial markets. In the course of financial restructuring, a number of national banks have suffered turnaround by cutting staff and branches, recapitalization, mergers, revocation of licenses, liquidation and bankruptcy with the assistance of public funds injection.
3.3.1 Financial Supervisory Commission (FSC)
In April 1998, the government established the FSC, whose function was enforcing re-structuring, ensuring capital adequacy guidelines to meet and strengthen risk manage-ment, and creating accounting standards. For instance, the FSC developed an electronic checking system for financial institutions in 1999, using some indicators to identify the problems in the early stages. The FSC has also improved disclosure requirements in ac-cordance with internationally accepted standards, such as new regulations for minority shareholders’ rights to serve actions as from February 1998. This ensured that listed banks were required to employ external auditors at the request of a nomination commit-tee consisting of internal auditors and outside directors representing shareholders and creditors. Another disclosure requirement established by the FSC was the guideline for disclosing NPL figures, in order to strengthen foreign investors’ confidence in the South Korean financial market. Before the banking reform, the disclosed NPLs, as the South Korean financial report showed, did not include renegotiated loans, in which banks’
re-discounted interest rates allowed those unprofitable conglomerates to survive. The dis-closed NPLs before were not credible and did not show the real situation of South Ko-rea’s banking problems (Kim, 1999).
3.3.2 Mergers and Acquisitions (M&A)
The government’s role in South Korea must be restricted to sustaining the effective functioning of the market mechanism in the banking system. Before the sell-off of KFB and Seoul Bank, 29% of the South Korean banking system was under government con-trol (Lee, 2000). One of the major reasons for the crisis, as we discussed before, was that the South Korean government arbitrarily allocated loans, which resulted in con-nected lending between state-owned banks and conglomerates. In the South Korean banking reform, in order to establish the principle of self-responsibility and to increase productivity, the government was to specifically re-privatize troubled banks.
For the purpose of improving the bank control, the South Korean government pursued the “General Banking Act”3 and “Act Concerning the Structural Improvement of the Fi-nancial Industry”4 performances in January 1998, in order to strengthen the demand for management changes, capital reduction, mergers, business transfers and third party ac-quisitions in banks whose CARs were below the 8% standard. In February 1998, the FSC assisted BOK to select six domestic accounting firms and cooperated with interna-tional standard accountants to examine the assets and liability management and practi-cability of the rehabilitation of twelve troubled banks as shown in Table 5, which had CARs below 8% at the end of 1997 (Kataoka, March 1999).
Table 5, CARs of 24 major South Korean banks at the end of 1997 8% or more
(12banks)
KB, Housing & Commercial (H & C), SB, Koram, Hana, Boram, Daegu, Pusan, Kwangjoo, Jeonbuk, Cheju, Kyongnam
Less than 8 % (12 banks)
Chohung, BOK, Hanil, KEB, Chungchong, Kyungki, Donghwa, Daedong, Peace, Kangwon, Chungbok
Source: BOK, Financial statement Analysis
In June 1998, the FSC followed the BOK requirements of capital enhancement and or-dered the departure of five out of those twelve banks, which were Daedong, Peace, Donghwa, Kyungki, Chungchong, with CARs lower than 8% standard. The healthy as-sets of those five banks were bought by the other five banks, KB, H&C, SB, Korea and Hana, which as Table 5 above shows had more than 8% CARs at the end of 1997. The South Korean government believed that mergers increase the competitive edge of the South Korean banking industry through economies of scale and would remove the inefficiency caused by the presence of many relatively small banks, thereby improving
3 In January 1998, the government amended the “General Banking Act” to enable supervisory authorities to carry out ‘fit-and-proper’ tests of shareholders and senior management by inspecting the adequacy of the composition of shareholders, the source of funds used in the acquisition of stocks, and the integrity and suitability of management teams. (Hisanori Kataoka, March 1999) 4 The “Act Concerning the Structural Improvement of the Financial Industry” was amended in January 1998, so that the govern-ment can order the destruction of the equity of shareholders deemed responsible for the insolvency of banks that the governgovern-ment has recapitalized or decided to recapitalize. (Hisanori Kataoka, March 1999).
the banking sector productivity (Kim, 1999). The case was because of the development of disintermediation and tougher competition with non-bank institutions (e.g., securities, insurance, etc.); the South Korean traditional banks had to lend a mass of riskier loans without establishing the appropriate risk-quantifying skills to charge sufficient interest rates on them5. An over-guaranteed and badly organized financial system, under the stress of disintermediation, led to an over-lending in risky situations. The over-banking situation forced South Korean traditional banks to be consolidated in order to be more profitable. For instance, the government was promoting the acquisition of upper-class banking institutions, which included most commercial banks (Financial System in Ko-rea). The FSC was ordered by the South Korean government to reconstruct seven desig-nated conditionally-approved banks through mergers, attracting foreign capital, consoli-dations with subsidiaries, and partial limitation of their banking business in 1999. These seven commercial banks were BOK, Hanil, Chohung, KEB, Peace, Kangwon and Chungbok, whose CARs were below 8% as Table 5 above shows (Kim, 1999).
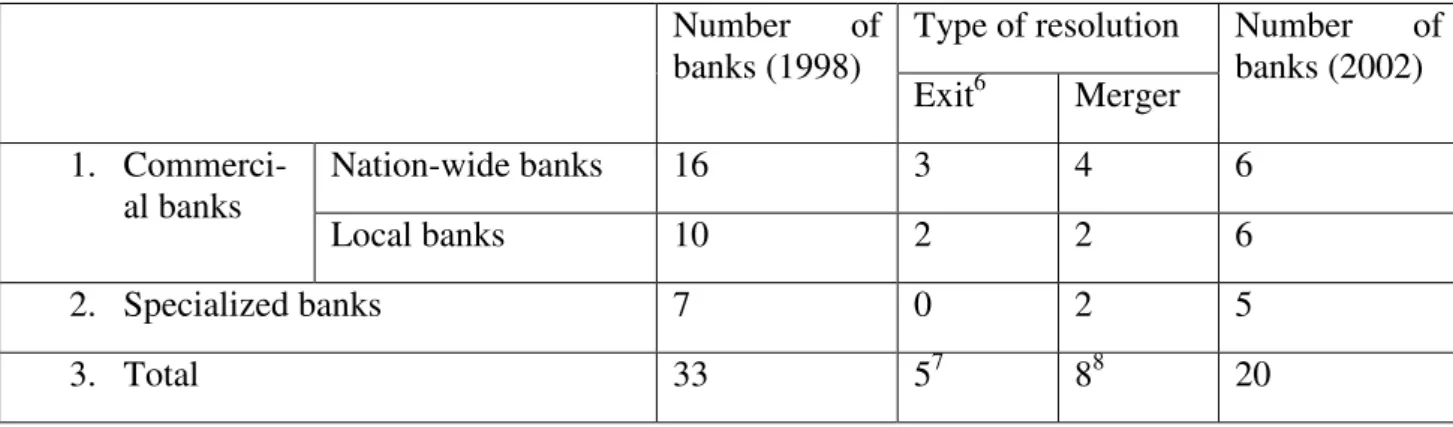
Table 6 below shows the changes from 33 to 20 in the number of national banks before and after the banking restructuring in South Korea.
Table 6, Changes in the Number of national banks (Jan, 1998 – Dec, 2002) Type of resolution Number of banks (1998) Exit6 Merger Number of banks (2002) Nation-wide banks 16 3 4 6 1. Commerci-al banks Local banks 10 2 2 6 2. Specialized banks 7 0 2 5 3. Total 33 57 88 20 Source: Hwang, (2003)
3.3.3 Downsize employees and reorganization of managing board
In order to increase productivity in the South Korean banking system, the large numbers of inefficient banking sector employees and organizations have been considerably downsized. Legislative regulation was also made for lay-offs and the leasing out of la-bor in order to change rigidities in the lala-bor market (Hwang, 2003).By December 1998, nearly 32% of total bank employees have been cut in most of South Korean banks. The banks also shrunk head offices and closed many branches. Table 7 selects six banks and shows what the changes in their employees, branches and net income were by the
5 The South Korean non-bank financial institutions were permitted to organize their management of assets and liabilities more free-ly, so they had greater interest rates on deposits and loans than traditional banks.
6 Exit includes revocation of licenses, liquidation and bankruptcy.
7 All of five banks exited in 1998.
construction over 1997. One can generally tell from the average rate (employees down-sized 34.1 %, branches downdown-sized 12.7% and net income reduced 1,675 billion KRW) that the banking reform has attempted to refine the banking system resolvedly, for the sake of enhancing productivity.
Table 7, The changes in South Korean banks’ employees, branches and net income over 1997
Banks Employees (%) Branches (%) Net income (billion KRW) KFB -39.1 -19.5 -2,600 Seoul -35.9 -20.3 -840 Choheung -35.3 -13.9 -1,970 KEB -32.2 -18.3 -840 Hanvit -32.1 -12.7 -3,350 Korea Housing -30.1 8.3 -450 Average -34.1 -12.7 -1,675 Source: Sender (1999)
The reform also included restructuring the managing board to corporate governance. The number of non-executive directors increased from 59.4% in 1997 to 70.7% in 1999 according to the report from FSC, so that the coverage of external audits could become expanded, and meanwhile supervision function of shareholders has become strength-ened (Kataoka, 1999).
4 Analysis
As above, we introduced the three banking reform approaches, and in the analysis we are going to discuss the relationship between the empirical reform approaches and the theoretical framework which we have stated before. Firstly we will relate the Ricardo - Viner model with capital investments reallocation brought by the public funds injection to indicate that the banks’ ROA in South Korea has increased as a whole after the re-form. As we mentioned before, in the banking sector, we use ROA to represent MPK. On the other hand, because of θ=K× MPK/Y, due to increase in ROA namely MPK, as result the capital share increases (θ↑); secondly, we will discuss that increase of banking sector FDI stimulates the total FDI, and banking sector restructuring improves the pro-ductivity so as to reduce the cost of lending, hence to increase national investment as a whole; thirdly we imply the Solow model - Growth accounting formula to show that in-creases of the total FDI and national investment enhance the capital change (∆K↑), which leads to a capital growth (∆K/K↑); finally we combine the Ricardo - Viner model and the Solow model - Growth accounting formula to argue that because there are in-creases both in capital share (θ↑) and capital growth (∆K/K↑), (θ×∆K/K) in South Ko-rea’s economy increases due to the banking reform. Concerning the Solow model - Growth accounting formula (3), due to the increase in (θ×∆K/K), total output will have a positive growth (∆Y/Y↑), which means that the banking sector reform has stimulated South Korea’s economy.
4.1 Relating to the Ricardo-Viner model before the banking
re-form
In this section, we will analyze how our discussion about capital investments to con-glomerates and other firms in South Korea before the crisis fits the unbalance situation in the Ricardo-Viner model. As in Figure 9, we assume that ROA to represent MPK in the banking sector and we use conglomerates to represent firms favored by the govern-ment. The left vertical axis represents the ROA of conglomerates (ROA conglomerates) and we assume the ROA of other firms on the right axis (ROAother firms).
Figure 9, South Korean capital mobility before and after the reform
We have shown before that conglomerates had lower ROAs than other firms before the crisis. In the figure above, point C represents the lower ROA of conglomerates (ROAc) and point B represents the higher ROA of other firms (ROAo). Clearly, both point B and point C are in the unbalance situation and are away from the equilibrium point A. In the model, the horizontal axis (OcOo) indicates total capital investment from the South Ko-rean banking sector, in which OcKc indicates the capital invested in conglomerates and KcOo indicates the capital invested in other firms before the reform. Because OcKc has longer length than KcOo, we consider that capital investments were misallocated. In the case of South Korea as we have discussed before, the proportion of the loans from the government-controlled banks to conglomerates was higher than to other firms, even though conglomerates were much less profitable than other firms pre-crisis. Note that misallocation of capital investments in South Korea before the financial crisis matches the unbalance situation in the Ricardo-Viner model, which is the location of line BC.
4.2 Relating to the Ricardo-Viner model after the banking
re-form
After the banking reform, the distribution of loans to conglomerates was much less than before the crisis. In Figure 9, the lower capital investment from the banking sector to conglomerates means that OcKc is beginning to shrink and point Kc is moving towards the equilibrium point Ko on horizontal axis of total investment. Meanwhile, the ROAs of conglomerates have increased after the financial crisis, which implies in Figure 9 the ROAc starts to move from point C with a lower value towards point A with an increas-ing ROAc, as shown by the arrow of CA. In the same sense, the arrow BA shows a de-creasing trend of the ROAo as we discussed before other firms had lower ROAs after the reform than during pre-crisis. The arrows on the curve of ROAc and ROAo show how the point C and the point B move to the equilibrium point A. The South Korean banking sector reform has successfully relocated the capital investment from the line BC moving towards the optimal situation of line AKo. As the result of capital
invest-ROAc B C A Oo ROAo Ko Kc C Total capital ROA conglomerates Oc
ment reallocation, the total ROA has overall increased by the triangle ABC in Figure 9. This would make the banking sector in South Korea more profitable. Figure 10 shows the total ROA of banks in South Korea has begun increasing since the banking reform in 1998.
Figure 10, Average ROA index of the South Korean banks (1996-2002, unit: %)
Source: Financial Supervision Commission
As we have introduced θ= K× (MPK/Y), one can infer that θ increases due to increase of MPK. Concerning the South Korean case, θ finally increases due to the increase of the total ROA after the banking reform.
4.3 Increase of banking sector FDI stimulates overall FDI
Since the South Korean government applied preferential policies in FDI entry domestic banks to sustain a liberalized investment environment as we mentioned before, it seems noticeable that those policies have played an outstanding role in stimulating a remark-able increase of overall FDI into South Korea since 1999. As the tremark-able below shows, there is an obvious jump of the overall FDI from 8.91 billion USD in 1998 to 15.6 bil-lion USD in 1999 when policies were applied. It reaches a peak of 15.8 bilbil-lion USD in 2000 before beginning to drop after 2001. One can clearly tell from Figure 11 that the increase of banking sector FDI has a close changing pattern as the overall FDI.
Figure 11, Combination of banking sector FDI and overall FDI
Source: Ministry of Commerce, Industry and Energy
A transparent banking operation motivated more foreign investors to make investments into the South Korean economy. The increase of total FDI leads to an increase of the circular capital (∆K↑).
4.4 Improvement of productivity led to reduction of cost of
loans
Per capita asset total means total asset divided by total number of employees in all banks, which symbolizes the productivity change of a bank sector.
From Table 8, one can tell that per capita asset total amounting to 5.32 billion KRW in 1997 has risen to 10.21 billion KRW and a 91.9% increase at the end of 2002. The higher banking productivity shows the efficiency rise due to all efforts paid towards banking restructuring during 1997 to 2002.
Table 8, Changes of South Korean banks’ productivity through restructuring reform (1997-2002, unit: 1billion KRW, %)
Division 1997(A) 1998 1999 2000 2001 2002(B) (B-A)/A
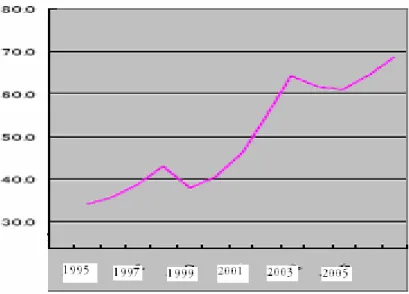
Per capita asset total 5.32 6.18 7.27 7.68 8.66 10.21 91.9 Source: Sender (1999)
Due to the improvement of productivity through the banking sector reform, the cost of loans was reduced thanks to the more efficient banking system functions in South Ko-rea. More and more loans have been lent out by the South Korean banks after the reform as shown in Figure 12, that there is a tremendous growth in the outstanding credit of private households from lower than 40 % in 1997 to nearly 70 % in 2006. Lower cost of lending brought automatically a higher rate of national investment in the South Korean economy, which also brings a positive change in ∆K.
Figure 12, Changes of South Korean outstanding credit9 of private households in per-cent of GDP (1995-2005, unite: %)
Source: Werner Kamppeter, 2007
4.5 Increase in total investments and real GDP
Let’s combine the increase of overall FDI and the national investment in the South Ko-rean economy after the reform, as we just discussed before. The curve of the total in-vestment change in Figure 13 shows us that the total inin-vestment in South Korea made a deep drop in 1998, since that was the second year of the crisis peak and most investors have lost their confidence in the South Korean financial market. But after that, the total investment has smoothly moved back during the reform period. The increasing trend of total investments shows that both foreign and domestic investors have much higher ex-pectations in South Korean banks after the reform.
In the 1990s, South Korea’s real GDP grew by more than 5% every year except 1998, when South Korea suffered a serious economic downturn. One can tell from the curve of real GDP change in Figure 13, there is a declining trend starting in 1996 and reaches the bottom in 1998 after the crisis took place. After the response to the crisis, which meant implementing the restructuring in order to correct the economic structural weak-nesses, the South Korean banking sector and furthermore its economic system have be-come more transparent, efficient and profitable. The real GDP starts to increase after 1998 and reaches its peak at more than 10% in 2000.
9 Outstanding credit includes outstanding euro denominated credit and outstanding foreign currency denominated credit. Euro de-nominated credit includes euro dede-nominated loans and advances, loans granted from central government funds, as well as bonds and debentures classified as investments. Foreign currency denominated credit includes foreign currency denominated loans and ad-vances, as well as foreign currency denominated bonds classified as investments (Statistics Finland)
Figure 13, Comparison of changes of real GDP and total investment (unit: %)
Sources: The Bank of Korea
Comparing the two curves in Figure 13, one can see that they have a very close chang-ing pattern pre and post-crisis. Both of them have an obvious decline since 1996 due to the weakness from being tightly regulated by the South Korean government financial sector, and drop to the lowest point in 1998, after the economic conditions deteriorated with the financial crisis in October 1997. Many state-owned banks became bankrupt as they were suffering from the huge debts of bankrupt conglomerates at the end of 1997. The confidence of foreign and domestic financial institutions and investors started to decline. The South Korean government undertook a complete reform in the banking sector, which contributed to curing the crisis and stimulating a fast economic recovery. Thanks to this reform, South Korea has made considerable progress in economic growth. Following the drop to -6.7% in the real GDP and -21.2% in the total investment in 1998, the real GDP in 1999 rose to 10.9% and the total investment to 3.7%, which indicates that both the real GDP and the total investment have both gained from the banking sector reform in South Korea.
Finally let’s combine the Ricardo - Viner model and the Solow model - Growth ac-counting formula. Because there are increases both in capital share (θ↑) due to im-provement of the total ROA and capital growth (∆K/K↑) due to the increase of the total investment, we may infer that (θ×∆K/K) in the South Korea’s economy increases. Con-cerning the Solow model - Growth accounting formula (∆Y/Y = (1-θ) ×∆N/N+θ×∆K/K+∆A/A) and the increase in (θ×∆K/K), as a result, the total output will enjoy a positive growth (∆Y/Y↑), which indicates that the banking sector reform has stimulated the South Korea’s economy after the crisis.