REPORT 5119
Deposition of Base Cations in Sweden
REPOR
T 5119
Deposition of
Base Cations in Sweden
REPORT 5119
Deposition of
Base Cations in Sweden
Gun Lövblad Christer Persson Elisabet Roos
SWEDISH ENVIRONMENTAL PROTECTION AGENCY
SWEDISH ENVIRONMENTAL PROTECTION AGENCY
Atmospheric deposition of base cations, such as calcium,
magnesium, potassium and sodium, is an important element
in the process of acidification, recovery from acidification and
for the calculations of critical loads.
Deposition of base cations is generally difficult to
esti-mate, and varies widely from one site to another. In this
study different methods have been used to estimate base
cation deposition and the results have been compared. The
study has provided new knowledge on the magnitude of
deposition over Sweden, the importance of different sources
and deposition processes and the contribution from national
sources in relation to longrange transport.
The recommendations given in the report can serve as a
basis for future work on estimating base cation deposition.
isbn 91-620-5119-9 issn 0282-7298
Deposition of
Base Cations in Sweden
Gun Lövblad
Christer Persson
Elisabet Roos
Environmental Assessment Department Environmental Impacts Section Contact: Ulla Bertills, telephone +46 8 698 15 02 The authors assume sole responsibility for the contents of this report,
which therefore cannot be cited as representing the views of the Swedish Environmental Protection Agency. The report has been submitted to external referees for review.
Production: Margot Wallin Cover: Johan Wihlke
Address for orders:
Swedish Environmental Protection Agency Customer Services
SE-106 48 Stockholm, Sweden Telephone: +46 8 698 12 00 Fax:+46 8 698 15 15 E-mail: kundtjanst@environ.se Internet: http://www.environ.se Bookstore: http://www.miljobokhandeln.com isbn 91-620-5119-9 issn 0282-7298
© Swedish Environmental Protection Agency Printed by: Berlings Skogs, Trelleborg, 2000
Preface
Base cations – calcium, magnesium, potassium and sodi-um – are present in forest soils where they are important nutrients for the forest trees. In the acidification process, base cations are leached from the soils as positive counter ions to sulphate and nitrate in soil water and thereby lost. One criteria used for determining the critical load is that the ratio between the concentration of (calcium+magnesium+potassium) and aluminum in the soil water should be 1.
The atmospheric deposition is an important source of base cation input to the ecosystems. It is not easily estimated, since base cations are found on particles in different size ranges and of varying origin. They are naturally emitted and from anthro-pogenic sources, on which knowledge is poor, and base cations take part in the internal cycling of ions in the canopies. The report deals with different approaches for estimating the magnitude of base cation deposition in Sweden, the importance of different sources and deposition processes. The report is a basis for further work on estimating base cation deposition in the mapping of critical loads and its exceedance. The project was financially supported by the Swedish Environmental Pro-tection Agency, mainly by the research programme Acidifying Substances and Tropospheric Ozone.
Gun Lövblad
Christer Persson and Elisabet Roos Göteborg and Norrköping 2000
Contents
Preface
Summary 7
Svensk sammanfattning 10
1 Introduction 13
2 Methods used for estimating base cation deposition 19
2.1 The MATCH model 19
2.2 The Na-ratio method 27
2.3 The Scavenging ratio method by RIVM 28 2.4 Canopy budget modelling of throughfall data 29 2.5 Surrogate surface sampler 30
3 Results of deposition estimates 31
3.1 The MATCH model 31
3.2 The Na-ratio method 33
3.3 The RIVM model 37
3.4 The Surrogate surface method 39
4 Conclusions and recommendations 49
4.1 Wet, dry and total deposition 49 4.2 Sea salt and non-sea salt deposition 51 4.3 Swedish and long range transport contributions 51 4.4 Remaining uncertainties 52 4.5 Recommendations for future deposition estimates 52
Acknowledgement 55
7
Summary
B
ase cation deposition (potassium, K+, magnesium, Mg2+, calcium, Ca2+,and sodium, Na+) is an essential parameter for quantifying critical
loads and its exceedance, as well as for prognoses on the recovery of ecosystems from acidification. Base cations associated with carbonates and oxides act as a neutralising input of alkalinity to the ecosystems. The base cations are emitted to the atmosphere as particles via natural processes (soil erosion, sea salt etc.) as well as anthropogenic activities (combustion of fuels such as coal and wood, different industrial processes, agriculture etc.). Emissions occur as particles of different size distribution and composition. For several types of emissions the magnitude and character is not very well known.
In this study different approaches have been used to estimate base cation deposition and the results have been compared. The results have provided information on the magnitude of deposition over Sweden, the importance of different sources and deposition processes as well as the contribution from national sources in relation to long-range transport. Two of the methods used are based on monitoring data alone (Na-ratios in throughfall and wet deposition and surrogate surface in parallel with throughfall measurements), and two are based on monitoring data in combination with modelling (SMHI’s MATCH-model and the RIVM-model). For the surrogate sur-face, monitoring data have been used for only one site.
The results show that total deposition of base cations is spatially and temporally variable, more variable than deposition of sulphur. In large parts of southern Sweden the total deposition of Na+ including sea salt is 500–1100
mg/m2 and year. The total deposition of Ca2+, Mg2+ and K+ is in the ranges
150–200 mg/m2, 75–150 and 100–150 mg/m2 and year, respectively. The
highest deposition is found at the west coast of Sweden, where also the strongest gradients are seen. Base cation deposition also shows a clear gradient with decreasing deposition from south to north.
The wet deposition depends to a large extent on precipitation amounts. However, there is a slight systematic deviation in wet deposition estimates based on different sets of monitoring data. This is unexpected, since the same type of equipment, the same sampling procedure and the same analytical laboratory is used. The deviations are thus suspected to be due to siting of sampling stations.
8
The dry deposition estimates for the two model-based methods represent a mixed land use. The other two, based on monitoring data, represent deposition to spruce forest only. As expected, these latter methods give larger dry deposition values than the model-calculated dry deposition representing mixed landuse. The model-calculated deposition, however, in largely forested areas was lower than expected. The reason for this may be that emission input to the model is uncertain, and that the dry deposition process may be simulated in a way, which may underestimate the deposition.
The three methods used for the whole of Sweden show different decreas-ing gradients in total deposition amount from south to north, and different gradients in dry to wet deposition ratio. Monitoring data indicate that the dry deposition in the north is almost negligible. The two partly model-based methods indicate a certain dry deposition contribution also in the north. However, the uncertainties are large in the north due to less monitoring data available on air concentrations of base cations, and on base cations in throughfall. This also shows that it is not possible to estimate base cation deposition with the same accuracy all over Sweden.
The three methods used for Sweden show different gradients of the ratio between dry and total deposition. The Na-ratio method gives a dry deposi-tion contribudeposi-tion of the magnitude 40% of the total deposideposi-tion in southern Sweden. The importance of dry deposition decreases according to this method towards the north. The MATCH model results indicate that dry deposition is of less importance and that the differences over the country are less significant than is shown by the Na-ratio method. The RIVM method shows a dry deposition which is 60–70% of the total deposition for Na+, Ca2+
and Mg2+ in large parts of the country, while the dry deposition of K+ is not
more than approximately 40% of the total deposition. The RIVM method gives mainly the same relative dry deposition contribution over the country. Sea salt deposition is a major contribution to the total deposition levels of Na+ (in most areas >95%) and Mg2+ (50–80%). For Ca2+ and K+ as little as 5–
20% and 10–20% of the total deposition is sea salt. But there are large variations over the country. The sea salt contribution is largest on the west coast, where about 20–30% of the Ca2+ and K+ wet deposition is sea salt. In
parts of eastern and central Sweden the sea salt contribution is about 15% for K+ and less than 10% for Ca2+. For Mg2+ more than 85% is of sea salt origin
in western Sweden, while in northern and eastern Sweden about 60% is sea salt.
9
The MATCH model results indicate that the Swedish contribution to the deposition of non-sea salt base cations is small, except locally around emission sources. For non-marine Ca2+, Swedish sources contribute with up
to 6–10% of the total deposition. In areas with extensive wood burning it reaches up to 15%. National anthropogenic Na+ emissions are further found
to account for less than 0.5% of the total deposition of Na+ on the west coast.
In most other areas the corresponding contributions are 1–7%, with the higher values locally on the coast in northern Sweden. This is in agreement with what can be estimated from monitoring data on Na+ and Mg2+ in
throughfall and wet deposition over the country.
Largely, there is an agreement between estimates of base cation deposition as regards the order of magnitude in southern Sweden. In northern Sweden, the deviations between methods are, relatively seen, larger than in the south. The different methods give sometimes contradicting results, however, as regards deposition gradients over the country and contribution from dry deposition and from sea salt deposition. A number of uncertainties involved in the methods used are defined. Many of these are due to lack of accurate data, for example for emission amounts and particle size ranges and for base cations in ambient air and in throughfall. To improve the estimates of base cation deposition more monitoring data are necessary. The lack of data is especially obvious in northern Sweden. Also, to improve the model-based estimate, an improved simulation of the dry deposition processes is necessary. This is not only necessary to improve the base cation deposition estimates, but also for estimating sulphur and nitrogen deposition.
For future deposition mapping, requirements have to be set for the need of details and accuracy of base cation deposition. The scale needed for the mapping is different in different areas. For example, the mapping of sea salt needs a special procedure, with a more detailed resolution, and taking into consideration the distance from the sea and local wind data. Use of new methods such as surrogate surfaces may contribute further to new know-ledge. Such methods are now being used at approximately ten sites over Sweden and may add to the knowledge of deposition from particles and fog drops, and also to the relation between atmospheric deposition and canopy leaching in throughfall.
10
Svensk sammanfattning
D
eposition av baskatjoner (kalium, K+, magnesium, Mg2+, kalcium, Ca2+,och natrium, Na+) är en viktig parameter för att bestämma kritisk
belastning och dess överskridande, samt för prognoser kring ekosystemens återhämtning från försurning. Baskatjoner som tillförts som karbonater och oxider ger ett tillskott av neutraliserande ämnen till ekosystemen. Baskatjoner emitteras till luft i partikelfas genom såväl naturliga processer (markerosion, havssalt, m fl) som antropogen verksamhet (förbränning av olika bränslen som kol och ved, olika industriella processer, jordbruk m m). Emissionerna sker via partiklar av olika kornstorleksfördelning och sammansättning. För flera typer av utsläpp är storlek och karaktär inte särskilt väl känd.
I denna studie har olika metoder använts för att uppskatta baskatjon-depositionen och resultaten har jämförts. Resultaten har gett information om storleksordningen på depositionen över Sverige, betydelsen av olika källor och olika depositionsprocesser samt bidraget från nationella källor i relation till långväga transport. Två av de metoder som använts baseras på enbart mätdata (Na-kvoter i krondropp och våtdeposition samt strängprovtagare parallellt med krondroppsmätningar) och två baseras på mätdata kombinerade med modellberäkningar (SMHIs MATCH-modell och RIVM-modellen). För strängprovtagaren har enbart utnyttjats mätdata från en plats.
Resultaten visar att den totala depositionen av baskatjoner varierar både i rummet och i tiden, och variationerna är större än för svaveldepositionen. I stora delar av södra Sverige är totaldepositionen av natrium inklusive havssalter 500–1100 mg/m2 och år. Den totala depositionen av kalcium, magnesium och
kalium är vanligen i intervallen 150–200 mg/m2, 75–150 respektive 100–150
mg/m2 och år. Den högsta depositionen återfinns på västkusten, där också de
starkaste gradienterna observeras. Baskatjondepositionen visar också en tydlig gradient med minskande deposition från söder mot norr.
Våtdepositionen beror i hög grad av nederbördsmängderna. Det förekommer dock en systematisk skillnad i uppskattningarna av våtdeposition beroende på vilket mätdataset som används. Detta är inte förväntat, eftersom samma typ av utrustning, samma provtagningsförfarande och samma analyslaboratorium använts. Skillnaderna misstänks därför bero på loka-liseringen av mätstationer.
11
De uppskattningar av torrdeposition som erhålls med de två modellbaserade metoderna representerar blandad markanvändning. De två andra metoderna representerar deposition enbart till granskog. Som förväntat ger de senare större torrdeposition än den modellberäknade torrdepositionen till blandad markanvändning. Den modellberäknade depositionen till skogbevuxna om-råden är dock lägre än förväntat. Detta kan bero på att emissionsdata som används är osäkra och att simuleringen av torrdepositionen kan ha gjorts på ett sätt som kan underskatta depositionen.
Mätdata tyder på att torrdepositionen i norr är i det närmaste försumbar. De två delvis modellbaserade metoderna tyder på ett visst torrdeposi-tionsbidrag även i norr. Men osäkerheterna är stora, beroende på att färre mätdata är tillgängliga för lufthalter av baskatjoner och för baskatjoner i krondropp. Detta visar att baskatjondepositionen inte kan bestämmas med samma noggrannhet över hela landet.
De tre metoder som använts för hela Sverige visar på olika gradienter i kvoten torr till total deposition. Na-kvotmetoden ger ett torrdepositionsbidrag som utgör ca 40 % av den totala depositionen i södra Sverige. Torrdepositionens betydelse minskar enligt denna metod mot norr. MATCH-modellens re-sultat tyder på att torrdepositionen är av mindre betydelse och att skillnaderna över landet inte är så stora som Na-kvot metoden indikerar. RIVM-metoden visar att torrdepositionen utgör ca 60–70 % av den totala depositionen för natrium, kalcium och magnesium i stora delar av landet, medan torr-depositionen av kalium endast utgör ca 40 % av den totala torr-depositionen. RIVM-metoden visar att torrdepositionens andel av den totala depositionen är ungefär densamma över hela landet.
Havssaltet utgör ett dominerande bidrag till de totala depositionsnivåerna för natrium (i de flesta områden >95 %) och magnesium (50–80 %). För kalcium och kalium utgörs så lite som 5–20 % respektive 10–20 % av den totala depositionen av havssalt. Men stora variationer förekommer över landet. Havssaltsbidragen är störst på västkusten, där ca 20–30 % av våtdepositionen av kalcium och kalium är havssalt. I delar av östra och mellersta Sverige utgör havssaltsbidraget ca 15 % för kalium och mindre än 10 % för kalcium. För magnesium härrör mer än 85 % av den totala depositionen från havssalt i Västsverige, medan ca 60 % utgörs av havssalt i norra och östra Sverige.
Resultaten från MATCH-modellen tyder på att det svenska bidraget till icke havssaltsrelaterad baskatjondeposition är litet, utom lokalt runt vissa
12
utsläppskällor. För icke havssaltsrelaterat kalcium bidrar svenska källor med upp till 6–10 % av totaldepositionenen. I områden med omfattande vedeldning kan det svenska bidraget uppgå till 15 %. Modellen uppskattar att nationella antropogena Na+-utsläpp bidrar till mindre än 0,5 % av totaldepositionen för
Na+ på västkusten. I de flesta andra områden är motsvarande bidrag 1–7 %,
med högre värden lokalt längs kusten i norra Sverige. Detta överensstämmer med vad som kan uppskattas ur mätdata för natrium och magnesium i krondropp och våtdeposition över landet.
I stort är det överensstämmelse mellan uppskattningarna av baskat-jondeposition, vad gäller storleksordningen på depositionen i södra Sverige. I norra Sverige är avvikelserna mellan de olika metodernas resultat relativt sett större än i söder. Metoderna ger dock ibland motsägelsefulla resultat vad gäller gradienter över landet och bidrag från torrdeposition och havssalt. En rad osäkerheter i metoderna har definierats. Många av dessa beror på avsaknad av tillförlitliga mätdata, till exempel för emissioner och partikel-storleksfördelningar och för baskatjoner i luft och i krondropp. För att förbättra uppskattningarna av baskatjondepositionen krävs mer mätdata. Bristen på mätdata är särskilt tydlig i norra Sverige. Förbättrade modell-beräkningar kräver vidare en bättre simulering av torrdepositionsprocesserna. Detta är inte nödvändigt enbart för baskatjonerna, utan även för upp-skattningarna av svavel och kvävedeposition.
För det framtida depositionskarteringsarbetet, behöver krav ställas på behovet av detaljering och noggrannhet. Den nödvändiga skalan för kartering är olika i olika områden. Till exempel kräver karteringen av havssaltsdeposition ett särskilt förfarande, med en mer detaljerad upplösning, och som tar hänsyn till avståndet till havet och till lokala vinddata. Användning av nya metoder som surrogatytor kan bidra ytterligare till ny kunskap. Sådana metoder används nu på ett tiotal platser i landet och kommer att kunna bidra till kunskaper om partikel- och dimdeposition och också till förhållandet mellan atmosfärsdeposition och interncirkulation i krondropp.
13
Chapter 1.
Introduction
Base cation deposition (potassium, K+, magnesium, Mg2+, calcium, Ca2+, and
sodium, Na+) represents a major input to ecosystem nutrient pools and is a
source for buffering acidic deposition. Base cations associated with carbon-ates and oxides represent an input of alkalinity with a capacity to neutralise acidic deposition. Neutralisation of acid deposition can occur via deposition of base cations from soil erosion or via alkaline base cation deposition originating from industrial processes and combustion emissions. Base ca-tions are also important nutrients to forest trees. Uptake of base caca-tions in stems and branches, which are removed from the ecosystems, may in some areas cause losses (Westling et al., 1997), which will further contribute to acidification. It therefore influences the reduction requirements for sulphur and nitrogen emissions.
A number of studies have estimated the base cation emission in Scandi-navia (Lövblad, 1987; Anttila, 1990) and in Europe (Lee et al., 1999). Still, large uncertainties are connected with the estimated amounts of base cations from anthropogenic sources, as well as with the size ranges in which the base cation particles are emitted to the atmosphere. Also, considerable difficulties are involved in estimating natural base cation emissions.
The development of emission reduction policies for acidification in Europe, based on the critical loads approach, requires a detailed knowledge of ecosystem sensitivity and the deposition of both acidifying compounds and base cations. The input of base cations is, however, poorly known and dry deposition of base cations has not been directly measured anywhere in Europe. A number of different procedures for mapping of base cation deposition are suggested in the “mapping manual” (Task Force on Mapping, 1996) used for the European mapping activities. Some procedures are based on monitoring results, others on modelling. Traditional model estimates however, require emission data, which are only to some extent available with sufficient accuracy.
Estimates of base cation deposition have been made for the Nordic countries (Lövblad et al., 1992; Tørseth & Semb, 1997) and for Europe
14
(Draaijers et al., 1995; van Leeuwen et al., 1996; Draaijers et al., 1997a and b). The estimates are made using different methods and all include consider-able uncertainties. The wet deposition contribution is relatively easily mapped from the large amount of wet deposition data available over Europe. For dry deposition, meaurements, except for throughfall, are largely lacking, as well as input data for model calculations; emission data and air concen-tration data. The uncertainties in the base cation deposition estimates significantly influence the critical loads for acidity and its exceedance (Lövblad, 1996; Lövblad, 1997) as well as prognoses for ecosystem recovery from acidification.
Furthermore, the base cation deposition, as the sum of natural and anthropogenic contributions, is not constant over time. During the last few decades, changes in total emissions and in the spatial distribution of base cation deposition have taken place within Europe (Lövblad, 1987; Hedin et al., 1994; Ukonmaanaho et al., 1997; Kulmala et al., 1998). Monitoring results have shown that in Sweden, and also in other parts of Europe, base cations emissions and deposition has decreased markedly between 1970 and 1990. In other areas, mainly those influenced by emissions from former eastern Europe, there has been a decline in base cation deposition from 1990 (Spranger, Umweltbundesamt). These declines may to some extent have offset the positive impacts of the simultaneous decline in sulphur deposition. The aim of this study is to estimate base cation deposition using different approaches available and to compare the results. A comparison of different methods is expected to provide information on the importance of different sources for base cations to the total deposition: anthropogenic sources and natural sources such as sea salt, biogenic material (pollen) and soil erosion dust (Table 1). It will also be possible to separate contributions from wet and dry deposition, and to separate local sources from long-range transport. Four different methods to estimate the base cation deposition over Sweden will be compared in this study. A fifth method which was applied at one site only, will also be included in the comparison.
15
Table 1. General overview of proceedings for estimating base cation deposition from different sources.
Contribution Scale of Wet deposition Dry deposition from impact
Na+ K+ Mg2+ Ca2+
All sources Local and Can be estimated via Can be Can be estimated via regional monitoring or estimated modelling based on
modelling. Wet via moni- measured air concen-deposition is usually toring (net trations or on emission estimated via data through- data. Large uncertain-from an extensive fall) or ties are involved. monitoring net. modelling.
Swedish Local and Can be estimated only by modelling. Swedish emission sources regional data are necessary and available.
Biogenic Local and The contributions Dry deposition of base cation material Regional from other sources sources other than sea salt cannot (pollen) than sea salt are be separated by approaches other
usually only deter- than modelling. Emission data are Industrial mined as the sum of necessary for the model calculation, processes & non-marine depo- but are usually not available. combustion sition. They can be
determined seperately Soil erosion via modelling, when
emission data are available.
Sea salt Relatively Sea salt contribution All sodium Sea salt contribution local is estimated, is normally is estimated for K,
assuming that all considered Mg and Ca using Na Na is from sea salt as sea salt as a tracer.
16
1. Estimates of base cation deposition in Sweden using the Eulerian atmospheric transport modelling system MATCH.
The base cation deposition is estimated using emission inventory data for Swedish sources, detailed meteorological analyses and available air and preci-pitation base cation measurement data. This method will allow a tentative separation of wet and dry deposition, of Swedish and long-range origin, of sea salt and non-sea salt contribution, and of contributions from some different Swedish source types.
2. Estimates of potassium, magnesium and calcium deposition based on the sodium deposition in throughfall and wet deposition data.
The total deposition of base cations is estimated from the ratio of sodium in total and wet deposition. Sea salt contribution can be separated from non-marine sources, under the assumption that all Na is of sea salt origin. 3. Estimates of base cation deposition in Sweden as a part of the RIVM
model calculation of European base cation deposition.
Wet deposition distribution over Europe is estimated from monitoring data. Air concentrations of base cations are estimated using the wet deposition observations and substance-specific scavenging factors as input data. Via inferential modelling, dry deposition of the base cations is estimated. Sea salt contribution is separated from non-marine sources, under the assumption that all Na is of sea salt origin.
4. Estimates of base cation deposition based on canopy budget modelling of throughfall.
A canopy budget modelling was tested but was not found to be applicable. 5. Estimates of base cation deposition using a surrogate surface
A passive sampler is used to collect fog and other particles on a surrogate surface resembling needles (nylon strings). The sampler collects airborne particles as dry deposition. The monitoring is made in parallel with throughfall and wet deposition measurements. Dry deposition is estimated from the ratio between different ions and sodium on the surrogate surface in relation to the net throughfall of sodium, which is assumed to be equal to the dry deposition of sodium. Sea salt contribution is possible to separate from non-marine sources under the assumption that all Na is of sea salt origin.
17
All five methods mentioned above are at least partly based on monitoring data from rural stations in the national and regional monitoring networks for air, precipitation and throughfall chemistry in Sweden.
A comparison of results is expected to indicate the importance of contri-butions from different deposition processes and to help in making priorities on the need for further work and for the need of accuracy in future estimates. The different approaches to estimate base cation deposition in Sweden are described in detail below. Base cation deposition was in this study mainly calculated for 1996. However, the RIVM data were not available for 1996, so in that case data for 1994 were used.
19
Chapter 2.
Methods used for estimating
base cation deposition
2.1 Estimating base cation deposition using the MATCH model
The MATCH model system in this application consists of three parts: • an objective analysis system for meteorological data,
• a regional atmospheric dispersion model, including modules for emission and deposition, and
• a system for data assimilation of concentrations in air and precipitation, which is combined with calculations of wet and dry deposition based on detailed meteorological and land use information.
2.1.1 Meteorological and physiographical data
The dispersion model requires meteorological data to calculate transport and deposition processes. For studies over Sweden an objective meteorological analysis system has been applied. The system makes use of routine meteoro-logical observations to derive a number of parameters required by the dispersion model; wind fields, temperature, precipitation, friction velocity, sensible heat flux, Monin-Obukovs length and mixing height. For upper levels in the atmosphere, meteorological analyses from the operational weather prediction model, HIRLAM, are used. The analyses are performed at three hourly intervals and interpolated to hourly values within the MATCH model.
The precipitation analysis is given special attention. Data from about 800 stations measuring daily precipitation over Sweden are combined with precipitation and weather information from synoptic or automatic stations to give precipitation fields with three hourly time resolution and high horizontal resolution. Corrections for sampling losses and topographic effects are also applied.
A high-resolution data-base for topography and land use has been mapped to the 20 x 20 km horizontal grids, which are used in the dispersion model. The data-base provides topography, roughness length and land use information (fraction of forest, open field, water and urban areas within the
20
grid square). Also information about soil types is included, expressed as fraction of a specific soil type for each grid square in the dispersion model. The land-use and soil-type data-base is used for the meteorological analysis system, for estimates of soil emissions of base cations and for calculating the dry deposition.
2.1.2 Dispersion Model
MATCH (Multi-scale Atmospheric Transport and CHemistry) is a three dimensional Eulerian atmospheric dispersion model. It is a so called, “off-line”-model, meaning that it requires meteorological data from an external archive at regular time intervals (three hourly) in order to calculate transport and deposition. The MATCH model is presented in detail in Robertson et al., (1999). In the present study an earlier, somewhat simplified and less computer time demanding version of the MATCH model (Persson et al., 1996) has been applied. This model version has been in operational use for annual air pollution assessment studies of sulphur and nitrogen over Sweden since 1995. The applied model covers Sweden with a horizontal grid resolution of 20 km. The emitted base cations have been separated into five different particle-size classes according to Table 2 below. For the time being the hygroscopic particle growth is not considered in the model calculations.
2.1.3 Deposition processes
Wet scavenging of the different species in the atmosphere is proportional to the precipitation rate and a scavenging coefficient. In this study, we have assumed the same scavenging coefficient value for all five particle-size classes, which for the time being has been treated in a simplified way and put equal to 2.6 · 10-4 (s-1) for Ca2+, Mg2+ and Na+. This value is roughly twice that
for sulphate. For K+ half the value was used. These scavenging coefficient
values are in good agreement with estimates based on measurements in Norway, presented by Semb et.al. (1995).
For the larger particle-size classes sedimentation velocities have been determined from Stoke’s Law and included in the model calculations. Dry deposition is proportional to the concentration and a dry deposition velocity at 1m height, which includes both turbulent exchange and sedimentation of coarse particles. Since the lowest model layer has a height of 75m, the turbulent part of the dry deposition flux calculation is transformed to the middle of that layer using standard similarity theory for the atmospheric
21
surface layer. Dry deposition velocities are specified for each particle-size and as a function of the surface characteristics (fraction of different landuse classes; forest, field etc). There are large uncertainties in the dry deposition values. Therefore we prefer, for the time being, not to include its dependence of e.g. friction velocity, u*, or surface wetness, in order to make the
interpre-tation of the results easier in relation to measurements. The deposition velocities applied are given in Table 2.
Table 2. Assumed deposition velocities, as a function of particle size (mean mass diameter), which have been used in the model calculations.
Size Deposition velocity (cm/s)
(µm) Urban Water Field Forest
0–2.5 0.2 0.15 0.2 0.6
2.5–6.0 0.4 0.3 0.4 0.8
6.0–0 0.8 0.7 0.8 1.1
10–15 1.4 1.3 1.4 1.8
>15 2.5 2.3 2.5 3.0
In literature very large differences in dry deposition velocities, vd, occur for the particle sizes included in Table 2. Wind tunnel studies by Chamberlain (1960) and later studies show low vd-values, while several field experiments, summarized by Gallagher et al. (1997) have shown much larger deposition rates. The values given in Table 2 are somewhere in between these extremes but can be regarded as low compared to some other recent performed model studies. The applied vd-values are e.g. lower than used by Draaijers et.al. (1997a).
2.1.4 Emissions
Emissions of base cations derive mainly from four types of sources: • industrial and combustion plants (anthropogenic)
• mechanical and wind erosion of soil particles from areas of uncovered soil and unpaved roads (natural and “semi-natural”)
• biogenic sources (pollen) • sea salt.
Wind erosion affecting the base cation deposition over Europe in general would be dominated by emissions from arid regions of southern Europe and the Saharan region while soil emissions from Sweden, with a humid climate, must be very much smaller. In some agricultural regions of Sweden, with
22
sandy soil, the local soil emissions may, however, play a role and have therefore been included in our model calculations as well as the Swedish anthropogenic emissions. For the time being no estimates of biogenic emissions and no specific estimates of contributions of sea salt coming from the Swedish coasts, separated from the long-range transport, have been performed.
Industrial and combustion emissions
The anthropogenic base cation emission data for Sweden (1995/96) are based on updating of the data from Kindbom et al., (1993). They include point source data (pulp and paper mills, iron and steel works and cement industry) and area source data (burning of wood, other bio-fuels, oil and coal). Also the particle-size distribution of the emissions have been estima-ted. The area source emissions in each county were distributed into the 20 x 20 km model grid. Hence, the emissions from burning of wood were distributed proportional to the population living in forested areas, the emissions retrieved from burning of oil were distributed proportional to the population, and from burning of coal and bio-fuels, except wood proportion-al to the population living in urban areas. The emissions used in the present study are given in Table 3 and estimated particle-size distributions are briefly indicated in Table 4.
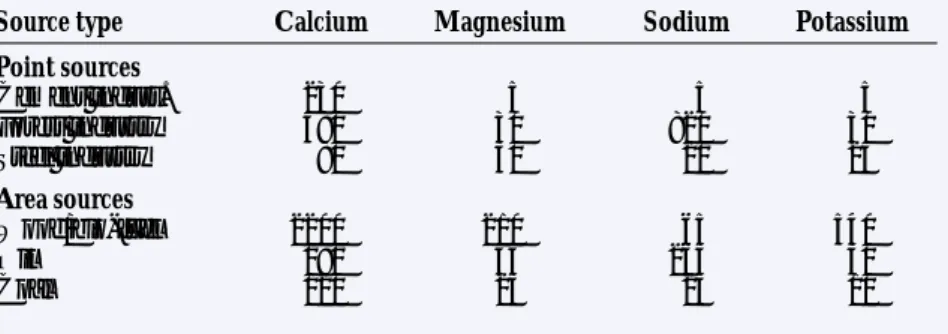
Table 3. Anthropogenic base cation emissions (tonnes/year) from Sweden 1995/96, separated into point and area sources according to the available emission inventory (updated data from Kindbom et al., 1993).
Source type Calcium Magnesium Sodium Potassium Point sources Cement indust. 230 5 5 5 Forest industry 480 30 820 30 Steel industry 80 30 20 25 Area sources Wood/bio-fuel 2200 210 65 540 Oil 180 45 265 30 Coal 120 25 25 10
23
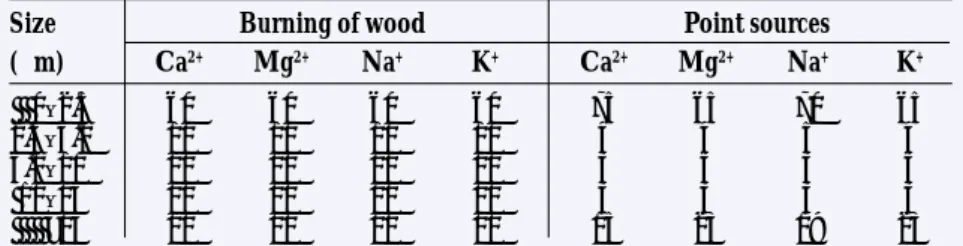
Table 4. Examples of estimated particle-size distribution (% per size-class) for some of the more important sources (data from emission monitoring archive, IVL).
Size Burning of wood Point sources (µm) Ca2+ Mg2+ Na+ K+ Ca2+ Mg2+ Na+ K+ 0–2.5 60 60 60 60 75 65 70 65 2.5–6.0 10 10 10 10 4 4 5 4 6.0–10 10 10 10 10 3 5 3 5 10–15 10 10 10 10 3 3 3 3 >15 10 10 10 10 15 23 19 23
The uncertainty of the data in Table 3 is estimated to be less than a factor of two except for wood burning, for which the uncertainty is much larger. The Swedish emissions could be as much as a factor of 5 larger than what is given in Table 3, according to Naturvårdsverket (1996) and Kindbom (pers.comm.). The contribution from sea salt is calculated only as long-range transport, see section 2.1.6, and thus not included in the emission inventory for Sweden.
Wind erosion emission
The present emission estimate includes only “natural” wind erosion from bare soils, while emissions caused by traffic on paved and unpaved roads as well as agricultural activities, for the time being, are excluded. Several empirical studies show that the amount of uplifted dust from bare soils is depending on the wind speed or the friction velocity, with a threshold wind velocity at which the erosion starts. Global modelling of the dust flux has been presented by i.e. Tegen and Fung (1994). Gillette and Passi (1988) have discussed a model for estimating the total dust production for the United States.
For the present application to Sweden the methods given by Marticorena and Bergametti (1995) have been used. The following equations were introduced into the MATCH model:
Horizontal flux: G = Cu*3(ρ
a/g)(1+u*t/u*)(1-u*t
2/u
*2)
where: C is a constant of proportionality with a value of 2.61, u* = friction velocity,
u*t = threshold friction velocity,
ρa = air density and g = acceleration of gravity.
24
Vertical flux: F = αG
where: α = 10-2 – 10-4 (in SI-units) for arid and semiarid areas.
The vertical flux, which is describing the emission of dust particles available for long-range transport is thus put proportional to the horizontal flux. The horizontal flux calculations have been restricted to periods of dry weather, temperatures above zero and bare soil. For northern Europe very little information about the α-value is available. However, it is probably somewhat lower than for arid areas ( Jönsson, 1994). In the present study α -values of 10-4 – 10-5 has been applied, and the results presented below are
based on an α-value of 3.3 · 10-5.
The friction velocities available in the MATCH system have been re-calculated for the soil erosion estimates, using similarity theory, to represent wind-profiles over open fields with a roughness length of 0.5cm.
Soil types in southern Sweden, for which erosion damage on agricultural fields has been reported (Nihlen, 1990), have been selected as possible sources for soil erosion emissions in Sweden. The threshold friction velocities have been determined for these soil types in a rough way, mainly based on reported erosion and wind measurements in southern Sweden ( Jönsson, 1994). The threshold friction velocities applied in the present model calcu-lations are given in Table 5. Lack of quantitative measurements of the erosivity of the Swedish soils causes, however, substantial uncertainties.
Table 5. Soil types and threshold friction velocities applied in the calculations.
Soil type Threshold friction velocity (m/s)
Sandy soils 0.43–0.90
Fluvial sediments 0.50–2.00
The number distribution of dust particles with regard to particle radius, r, was assumed to be described by dN/d logr ~ r-2 (proportional to r-2). No
direct information for Swedish conditions is available. The corresponding mass distribution follows dM/d logr ~ r. This expression was then used to distribute the soil emissions into the different particle-size classes in the MATCH model. The assumptions of the base cation content in soil were based on information on the cation exchange capacity for agricultural soils in southern Sweden (Eriksson et al., 1997): 15 mg/100 g for Mg2+, Na+, K+
25
the chemically easy available base cations, in line with what is measured by air and precipitation monitoring programmes.
The estimated emissions in Table 6 are small, compared to the total anthropogenic emissions from Sweden. However, the soil erosion emissions occur from very small areas and only during a few episodes per year. During 1996, soil emissions were obtained only for the months April, May and to a small extent in September. The fact that the main emissions occur during spring, is in agreement with observations that bare and dry soil, earlier affected by frost, can cause large soil emissions in areas like northern Europe. Therefore, locally and during shorter periods the erosion can be of impor-tance in Sweden. The model results presented below are based on the logarithmic mean for the Swedish soil emissions given in Table 6.
Table 6. Preliminary model estimates of base cation emissions (tonnes/year) from Sweden 1996 caused by wind erosion.
Calcium Magnesium Sodium Potassium
20–200 1.5–15 1.5–15 1.5–15
2.1.5 Air and precipitation chemistry measurements
In the present study, data from a number of background air and precipitation chemistry stations have been utilised. Data was applied in the long-range transport calculations as discussed below. Daily base cation concentrations in precipitation, for the year 1996, were obtained from four Swedish, five Norwegian and three Finnish monitoring stations. In addition, monthly precipitation data from 24 Swedish stations were used. The available precipitation chemistry stations cover relatively homogeneously Sweden with surrounding areas. Concentrations in air, however, were only available from four stations in Southern and Central Sweden for the year 1994, which were used. Thus the information regarding observed air concentration of base cations over Sweden, included in this study, are rudimentary and involve large uncertainties. Norwegian data are available and has added to the knowledge of Scandinavian air concentrations of base cations (Semb et al., 1995; Tørseth et al., 1999).
2.1.6 Long-range transport
The dispersion model described above, using national emission estimates and meteorological data, provides daily estimates of concentrations in air and
26
precipitation as well as dry and wet deposition of base cations. These results refer to contributions from sources within Sweden. The contribution from sources outside Sweden and from marine sources were obtained by subtrac-ting model calculated daily contributions from Swedish sources from obser-ved daily values of concentration in air and precipitation at background locations on a point by point basis. Four stations in Sweden for air concen-trations and about 36 stations for concentration in precipitation in and around Sweden are used. The residual is termed long-range transport contribution. These residuals are analyzed using an optimum interpolation method to give distributions of long-range transport contributions of concentrations in air and precipitation over the whole modelling domain.
The basic idea behind this method is that the long-range transport contributions to the concentrations can be expected to vary more smoothly in space, and therefore should be more suitable for interpolation than the total concentrations, which to some extent are affected by local sources. Long-range transport of wet deposition is then calculated by multiplying with the detailed observed precipitation field. Long-range transported dry deposition is calculated by running the long-range transport air concentrations through the dry deposition module of the dispersion model. Since we have no detailed measurements of particle size fractions for the long-range transport partic-les, we have only worked with one dry deposition velocity, vd, for each compound and landuse class. For Ca2+, Mg2+ and Na+ v
d-values of 0.7 to 1.1
cm/s have been used depending on landuse class, while for K+ v
d-values of 0.3
to 0.8 cm/s were assumed to be most relevant. These dry deposition values are however very uncertain and will be discussed further below. The chosen values are e.g. somewhat lower than used by Draaijers et al., (1997a).
The same calculation procedure for the long-range transport has earlier been applied with good results to assessment studies of sulphur and nitrogen over Sweden (Persson et al., 1996). For those compounds, a comprehensive set of measured data is available and considerable efforts have been spent on quality control. For base cations we still need more measured data for a reliable quality control.
The contribution from sea salt has been estimated as solely a long-range transport contributions, using measured sodium concentrations in precipi-tation and air assuming that sea salt is the only source of Na+ in air and
precipitation. The sea salt contribution to Mg2+, Ca2+ and K+ can then be
expressed as a factor fx of the [Na+] concentration, where f
27
0.0218 and 0.212 respectively, on a molar basis. In all long-range transport deposition calculations, sodium is generally considered as 100% sea salt. The contribution of other sources for sodium over Sweden is discussed below.
2.2 Estimation of base cation deposition using the Na-ratio method
Total deposition of base cation is estimated using monitoring data on base cations in bulk deposition and throughfall. These estimates are produced in the same way as earlier for the critical loads mapping in Sweden (Lövblad et al., 1992; Ulrich, 1983). The base cation deposition is estimated by:
Totdepi = TFNa /WdepNa x Wdepi where:
Totdepi is total deposition of ion i WdepNa = wet deposition of ion Na+
TFNa is throughfall of Na+ Wdep
i = wet deposition of ion i
The following assumptions are made:
• Total deposition of Na+ is well quantified via throughfall
measure-ments. This assumption is generally accepted (Ivens 1990, and referen-ces therein).
• The wet deposition of all ions (Na+, K+, Mg2+ and Ca2+) is quantified in
the same way. Bulk deposition measurements are assumed to represent the wet deposition in lack of wet-only deposition data. This assumption involves only minor uncertainties (see Table 7 below) for Sweden. • Base cations (Na+, K+, Mg2+ and Ca2+) are deposited as particles. For our
estimates they are – due to lack of data – assumed to be present in the atmosphere in the same particle size distribution. Measurements as well as literature data (Semb et al., 1995, Lee et al., 1999) indicate some differences, see below.
For accurate estimates of the dry deposition, wet deposition should be measured as wet-only deposition. Most measurements in Sweden are, however, made using open, so called bulk deposition samplers, which are subject to some contributions of dry deposition. The data from wet-only measurements are too few to provide a base for estimating base cation deposition. Bulk deposition data has therefore been used and been assumed to represent the true wet deposition. The importance of dry contributions
28
varies between regions and components. The difference between parallel wet and bulk deposition as a mean over five years for four rural stations in Sweden, is presented in Table 7 (Granat, 1988). The table indicates that the dry deposition contribution to the samplers is less than or approximately 10%.
Table 7. Comparison between parallel wet-only and bulk sampling at four rural sites during five years (Granat 1988). Ion concentrations are given in µeq l-1and precipiation
amounts in mm.
Parameter Average Difference (bulk minus wet-only) absolute relative (%) Precipitation amount 51 10 20 SO42- 55 –0.7 –1 NO3- 27 –0.5 –2 NH4+ 26 1.2 5 H+ 38 –1.0 –3 Na+ 13 1.5 12 Cl- 17 1.2 7 Mg2+ 4 0.4 9 Ca2+ 8 –0.5 –6 K+ 2 (–0.4) Not calculated
Few measurements of base cation concentrations in air are made in Sweden. Consequently, data are not available, neither on the total amount of base cations in air, nor on its distribution witin different particle size ranges. Results from measurements in southern Norway (Semb et al., 1995; Tørseth et al., 1999) indicate similar size fractions for Ca2+ and Na+, while K+ seems
to appear in somewhat smaller particles. Since base cations are of different origin, it seems reasonable to believe that they are present on different types and sizes of particles.
2.3 Estimation of base cation deposition using the scavenging ratio method by RIVM
Data on base cation deposition in Sweden were obtained from RIVM as a part of the data set calculated for the European critical loads mapping. The procedure is based on measured wet deposition of base cations. These data were collected from networks all over Europe (van Leeuwen et al., 1995; 1996, Draaijers et al., 1997 a och b). The major part of the monitored wet deposition data is consequently the same as for the other methods in this study. Annual mean bulk deposition was, however, corrected for estimated
29
dry deposition to the bulk samplers. Maps of base cation concentrations in precipitation have been produced using block-kriging interpolation techni-que with blocks of 50 x 50 km. The concentrations were multiplied with precipitation amounts to give the wet deposition flux. The precipitation chemistry data were further used to estimate ambient air concentrations of base cations using a model based on scavenging ratios. The dry deposition flux was then calculated as the product of dry deposition velocities and ambient air concentrations at a reference height of 50m. This is an inferential technique, based on Slinn´s approach (Slinn, 1982) tested against microme-teorological measurements.
2.4 Estimation of base cation deposition using canopy budget modelling of throughfall data
Throughfall data cannot be used directly to estimate deposition of sub-stances, which are taken up or leached in the canopy, such as nitrogen compounds and base cations. Consequently, there is a need for separating the internal cycling in the canopy from the influence of atmospheric deposition. A number of similar approaches, so called canopy budget models, have been tried (e.g Lovett & Lindberg, 1984; Van der Maas & Pape, 1991; Draaijers & Erisman, 1995, Hultberg & Ferm, 1995; Westling et al., 1995; Draaijers et al., 1996; Ferm & Hultberg, 1999).
These approaches, however, depend on reliable monitoring data and analyses of all major ions. The canopy budget model tested (Westling et al., 1995) did not produce reliable results based on the data set available. One factor is that most throughfall samples showed a deficit of anions. As an indication of the uncertainties, the deviation between measured cat- and anions in the corresponding throughfall is in the range 50% of the estimated deposition of (K++Mg2++Ca2+) in southern to central Sweden. In the north,
the anion deficit, are even larger, up to 150%.
It is not known to what extent this is due to the presence of compounds which are deposited or leached in the canopy, but not measured, or to what extent it is due to systematic errors in the analysis. In the throughfall samples collected at a large number of forest sites in Europe within the UN ECE Programme ICP Forests, it has been shown that poor ion balance is relatively frequent. It occurs even in cases where the analytical quality via laboratory intercomparisons has been found to be good.
30
The general conclusion is that the method tested is not suitable to use in this way, especially not in the northern areas, unless it is based on samples with improved ion balance, which is likely to include monitoring of additio-nal parameters.
2.5 Estimation of base cation deposition using surrogate surface sampler
Particles and fog droplets are collected (dry deposition) on a surrogate surface resembling needles in parallel with throughfall and wet deposition measu-rements. The surrogate surface in this case is teflon strings (For further details on equipment and procedure, see Ferm & Hultberg, 1995; Ferm & Hultberg, 1999). The dry deposition of K+, Mg2+ and Ca2+ is estimated from
the ratio between an ion i and sodium on the surrogate surface in relation to the net throughfall of sodium.
DDi = NTFNa x SSi / SSNa where:
DD = dry deposition, NTF = net throughfall, SSi = flux of ion i collected on the surrogate surface SSNa = flux of Na+ collected on the surrogate surface
As for the Na-ratio and the RIVM method, this method assumes all base cations to be present in the same particle size ranges.
The method has been run and applied for some years, including 1996, within the Nitrex-project at the Gårdsjön monitoring site on the Swedish West Coast (Ferm & Hultberg, 1999). From 1997, the method has been applied also at a number other sites over Sweden (Ferm et al., to be published).
31
Chapter 3.
Results of
deposition estimates
3.1 Estimated deposition using the MATCH model
It is a purpose of this study, as far as possible, to separate the deposition of different ions, to compare Swedish contribution with long-range transport contribution, as well as to compare sea salt contribution with non-sea salt contribution. Of course, also the total deposition is of interest. Therefore, different maps are presented and compared on the deposition of Ca2+, Mg2+,
Na+ and K+. Examples of model results for base cations over Sweden for 1996
are presented below in Figures 1–9, pp 40–48. It is important to observe the fact that different shading intervals are used for different maps. The results are still – to some extent – tentative, due to uncertainties in emission data, roughly estimated sink parameters and lack of air concentration measurements. For example, air concentration measurements had to be used for another year, 1994, and for only four stations, since no other measurements were available. Figures 1–4 show comparisons between Swedish contributions, long-range transport and total wet+dry deposition of non-sea salt Ca2+, Mg2+, Na+
and K+. For Na+ also sea salt is included. The Swedish contribution of Ca2+
is estimated to be about 6–10% of the total deposition in most parts of southern Sweden and along the Eastern Coast (Figure 1). In areas with extensive wood burning the Swedish contributions may reach 15%. In northern Sweden, except for along the coast, the Swedish contributions are less than a few percent. The highest total deposition of non-sea salt Ca2+ is
found in southeastern Sweden near the coasts.
Non-sea salt deposition of Na+ is estimated to be approximately 1% or less
in southern and central Sweden and may amount to as much as 3% of the total deposition in the north. For Ca2+ K+ and Mg2+ 80–95%, 70–90% and
20–30%, respectively, is of other origin than sea salt. The largest deposition of sea salt (Na+) occurs in southwest Sweden (Figure 3) and in the
north-western mountains. However, since sea salt is only described through the long-range transport calculations, the number of monitoring sites for
32
atmospheric chemistry on the west coast is too small and the model resolution is too coarse to describe the local gradients of sea salt along the coast in detail. The sea salt deposition should have a maximum along the coast and decrease further inland, which in the present model version cannot be described without available measurements along the coast.
The non-sea salt depositions of Mg2+ and K+ (Figure 2 and 4) are to a large
extent dominated by the long-range transport. The largest total deposition values are found in southern Sweden, with values of 20–30 mg/m2 for Mg2+
and 100–140 mg/m2 for K+. In the very north of Sweden the values are around
10 mg/m2 for Mg2+ and 50–60 mg/m2 for K+.
Also for the other base cations the Swedish contributions are small. The calculations indicate e.g. that Swedish anthropogenic sources account for less than 1 % of the Na+-deposition on the Swedish west coast and in the westerly
parts of the mountains in northern Sweden. On the eastern coast in northern Sweden the corresponding figures are 2–3 %. In small areas the anthropogenic sources may contribute with up to 7%. The non-sea salt contribution to Na+
is here mainly caused by the forest industry. This means that for some areas on the Swedish east coast at least 2–7 % of what is normally estimated to be sea salt should not be regarded as such.
The calculated dry and wet deposition with and without sea salt for the different base cations are presented in Figures 5–8. All figures indicate larger deposition in southwest Sweden and low values in the very north. It is also obvious from these figures that the dry deposition, according to our present calculations, is much smaller than the wet deposition for all compounds. We can also see that for Ca2+ and K+, the non-sea salt wet deposition is a rather
large part of the total deposition. For Mg2+ and, of course, for Na+ the sea salt
part dominates. In Table 8 average values for some different regions in Sweden are given. The selected regions are counties or groups of counties showing similar deposition patterns, see below. From our present tentative calculations, with large uncertainties in the deposition velocities, the dry deposition of Ca2+ accounts for about 10–20% of the total Ca2+ deposition,
with the highest values in eastern Sweden where the precipitation amounts are smaller. For Mg2+ the corresponding dry deposition ratios are 20–40%, for
Na+ 20–50% and for K+ about 10–15%. This might, however, be an
under-estimate of the dry deposition, especially in forested areas, since we have assumed rather small dry deposition velocities compared to what is indicated by e.g. Tørseth and Semb (1997).
33
Dry deposition is estimated to contribute with approximately 40% of the total deposition in many parts of southern Sweden. Lower contributions, in some areas even negative contributions, are observed towards the north.
Table 8. MATCH deposition estimates (incl. sea salt) as an average over different regions of Sweden, in meq/m2 per year and % dry of total deposition.
Region* Na+ Na+ Na+ Ca2+ Ca2+ Ca2+ Mg2+ Mg2+ Mg2+ K+ K+ K+
Wet Total Dry Wet Total Dry Wet Total Dry Wet Total Dry in % in % in % in % K 22 27 21 9.0 10.0 10 6.7 8.3 21 3.2 3.6 12 D-H 14 22 25 7.0 8.0 13 4.6 6.1 24 2.3 2.7 14 O-P 34 44 21 7.5 8.8 13 9.2 11.3 20 2.7 3.1 13 R 16 22 28 5.3 6.3 17 4.8 6.7 28 2.1 2.4 14 A-C 8.3 12 32 4.5 5.5 17 3.6 4.2 28 1.8 2.1 14 U 7.8 12 36 5.5 6.5 15 3.6 4.2 28 2.0 2.3 12 W 8.7 14 38 5.3 6.0 13 2.7 4.2 36 1.9 2.2 12 AC/BD 4.1 8 49 3.4 3.8 11 1.4 2.3 37 1.6 1.8 10 * County codes: K = Blekinge, D-H = Södermanland to Kalmar, O-P = Bohuslän, Älvsborg, R = Skaraborg, A-C = Stockholm, Uppland, U = Västmanland, W = Kopparberg, AC/BD = Väster-/ Norrbotten
3.2 Estimated deposition to forests using the Na-ratio method
Estimated base cation deposition to spruce forest stands is presented per region in Table 9 below. The results are presented as wet and total deposition of K+, Mg2+ and Ca2+. The dry deposition (Table 9) and non-sea salt
contributions are estimated (Table 10).
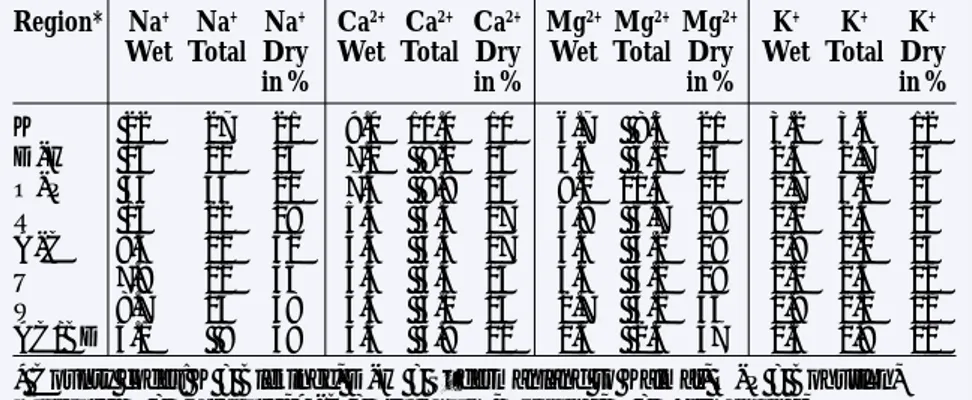
Table 9. Measured wet (bulk) deposition of base cations, throughfall of Na and estimated total deposition of K++Mg2++Ca2+ 1996 (meq/m2) per year in different
regions (counties). The estimations are based on the ratio between throughfall and wet deposition for Na.
Region* No of Meas. Measured wet deposition Estimated total Dry spruce through- deposition
deposi-fall flux tion %
sites Na+ Na+ Ca2+ Mg2+ K+ Ca2+ Mg2+ K+ of total K 1 37 24 10 7.3 3.9 16 11.1 6.0 35 D-H 5 20 11 9.1 4.3 3.5 16 7.4 6.2 43 O-P 3 100 61 12 15 5.9 19 24 9.7 39 R 4 25 15 5.7 4.3 2.6 9.0 6.8 4.1 40 A-C 9 18 7.8 6.6 3.5 2.5 15 7.9 5.7 57 U 5 10 7.7 7.5 3.3 2.9 10 4.3 3.9 23 W 2 5.8 7.7 6.8 2.0 2.9 6.8 2.0 2.9 neg AC/BD 2 4.8 7.4 6.5 2.1 3.5 6.5 2.1 3.5 neg * Regions, see Table 8.
34
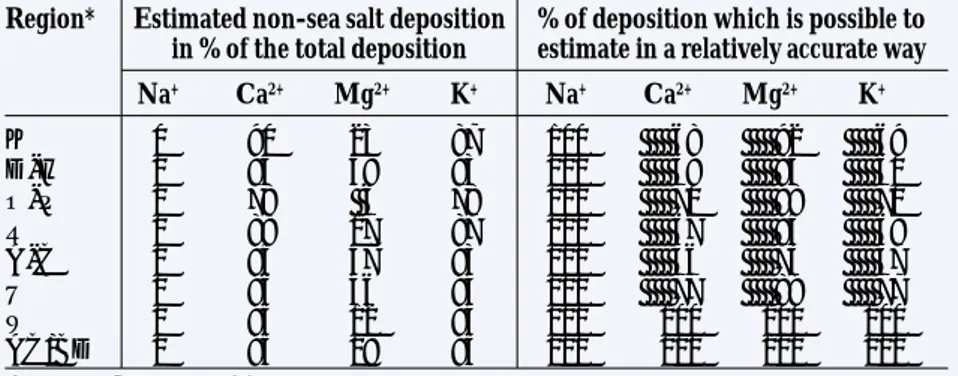
Table 10. Estimated non-sea salt deposition of different ions and the part of deposition which is possible to estimate in a relatively accurate way.
Region* Estimated non-sea salt deposition % of deposition which is possible to in % of the total deposition estimate in a relatively accurate way Na+ Ca2+ Mg2+ K+ Na+ Ca2+ Mg2+ K+ K 0 90 23 87 100 68 92 69 D-H 0 95 38 93 100 59 84 60 O-P 0 78 6 78 100 70 98 70 R 0 88 17 87 100 67 94 68 A-C 0 95 47 93 100 46 73 47 U 0 96 46 94 100 77 89 77 W 0 95 12 94 100 ⬃100 ⬃100 ⬃100 AC/BD 0 95 18 95 100 ⬃100 ⬃100 ⬃100
* Regions, see Table 8.
Negative values are assumed to be mainly an artefact due to uncertainties in the wet deposition estimates, to a large degree a consequence of difficulties in collecting representative samples, especially during wintertime.
The sea salt contribution is estimated from the assumption that all sodium is of sea salt origin. This assumtion is only partly correct. In all areas, sea salt is the dominant source. In areas with a high sea salt deposition, other sources can largely be neglected. In other areas combustion and industrial sources may give a minor contribution of 10–20% at the most, except maybe very locally. This was estimated from throughfall data using the relation between Na+ and Mg2+ in throughfall and in sea salt. Also the MATCH model results
indicate that only a small part (<10%) of the total Na+ deposition may be of
other than sea salt origin. The Na-ratio method estimates indicate that K+
and Ca2+ to a large extent, >80–90%, of the total, is of other origin than sea
salt. Between 15 and 50% Mg2+ is in many regions estimated to be of other
origin than sea salt.
Table 10 also presents the part of the deposition, which is assumed to be possible to estimate in a relatively accurate way, i.e. the sum of total wet + dry sea salt deposition. For Mg2+ >75% is estimated to be “well known”. For Ca2+
and K+ the equivalent part varies between 50 and 70% in southern Sweden
and almost all of the deposition is estimated as “well known” in the north. The monitoring data for 1996 show a ratio between throughfall and wet deposition of Na+, varying over the country. Over the larger part of southern
35
Sweden the ratio is around 1.6. Higher ratios 1.8 – 2.3 are seen in the eastern parts of southeastern Sweden. The reasons for the geographical variation are not easily explained, especially since no data on base cations in the atmosphere are available. Both the air pollution levels, the deposition amounts, the precipitation frequency and the forest stand structure may be of importance. The ratio decreases towards the north. A similar decreasing gradient from south to north is seen also for the ratio between throughfall and wet deposition of sulphur.
In northern Sweden, even ratios <1 are obtained, indicating a larger wet deposition than throughfall deposition of sodium. This is seen also for sulphur and is assumed to be an artefact due to difficulties in correctly estimating the precipitation and wet deposition. The difficulties increase towards north due to long season with snow precipition, which is extremely difficult to sample and to quantify correctly. Another factor, which may contribute to the uncertainties in the deposition estimate, is that at least one contributing process, stemflow, is not measured. Work is presently going on to separate the contribution to this uncertainty by different factors (Westling and Ferm, under preparation).
The monitoring results also indicate a difference between forest stands. The largest deposition is generally seen in spruce stands, and lower deposi-tion is observed in pine and deciduous forests. This is obvious also for sulphur, nitrogen and base cation deposition. However, the monitoring data for other than spruce forests are too few to conclude generally and accurately on the dry deposition to these types of forests.
Comparisons between the MATCH model and the Na-ratio method results are made in Table 11. There is a tendency to higher wet deposition values using the Na-ratio method. For two regions, the west coast (O region) and northern Sweden (AC/BD region) the Na-ratio method gives consid-erably higher values. The west coast region is subject to high deposition due to influence from the sea. Precipitation amounts vary substantially within the region. The area is consequently subject to strong gradients, and the estimates of average deposition may be uncertain. In the north, the deposi-tion levels are low and during winter, with snow precipitadeposi-tion, the wet deposition is especially difficult to estimate.
The Na-ratio method is expected to provide somewhat higher dry and total deposition, since it estimates deposition to spruce forests, while the MATCH results refer to mixed land use. This is also the case in most areas
36
in southern Sweden. Thus, the relative dry deposition contribution, estimated with the MATCH model in southern Sweden, is lower than that estimated with the Na-ratio method. In northern Sweden, the relative dry deposition contribution estimated by the Na-ratio method, decreases substantially, while it is increasing (especially for sea salt) or is constant in the MATCH estimates.
Further discussions and comparisons are given in chapter 4.
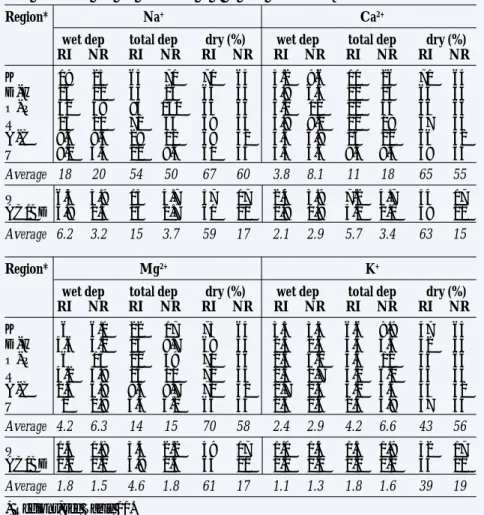
Table 11. Comparison between estimated deposition of Na+, Ca2+, Mg2+ and K+ by the
MATCH model (MM) and the Na-ratio (NR) incl. sea salt (meq/m2 per year) as wet
and total deposition and dry deposition in % of total deposition.
Region* Na+ Ca2+
wet dep total dep dry (%) wet dep total dep dry (%) MM NR MM NR MM NR MM NR MM NR MM NR K 22 24 27 37 21 35 9.0 10 10.0 16 10 35 D-H 14 11 22 20 25 43 7.0 9.1 8.0 16 13 43 O-P 34 61 44 100 21 39 7.5 12 8.8 19 13 39 R 16 15 22 25 28 40 5.3 5.7 6.3 9.0 17 40 A-C 8.3 7.8 12 18 32 57 4.5 6.6 5.5 15 17 57 U 7.8 7.7 12 10 36 23 5.5 7.5 6.5 10 15 23 Average 17 21 23 35 26 40 6.5 8.5 7.5 14 13 39 W 8.7 7.7 14 5.8 38 neg 5.3 6.8 6.0 6.8 13 neg
AC-BD 4.1 7.4 8 4.8 49 neg 3.4 6.5 3.8 6.5 11 neg
Average 6.4 7.6 11 5.3 42 neg 4.4 6.7 4.9 6.7 11 neg
Region* Mg2+ K+
wet dep total dep dry (%) wet dep total dep dry (%) MM NR MM NR MM NR MM NR MM NR MM NR K 6.7 7.3 8.3 11.1 21 35 3.2 3.9 3.6 6.0 12 35 D-H 4.6 4.3 6.1 7.4 24 43 2.3 3.5 2.7 6.2 14 43 O-P 9.2 15 11.3 24 20 39 2.7 5.9 3.1 9.7 13 39 R 4.8 4.3 6.7 6.8 28 40 2.1 2.6 2.4 4.1 14 40 A-C 3.6 3.5 4.2 7.9 28 57 1.8 2.5 2.1 5.7 14 57 U 3.6 3.3 4.2 4.3 28 23 2.0 2.9 2.3 3.9 12 23 Average 5.4 6.2 6.8 10.3 21 40 2.4 3.6 2.7 5.9 11 39 W 2.7 2.0 4.2 2.0 36 neg 1.9 2.9 2.2 2.9 12 neg
AC-BD 1.4 2.1 2.3 2.1 37 neg 1.6 3.5 1.8 3.5 10 neg
Average 2.1 2.1 3.3 2.1 36 neg 1.8 3.2 2.0 3.2 10 neg
* County codes: K = Blekinge, D-H = Södermanland to Kalmar, O-P = Bohuslän, Älvsborg, R = Skaraborg, A-C = Stockholm, Uppland, U = Västmanland, W = Kopparberg, AC/BD = Väster-/ Norrbotten