Landfills in Arid Environment
Nadhir Al-AnsariDepartment of Civil, Environmental and Natural Resources Engineering Lulea University of Technology
Abstract
Protection of the environment from hazardous solid waste is becoming a serious problem. Different laws and legislations had been put into practice for this purpose. The effect of solid waste in developing countries with limited financial and natural resources and high population growth rate is more severe. To overcome these difficulties, prudent management system for solid waste is required. Furthermore, solid waste disposal site should be selected using scientific criteria to prevent any harmful effect on local communities and the environment.
Criteria for solid waste disposal dump site for arid and semi arid regions should be selected in accordance with well known international requirements that suit the local conditions. These criteria can be used to select the best suitable solid waste dump site using remote sensing and geographic information system techniques. The selected sites are harmless to human life, natural resources and the environment. The same can be achieved when dumping hazardous solid waste. In all cases however, priorities of the site selection criteria should meet the existing geological, meteorological and environmental conditions.
1. Introduction:
Human activities (Industrial, domestic, commercial and construction) and animals generate solid waste in many forms. Some of the waste fall out of the commercial use i.e. can not be utilized. Parts of this waste (specially the industrial part) are considered hazardous to the environment and natural resources. With continuous population growth and increase of standard of living, solid waste is increasing in tremendous amounts. This fact enforced a major problem facing the world.
The problem is more serious in third world countries where 80% of the world population live (Pearce and walker, 1996, Jackson, 1996) and due to the lack of financial resources. It is believed that about 10% of each person's production life is lost as a result of waste related diseases (Pearce and Walker, 1996). These facts led to an increasing awareness of solid waste hazards on an international level. Consequently, legislations and laws developed since the mid of the twentieth century (e.g. UN conference in Stockholm, 1972; Earth Summit in Rio de Janeiro, 1992, in Aldiab, 2000). It is noteworthy to mention that improper solid waste management will causes air, soil and water pollution. The overall objectives of such measures are to ensure sustainable development and management of waste in sound manner to minimize its effects on human and the environment.
2. Municipal Solid Waste (MSW)
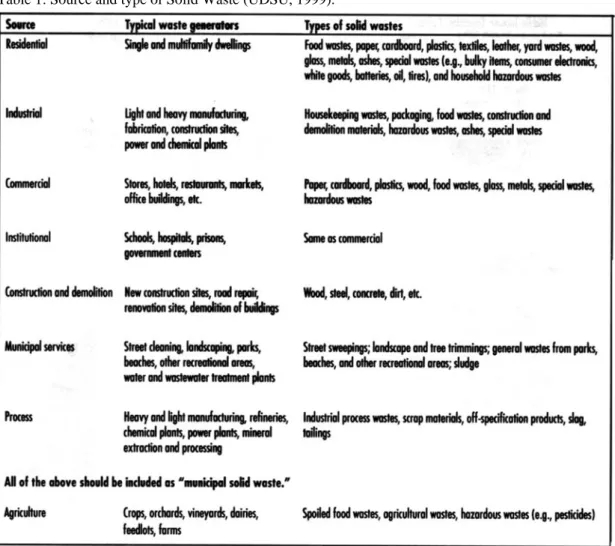
Solid waste source and type is generally related to the use and place. There are number of classifications for the solid waste. Generally, we can divide the solid waste into: residential, industrial, commercial, institutional, construction and demolition, municipal services, process and agricultural (Table 1).
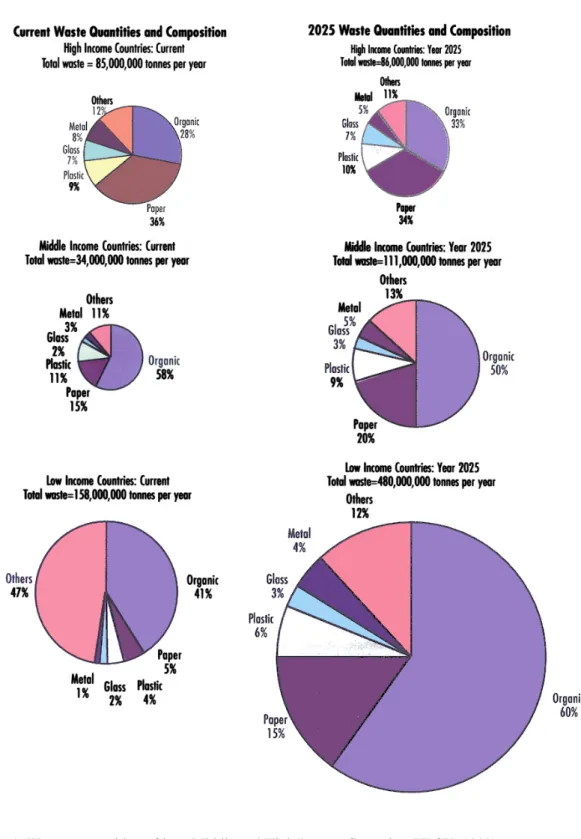
The composition of the waste is influenced by several factors such as geographical location, standard of living, energy source and weather. It also varies in low, middle and high income countries (Figure 1).
Low and middle income countries have high percentage of organic mater in MSW ranging from 40 to 85 % of the total. Paper waste in high income countries is usually higher than it is in low and medium income counties.
Figure 1: Waste composition of low, Middle and High Income Countries (UDSU, 1999).
3. Solid Waste Generation Rates:
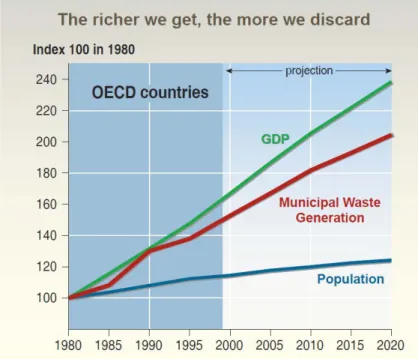
Waste quantities are closely linked with population density, economic activities and resources consumption (Figure 2). The data given by UDSU (1999) indicates that the present day MSW generated reaches 277 million tones per year. High income countries generate 30.7% of that waste
while 12.2% and 57.1% are generated in middle and low income countries. This figure is expected to increase to 677 million tones in 2025. The percentage of waste generated in high income countries will be 12.7% while it will be 16.4 and 70.9 % in middle and low income countries respectively.
Figure 2: Population growth and GDP relationship with MSW generation.
UDSU (1999) stated that low income countries has the lowest percentage of urban population and the lowest generation rates (0.4 to 0.9 kg/capita/day) while it is 0.5 to 1.1 kg/capita/day and 1.1 to 5.07 kg/capita/day n middle and high income countries respectively. It is evident that people in rural areas produce less waste compared to urban areas due to their lower per capita income. Developing countries are experiencing high population growth in urban areas compared to rural areas (World Resources Institute, 1996). It has been estimated that, urban to rural migration accounts for 40 to 60 % of the annual population growth in developing countries (McGee and Griffiths, 1993).
Waste composition changes when countries become richer. This is reflected by the increase in the use of paper and paper packing, plastics, multimaterial items and consumer products. In low and middle income countries in Asia, it is believed that the waste production will be tripled in 2025 than it was in the nineties (UDSU, 1999). Low income countries in 2025 will produce twice as much waste (480 million tones) than all middle and high income countries (UDSU, 1999).
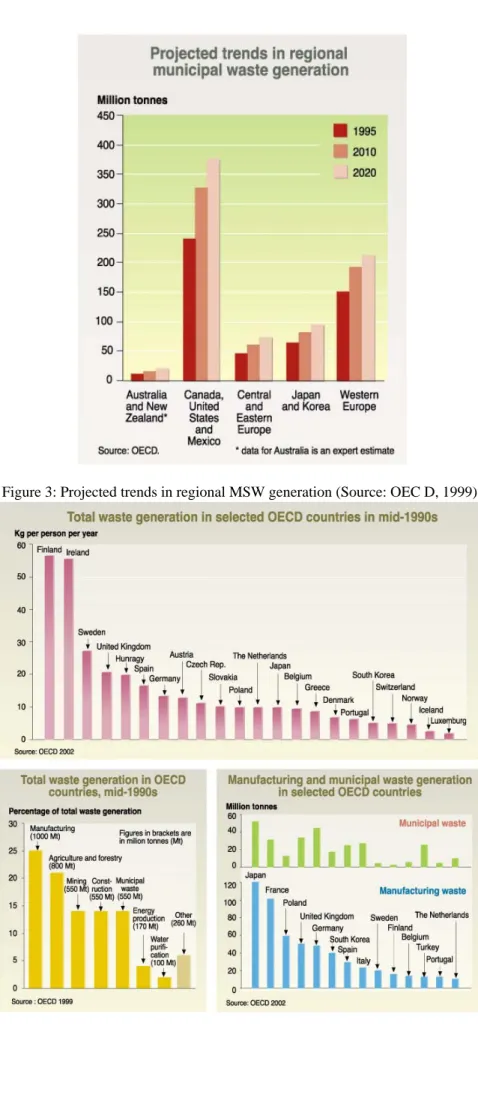
According to the Organization of Economic co-operation and Development (OECD), SA and Canada produce waste more than other countries. They are followed by Western Europe, Japan and Korea and Australia and New Zealand (Figure 3). Figure 4 shows how the rate of waste generation varies within the OECD countries. Hazardous waste production is about 150 million tones per year in year 2000 (Chandak, 2010) (Figure 5).
Figure 4: MSW generation within OECD countries.
Figure 5: Global hazardous waste generation (Chandak, S.P. 2010).
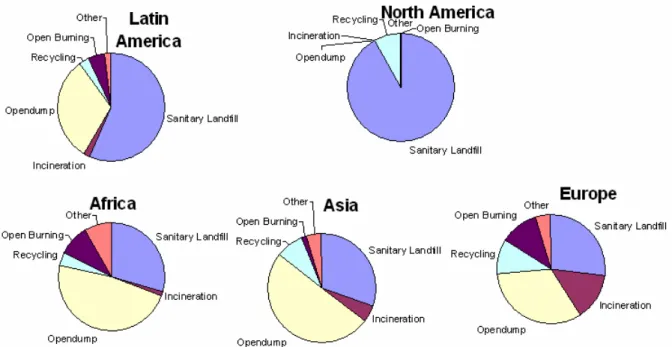
MSW management practices vary from place to another. Figure 6 shows the common practices used all over the world. Open dump practices are used in Asia, Africa, South America and Europe. Recycling is relatively higher in North America and Europe; sanitary landfills are more widely used in America.
4. Site selection criteria:
Selecting a landfill site is a difficult task. In doing so, we have to take care of several factors. Among these factors is its effect on humans, environment, water resources, air, and soil as well as other utilities like transportation and power supply. In addition the landfill should have sufficient capacity to meet the current and projected waste to be deposited within at least 10 years. Number of criteria had been proposed for landfill sitting (BCRC, 2005, Tchobanoglous, et al., 1993, Ministry of the Environment, 2004, Canadian Council of Ministers of the Environment, 2006, McDougall et al, 2003, EPA, 1993). The most important points to be recognized in landfill sitting are:
4.1. Distance from Cities and Towns: To minimize the effect of landfill o human health it should be located at least 3 km from the nearest town.
4.2. Distance from Airports: To overcome birds interrupting aircrafts landing and taking off, it is advisable that the landfill should be at a distance of 3km or more away from the runway.
4.3. Distance from primary Highways: The land fill should not be very close to highways and this depends on the topography of the area and access roads.
4.4: Distance from Public parks and recreation areas: The distance of the landfill from parks and recreation areas depends on the topography and the prevailing wind direction.
4.5. Groundwater: Water table should be deep enough to prevent leakage to groundwater aquifers. The landfill should be away from groundwater recharge areas. In cases of failure, the ground water flow direction should be in such a direction causing minimum pollution.
4.6. Soil: It is preferable that the existing soil has low permeability (106 cm/s). 4.7. Flood plain areas: Areas that might be flooded should be avoided.
4.8. Surface water: The landfills should be at least 200 meters away from streams and stream valleys or lakes.
4.9. Topography: The land fill is to be located in an area where local drainage is running away from its site. In addition the landfill site should not be located in an area where flush flood might take place. 4.10. Biodiversity: The site should be located at least I kilometer away from protected areas or areas used for breading or living animals. It is recommended that the site should be away from borrowing animals.
4.11. Geology: Faulted areas and karsts terrains are to be avoided. Sand dune movements should be studied and landfills are to be located away from such dunes. Areas with rocks having cracks or joints should be avoided, also areas having sinkholes or karsts are to be avoided.
4.12. Seismicity: The area should be seismically stable. Near by reservoirs are to be avoided due to possible induced sciesmicity.
4.13. Meteorology: Rainfall duration and intensity, temperature, humidity and wind speed and direction must be considered when sitting a landfill.
The priorities of the above conditions will vary from place to another depending on the population distribution, meteorological, geological and hydrological conditions.
5. Solid waste in Jordan: Case study.
The source of solid waste in Jordan can be attributed to the following sources: 1- Municipal Residential waste
2-Commercial waste
3- Residual waste from waste water treatment plants 4- Industrial waste
5- Institutional waste 6- Agricultural waste
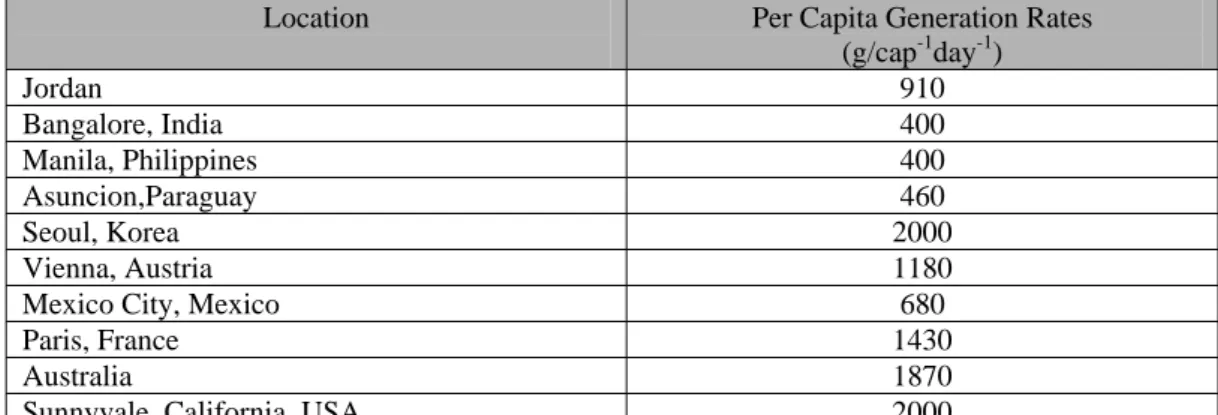
The average waste is in the range of 0.34 to 1.07 kg/Ca/day (average 0.91 kg/Ca/day) (Table 2). This figure corresponds to similar figures in developing countries but they are far less than it is in developed countries (Table 2).Furthermore, most of the solid waste (50 – 68%) is of organic nature (Table 3).
The average daily municipal waste in Jordon is about 3700 ton/ day. All solid waste is dumped in 24 sites. Seven sites (in north Jordan) receiving a daily average waste of about 680 ton/ day. In the central and southern parts of Jordan the daily average waste received is 2620 and 400 ton/ day respectively. These amounts are received by 17 dumping sites (Table 4) in central (7 sites) and southern (10 sites) parts of Jordan.
Table 2: Comparison of solid waste generation rates in Jordan with other countries (Chopra et al., 2001)
Table 3: Comparison of the Jordan Solid Waste contents with other Countries (GCEP, 2001) The percentage per weight
Waste Kind Jordan Asian Countries UK USA
Organics 50-68 75 3.6 20
Papers 5-10 2 31.2 43
Metals 3-6 0.1 5.3 7
Glass 2-5 0.2 3.8 9
Plastics 4-6 0.1 5.2 5
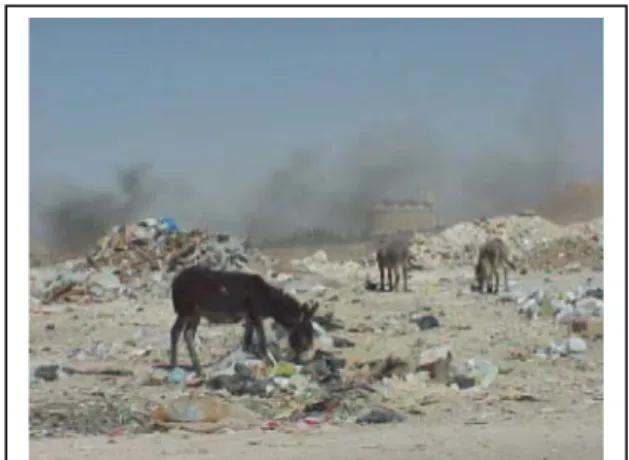
Site selection criteria in Jordan did not take into account the effect on the environment and natural resources. Examples of such sites are Russaiyfa waste disposal site where it is located on a phosphate mine. This mine in turn is underlain by an important groundwater aquifer. In general all the sites receive untreated medical and industrial waste. In addition, within these sites no liner systems are used. Other sites however, burn the waste in open air (Figure 7) or used as open dump a (Figures 8 and 9). In view of these conditions the Environment Conservation Organization reported the environmental conditions and possible solutions for the existing problems within these sites (Chopra et al , 2001). Management practices of solid waste are not performed in a prudent way. Recycling and waste selection for reuse is performed by locals (Figure 10) before compaction. As an example 98% of glass bottles are returned back to manufactures. Recycling exercise is becoming more important with time where a number of items are picked and used again in various industries.
Solid waste management and disposal sites in Jordan are poorly operated. These sites are source of potential hazards to the public, natural resources and the environment. Lack of regulations, national waste management policy or guidelines makes the problem worst. In addition, the problem becomes more sever with the lack of financial resources and lack of trained personnel and the absence of any adequate records concerning quality and quantity of solid waste.
Location Per Capita Generation Rates
(g/cap-1day-1) Jordan 910 Bangalore, India 400 Manila, Philippines 400 Asuncion,Paraguay 460 Seoul, Korea 2000 Vienna, Austria 1180
Mexico City, Mexico 680
Paris, France 1430
Australia 1870
Table4: Solid waste disposal sites in Jordan (Chopra et al, 2001)
Region Disposal site Location Area (Donum) Capacity (Ton/ day)
Northern Ekaider Ramtha 806 350
Northern Mafraq Mafraq 180 100
Northern Kufrangah Ajlun 71 90
Northern N.Shunah N.Shunah 78 100
Northern Jiebah Irbid 60 30
Northern Alsaru Benikananah 55 80
Northern Um Alkutain Mafraq 400 30
Central Russaifah Russaifah 1200 2200
Central Madabah Madabah 80 150
Central Alhamrah Salt 275 140
Central Dhulail Dhulail 70 70
Central Dhiban Madabah 30 20
Central Dier Ala Central Ghour 200 30
Central Azraq Azraq 48 10
Southern Aqaba Aqaba 60 80
Southern Maan Maan 502 50
Southern Karak Karak 600 85
Southern Tafielah Tafielah 450 50
Southern Shubak Shubak 26 20
Southern Aiel Maan 280 20
Southern Alkuwarah Aqabah 270 20
Southern Alhusainiyah Alhusainiyah 100 15
Southern S. Shunah S,shunah 10 40
Southern Ghor Alsafi South Ghour 153 20
Figure7: Burning waste at a dumping Site (Chopra et al, 2001)
Figure 8: Open dump site for solid waste (Chopra et al, 2001)
Figure 9: View of a solid waste dump site (Chopra et al, 2001)
Figure 10: Manual waste selection (Chopra et al, 2001) 5.1. Solid Waste in Mafraq:
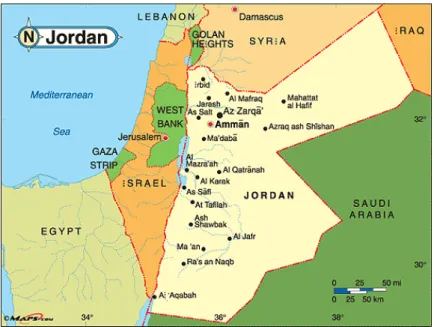
Mafraq city is located in the northern part of Jordan (long 36 7'30 "E lat 32 15- 32 22' 30" N) about72 Km north of Amman (Fig 11). Mafraq Governorate covers an area of 26435 square km while Mafraq city area is about 46 square km (Fig 12) which is characterized by its relatively flat topography (Al-Ansari and Baban, 2001). The total population of the Governorate in the year 2000 is 232300 (Statistics Department, 2000) while 47105 people live within Mafraq city. The rate of population growth reaches 3.93%. About 40% of the area of the city is used as residential purposes while 52% is used for agricultural purposes. The remainder is used for commercial, industrial public buildings etc (Table 5).
Figure 11: Map of Jordan. Table 5: Land use in Mafraq.
Type of USE Area Donum %
Residential 9130.6 39.9 Agricultural 11988.3 52.3 Commercial 490.1 2.14 Industrial 471.5 2.1 Gardens 51.2 0.2 Public Buildings 279.2 1.22 Cemetery 66.6 0.29 National parks 43302 1.9 Total 22910.6 100.00
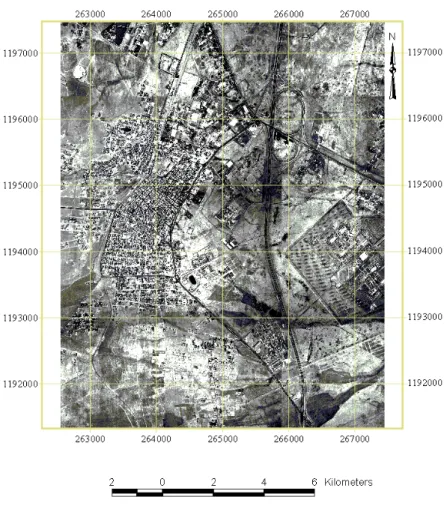
Figure 12: Mafraq city.
Eight types of solid wastes can be recognized in Mafraq. They are: residential commercial, industrial, agricultural, housing construction, institutional, municipal and waste water treatment plants. Within the city daily waste reaches 44tons, and ordinary residential and commercial waste forms more than 80% of the overall average (Table 6). The daily waste management is done through126 employees using 16 types of vehicles and 400 rubbish containers. The cost of management and disposal for each ton of waste reaches 16.6 JD.
Alhusainiyat solid waste disposal site was constructed in 1986 covering an area of 180 donums. Forty seven persons run this site. The site receives 134 tons of waste daily from 64 villages including Mafraq city. The cost of solid waste treatment reaches 4.3 JD per ton. Selection of individual waste is executed manually and the remainder is dumped and covered by 50 cm layer of soil.
Table 6: Type of waste in Mafraq
Waste type Daily Rate (ton)
Residential 19 Commercial 17 Institutional 5 Municipal 3 Total 44
5.2. Mafraq solid waste disposal site:
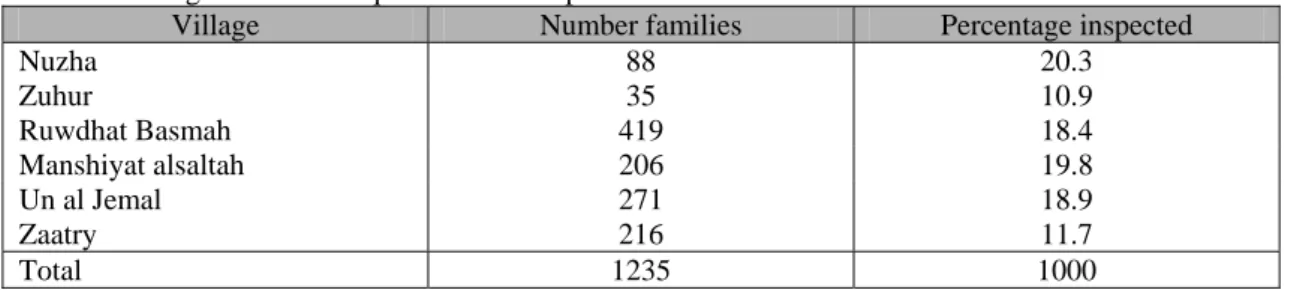
Six main villages are situated within the vicinity of the disposal site (Table 7). It was noticed that the site enhanced the existence of different type’s harmful creatures, relative to other areas (Table 8).
Table 7: Villages near Mafraq solid waste disposal site
Village Number families Percentage inspected
Nuzha 88 20.3 Zuhur 35 10.9 Ruwdhat Basmah 419 18.4 Manshiyat alsaltah 206 19.8 Un al Jemal 271 18.9 Zaatry 216 11.7 Total 1235 1000
Table 8: type of creatures within the vicinity of Mafraq solid waste disposal site Type
Location Nuzha Zuhur R. Basma M.Alsultah U. Jemmal Zaatri
Insects 33.7% 27.8% 37% 41% 40.9% 47.7
Fly 34% 22.7% 36.1% 34.4% 39.8% 46.3
Mice 10.7% 13.3% 3.8% 8.7% 7.7% -
Worms 18% 2.9% 15.4% 15.9% 11.6% 6.%
All above 3.6% 33.3% 7.7% - - -
In addition it was found that these communities suffer from different types of disease (Table 9). Places closer to the site was found to be highly affected relative to other places. During summer the negative effects of the site are more pronounced.
Table 9: Type of sickness distribution near the solid waste disposal site. Location
Disease Nuzha Zuhur R. Bamah M. alsaltah
Unm
Head ache 10.7% - 7.7% 40.7% 50% 18.8% Worms - 13.3% - 7% - - Diyoria - - 3.8% - 7.7% 6.3% Canser - 6.7% - - - - Poisining 14.3% - 19.2% 14.8% 15.4% 6.3% Flu 14.3% 6.7% - - - - Sensitivity - - 38.5% 3.7% 3.7% - Respiration - 13.3% 19.2% 3.7% 3.8% -
5.3. Solid Waste Site Selection Using Remote Sensing (RS) and Geographic Information Systems (GIS):
One of the biggest challenges is the proper site selection for solid waste disposal for its direct effect on the community and the environment (Davis and Cornwell, 1991). For this purpose the United States Environmental Protection Agency set in November, 1993 principle outlines to be considered in this process.
Remote sensing and GIS techniques are very useful tools to be used for solid waste dump sites. For this reason these techniques were used to select the best possible dump site within the vicinity of Mafraq city. This was achieved using 18 aerial photographs (scale 1: 10000) taken in the year 2000 to construct the data layers showing roads and extension of Mafraq city (Figure 12). In addition topographic, geologic and land use maps of various scales were also used. Other data concerning ground water wells, water table depth and meteorological data were obtained from the files of the Ministry of Water and Irrigation. All the maps used were digitized using different software (Auto CAD 14, Arc/ Info 7.2., and 8, Arc View 3.1, Geomedia Professional 4.0 and Arc View Spatial Analyst) and (Figures 13 to 20) show the results of these maps.
The data used in the analysis were as follow: 1- Topographic contours
2- Water drainage systems 3- Roads
4- Geology 5- Type of land use 6- Ground water levels
7- Rain intensity and distribution
Figure 16: Digitized slope of the topographic map for Mafraq
Figure 17: Digitized land use map of Mafraq
All the maps were reconstructed in a "Grid" which is Raster Data composed of vertical and horizontal rows. This will enable Arc View 3.1 (Spatial Analyst) software to analyze the data. The conditions set for the analysis were based on the USA and EU regulations taking into consideration the special conditions related to the studied area. These conditions were:
1. The distance of the dump site should exceed 500 m to the nearest village. 2. The dump site should be close to roads for easy access.
3. The rocks should be impermeable to ensure protection of ground water resources. 4. The dump site should be at least 60m away from faults and joints.
5. Ground water should be deep enough to ensure protection from leaking material.
6. The dump site should be at least 500 meters away from the nearest ground water well to prevent pollution.
7. The area to be used as a dumping site should not fall within the category of agricultural land.
8. The site to be used should be at least 200 meters away from the nearest valley or drainage system to ensure that draining water does not transport the waste dumped.
9. The area to be selected should be nearly flat (slope should be less than 4). 10. Average rainfall should be low on the selected site.
5.4. Results:
Using the Arc View GIS (Spatial Analyst) different solid waste disposal sites (SWDS) were selected according to the conditions given. The first group represents the best site conditions relative to others (Figure 21) where the most restrict conditions were applied (Table 9 and Figure 21). Accordingly, ten sites were selected (Figure 21) with a total area of 74.5 donums. Fewer restrictions were used for the remainder five groups (Table 9) concerning the elevations and type of rocks (Figures 22,23,24,25 and 26) the overall selected sites covers an area of about 245 donums.
Table 9: Site selection criteria for different groups for solid waste disposal sites.
Criteria used Conditions used
Group 1 Group 2 Group 3 Group 4 Group 5 Group 6 Distance to nearest village >1000m >1000m >1000m >1000m >1000m >1000m Distance from faults or joints >60m >60m >60m >60m >60m >60m Distance from drainage
systems
>200m >200m >200m >200m >200m >200m Distance from ground water
wells >500m >500m >500m >500m >500m >500m
Distance from nearest road <300m <300m <300m <300m <300m <300m
Type of rocks Soil Soil Soil Soil Rocks Rocks
Slpe of Land <4 -- -- -- -- --
Type of Land Unused Unused Unused Not good for crops Not good for crops Not good for crops Elevation <700m <700m >700m <700m >700m <700 Area (Donum) 74.5 74.5 76.3 6.0 70 8
Figure 21: The first group of the suggested solid waste deposal sites within Mafraq city.
Figure(20): The fourth group of the suggested solid waste deposal sites within Mafraq city
6. Conclusions:
Solid waste management and disposal in most of the cities in developing countries at its present status does not fulfill the required international conditions. Furthermore, high rate of population growth and the movement of people from rural to urban areas will inevitably make the problem more sever. Most of the developing countries are progressively having a higher standard of living. This will also inevitably increases the generation of solid waste. All these factors will cause tremendous increase in generation solid waste in the near future.
To overcome this problem, prudent site selection criteria and management strategies are to be adopted based on scientific knowledge. Local conditions are to be considered when applying such measures due to the effect of local environmental conditions on the criteria to be adopted.
Despite the fact that some disposal sites had been found fulfilling the conditions set by the international community, other conditions concerning the management process should be also fulfilled.
7. References:
Al-Ansari, N.A. and Baban, S, 2001, The Climate and Water Resources, in: Baban, S. and Al-Ansari, N.A, (Eds.), Living With Water Scarcity, Water resources in the Jordan Badia Region, The Way Forward, Chapter 3, Al al-Bayt University Publication, Jordan.
Aldiab, S., 2000, The gap between planning and execution of environmental polocies in Jordan:A case study of Jordan valley, M.A. thesis, Al al-Bayt University.
BCRC, 2005, Preparation of a set of tools for the selection, design and operation of hazardous waste landfills in hyper – dry areas, Regional Center for Training and technology Transfer for the Arab States, 55.
Canadian Council of Ministers of the Environment, 2006,National Guidelines For Hazardous Waste Landfills, Pn 1365, 108.
Chandak, S.P. 2010, Trends in Solid Waste Management: Issues, Challenges and Opportunities International Consultative Meeting on Expanding Waste Management Services in Developing Countries 18-19 March 2010 Tokyo, Japan.
Chopra M, Reinhart D and Abu-El-Shaar W ,2001, US-Jordan Municipal Solid Waste Management Collaborative Research, FINAL REPORT.
EPA US-Environmental Protection Agency of United State,1993, Municipal Solid Waste Landfill Criteria. Found at: wysiwyg://15/http://www.epa.gov/epao swer/non-hw/muncpl/landfill techman.
Jackson, B., 1996, International Institutions, in Baily, R. (ed), Water and Environmental Management in developing countries.
McDougall F. R., White, P. R., Franke, M. and Hindle, P., 2003, Integrated Solid Waste Management: a Life Cycle Inventory ,second edition, Blackwell Science, 532.
McGee, T.G. and C.J. Griffiths, 1993, Global Urbanization: Towards the twenty-First Century. Population Distribution and Migration. Draft proceedings of the United Nations Expert Meeting on Population Distribution and Migration, Santa Cruz, Bolivia, January 18—22 (United Nations, New York, August, 1994).
Ministry of the Environment, 2004,Landfill Waste Acceptance Criteria And Landfill Classification, Ministry of the Environment, New Zealand, 33.
Pearce,D. and Walker, Ch., 1996, Sustainable Development, in Baily, R. (ed), Water and Environmental Management in devloping countries.
Tchobanoglous, G., Theisen, H., and Vigil, S.A.,1993, Integrated solid waste management. Mc Graw-Hill, Inc., New York.
UDSU(Urban Development Sector Unit), 1999, What a Waste: Solid Waste
Management in Asia, Report published by The International Bank for Reconstruction and Development/THE WORLD BANK, 45.
East Asia and Pacific Region World Resources Institute, 1996,World Resources: A Guide to the Global Environment, The Urban Environment, 1996—97. Oxford University Press, Oxford, United Kingdom.