ACTA UNIVERSITATIS
UPSALIENSIS
Digital Comprehensive Summaries of Uppsala Dissertations
from the Faculty of Medicine
1049
Improving the Quality and Safety of
Drug Use in Hospitalized Elderly
Assessing the Effects of Clinical Pharmacist
Interventions and Identifying Patients at Risk of
Drug-related Morbidity and Mortality
ANNA ALASSAAD
Dissertation presented at Uppsala University to be publicly examined in Aula Gunnesalen, Ingång 10, Akademiska sjukhuset, Uppsala, Thursday, 11 December 2014 at 09:15 for the degree of Doctor of Philosophy (Faculty of Medicine). The examination will be conducted in English. Faculty examiner: Dr Lene Juel Kjeldsen (The Danish Research Unit for Hospital Pharmacy, Amgros, Denmark).
Abstract
Alassaad, A. 2014. Improving the Quality and Safety of Drug Use in Hospitalized Elderly.
Assessing the Effects of Clinical Pharmacist Interventions and Identifying Patients at Risk of Drug-related Morbidity and Mortality. Digital Comprehensive Summaries of Uppsala Dissertations from the Faculty of Medicine 1049. 65 pp. Uppsala: Acta Universitatis
Upsaliensis. ISBN 978-91-554-9088-1.
Older people admitted to hospital are at high risk of rehospitalization and medication errors. We have demonstrated, in a randomized controlled trial, that a clinical pharmacist intervention reduces the incidence of revisits to hospital for patients aged 80 years or older admitted to an acute internal medicine ward. The aims of this thesis were to further study the effects of the intervention and to investigate possibilities of targeting the intervention by identifying predictors of treatment response or adverse health outcomes.
The effect of the pharmacist intervention on the appropriateness of prescribing was assessed, by using three validated tools. This study showed that the quality of prescribing was improved for the patients in the intervention group but not for those in the control group. However, no association between the appropriateness of prescribing at discharge and revisits to hospital was observed.
Subgroup analyses explored whether the clinical pharmacist intervention was equally effective in preventing emergency department visits in patients with few or many prescribed drugs and in those with different levels of inappropriate prescribing on admission. The intervention appeared to be most effective in patients taking fewer drugs, but the treatment effect was not altered by appropriateness of prescribing.
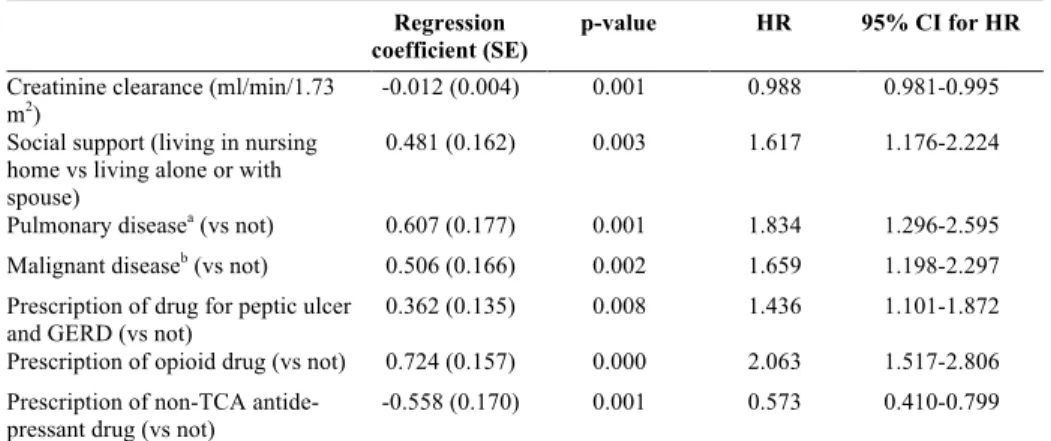
The most relevant risk factors for rehospitalization and mortality were identified for the same study population, and a score for risk-estimation was constructed and internally validated (the 80+ score). Seven variables were selected. Impaired renal function, pulmonary disease, malignant disease, living in a nursing home, being prescribed an opioid and being prescribed a drug for peptic ulcer or gastroesophageal reflux disease were associated with an increased risk, while being prescribed an antidepressant drug (tricyclic antidepressants not included) was linked with a lower risk. These variables made up the components of the 80+ score. Pending external validation, this score has potential to aid identification of high-risk patients.
The last study investigated the occurrence of prescription errors when patients with multi-dose dispensed (MDD) drugs were discharged from hospital. Twenty-five percent of the MDD orders contained at least one medication prescription error. Almost half of the errors were of moderate or major severity, with potential to cause increased health-care utilization.
Keywords: Adverse drug events, inappropriate prescribing, medication errors, polypharmacy,
medication reconciliation, medication review, patient drug counseling, multi-dose dispensed drugs, risk-estimation, multiprofessional collaboration, prediction model, quality measure, rehospitalization
Anna Alassaad, Department of Medical Sciences, Akademiska sjukhuset, Uppsala University, SE-75185 Uppsala, Sweden.
© Anna Alassaad 2014 ISSN 1651-6206 ISBN 978-91-554-9088-1
Start where you are. Use what you have. Do what you can.
List of Papers
This thesis is based on the following papers, which are referred to in the text by their Roman numerals.
I Gillespie U, Alassaad A, Hammarlund-Udenaes M, Mörlin C, Henrohn D, Bertilsson M, Melhus H. (2013) Effects of pharma-cists’ interventions on appropriateness of prescribing and evalu-ation of the instruments’ (MAI, STOPP and STARTs’) ability to predict hospitalization – analyses from a randomized con-trolled trial. PloS One. 2013;8(5):e62401.
II Alassaad A, Bertilsson M, Gillespie U, Sundström J, Hammar-lund-Udenaes M, Melhus H. The effects of pharmacist interven-tion on emergency department visits in patients 80 years and older: subgroup analyses by number of prescribed drugs and appropriate prescribing. PLoS One 2014; 9(11): e111797. III Alassaad A, Melhus H, Hammarlund-Udenaes M, Bertilsson M,
Gillespie U, Sundström J. A tool for risk-estimation of rehospi-talisation and mortality in older people. Submitted Sept 2014. IV Alassaad A, Gillespie U, Bertilsson M, Melhus H,
Hammar-lund-Udenaes M. (2013) Prescription and transcription errors in multidose-dispensed medications on discharge from hospital: an observational and interventional study. J Eval Clin Pract. 2013
Feb;19(1):185-91.
Contents
Introduction ... 11
Drug use in older people ... 11
Adverse drug events ... 11
Inappropriate prescribing ... 12
Medication errors ... 12
Non-adherence to treatment ... 12
Polypharmacy ... 13
Quality of care and how to measure it ... 13
Quality measures ... 14
Outcome assessment ... 14
Process assessment ... 15
Structure assessment ... 15
Pharmaceutical care and clinical pharmacy practices ... 16
Medication reconciliation ... 16
Medication review ... 17
Drug counseling to patients ... 17
Multi-dose dispensed drugs and bedside dispensing ... 17
Measuring the effects of clinical pharmacist intervention ... 18
Outcome assessment ... 19
Process assessment ... 20
The 80+ study ... 21
Subgroup analyses ... 23
Identifying areas for quality improvement ... 24
Identifying high-risk areas and measuring quality of care ... 24
Identifying high-risk patients ... 25
Aims ... 26
Methods ... 27
Population ... 27
Assessment of appropriateness of prescribing (Paper I) ... 28
STOPP and START ... 28
MAI ... 29
Subgroup analyses (Paper II) ... 29
Development of a score for risk prediction (Paper III) ... 30
Statistical analyses ... 31 Paper I ... 31 Paper II ... 32 Paper III ... 32 Paper IV ... 32 Ethical considerations ... 33 Summary of findings ... 34 Paper I ... 34 Paper II ... 35 Paper III ... 37 Paper IV ... 40 Discussion ... 42 Conclusions ... 46 Future perspectives ... 47
Summary in Swedish (Sammanfattning på svenska) ... 49
Acknowledgements ... 52
Abbreviations
ADR Adverse drug reaction
RCT Randomized controlled trial
ADE Adverse drug event
MAR Medication administration record
MDD Multi-dose dispensing
DRP Drug-related problem
QALY Quality-adjusted life years
STOPP Screening Tool of Older Persons’ Prescriptions START Screening Tool to Alert Doctors to Right Treatment
MAI Medication Appropriateness Index
SALAR Swedish Association of Local Authorities and Regions
PCA Principal components analysis
GERD Gastroesophageal reflux disease
Introduction
Drug use in older people
Advances in medicine have resulted in increased survival and symptom re-lief for patients with chronic illnesses, and the numbers of fit, healthy older people are increasing. At the same time, there are increasing numbers of frail, vulnerable elderly who have multiple co-existing diagnoses and an increased need for health care. The use of medicines has become a funda-mental component of the care of older people. The prescribing of drugs for patients aged 75 years and older has increased by 70% in the last 20 years, and older people living in nursing homes in Sweden are now taking an aver-age of 8-10 prescribed medications (1). Due to physical pharmacokinetic and pharmacodynamic changes, older people are increasingly sensitive to the unwanted effects, such as adverse drug reactions (ADRs), of the drugs. There is also greater inter-individual variability in this population, which necessitates individualized treatment plans (2–4). With a growing number of older people with complex medication regimens, it is crucial that our aware-ness of medication-related issues is improved in order to reach a high quality of care for this population.
Clinical pharmacists involved in multidisciplinary health-care teams focus on increasing the quality and safety of drug therapy. Our research group has in a randomized controlled trial (RCT) previously demonstrated that a clini-cal pharmacist intervention reduces the number of revisits to hospital and drug-related readmissions (5). Additional knowledge about the intervention can be gained by assessing the impact of the different parts of the clinical pharmacist intervention. Future cost-effective interventions can be designed to include the patients at most need and who will benefit the most, by identi-fying risk factors of adverse health outcomes and predictors of response to the intervention.
Adverse drug events
The World Health Organization defines an ADR as “a response to a drug which is noxious and unintended, and which occurs at doses normally used in man for the prophylaxis, diagnosis, or therapy of disease, or for the modi-fications of physiological functions”(6), i.e. harm directly caused by the drug
at normal doses. An adverse drug event (ADE) describes a broader scenario, defined as “an injury resulting from the use of a drug” (7) which includes a harm caused by the drug itself (i.e. ADRs) and also harm caused by the use of the drug (8). Inappropriate prescribing, medication errors and poor patient adherence to drug therapy are examples of suboptimal use of drugs which can cause ADEs (9). ADEs can result in drug-related morbidity and mortali-ty, and are the main cause of up to a third of the hospital admissions in the elderly population (9–15).
Inappropriate prescribing
Inappropriate prescribing can be divided into three types: overprescribing (prescription of more drugs than are clinically needed), misprescribing (in-correct prescription of a drug that is needed), and underprescribing (failure to prescribe drugs that are clinically needed). Overprescribing often occurs when drug therapy is not adequately re-evaluated over time, with many med-ications continuing to be prescribed despite the patient no longer having the diagnosis for which the medication was originally intended. Misprescribing occurs when medicines that pose a significant risk of ADRs are prescribed, when there is an equally effective or more effective lower-risk alternative therapy available for the same condition. It can also occur when a drug is prescribed at a suboptimal dose, formulation or dosage interval, or when drugs with known drug-drug interactions or drug-disease interactions are prescribed. Underprescribing is sometimes associated with a phenomenom called ageism; i.e. prescribers may decide not to prescribe a drug or not to increase the dosage of a drug merely because the patient is old (16–20).
Medication errors
Medication errors are any errors in the process of prescribing/ordering, tran-scribing, dispensing or administering of a drug (21). Trantran-scribing, dispens-ing or administerdispens-ing errors are all technical errors. In the prescrib-ing/ordering process, a medication error can either occur in the decision-making process or be of a technical nature (22).
When patients are transferred between different levels of health care, un-intentional discrepancies in the prescribing/ordering or transcribing process can happen. These discrepancies are highly prevalent (23–27), they are an important contributor to ADEs (25,28) and are associated with risk of re-hospitalization (29).
Non-adherence to treatment
Medication adherence can be defined as the extent to which a person follows medical advice in the use of a drug, with respect to the correct dose and
dos-age interval (30). Non-adherence to prescribed treatment occurs commonly; around one-third of older patients are estimated to be non-adherent to at least one of their drugs (31–33). Col et al. interviewed older patients admitted to hospital and found that 11% of medical admissions to hospital were due to medication non-adherence (10). In several studies, non-adherence to drug treatment was associated with increased risk of hospitalization and mortality, as well as increased costs for those with chronic diseases (34–37). Non-adherence – intentional as well as unintentional – may be the result of insuf-ficient or inadequate information to patients about their medications, lack of understanding by the patients of their drug therapy or lack of patient access to their medications (38–40).
Polypharmacy
A high number of prescribed drugs for one individual has been associated with an increased risk of drug-drug and drug-disease interactions (1,41–43), inappropriate prescribing (44–47), medication errors (29,48) and non-compliance with treatment (10,39,49). Therefore, concomitant prescribing of a high number of drugs, or polypharmacy, is sometimes considered an indi-cator of inappropriate drug use. However, the principle of appropriate pre-scribing is not about keeping the number of drugs low: the quality of the prescribed drug treatment is more important than the actual number of drugs. Steinman et al. (44) pointed out that the issue of underprescribing is often overlooked and the underuse of medications is common in patients taking only a few medications, as well as in those taking many.
Quality of care and how to measure it
The Institute of Medicine (IOM) defines the quality of health care as “the degree to which health services for individuals and populations increase the likelihood of desired health outcomes and are consistent with current profes-sional knowledge” (50). Further, the care should be “safe, effective, patient centered, timely, efficient and equitable” (51). Consumers, payers and regu-latory agencies request evidence of the quality of care, and methods and measures for evaluating it are therefore required.
The use of quality measurement methods allows the attainment of data on the existence and magnitude of substandard quality in a certain area as well as evaluation of the effects of efforts to improve quality.
Quality measures
Quality measures help us to determine quality quantitatively (52). Quality is a multidimensional concept, and multiple indicators are required for a fair judgment (53,54). Donabedian (55) suggests that we measure the quality of health care by studying its processes, structures and outcomes. Process measures describe “what providers do”, structure measures describe “how care is organized” and outcome measures describe “what happens to the patients”. For example, the attendance rate of clinical pharmacists perform-ing medication reconciliations (as described below under “Medication
rec-onciliation”) at the emergency department is a measure of structure, and the
number of medication discrepancies identified and corrected during the med-ication reconciliation is a measure of process. The readmission rate for the patients for whom medication reconciliations were conducted is a measure of outcome.
Quality measures should generate results that are meaningful, scientifical-ly sound and interpretable (56). To be meaningful, they should measure aspects of health care that are important (e.g. those that are associated with high morbidity or mortality or that are costly), and/or those that are of finan-cial or strategic importance to stakeholders. To be scientifically sound, they should be based on evidence-based data and they should also be validated, reliable, sensitive, and specific. Interpretability refers to the ease with which the potential user of the information can understand and apply the generated results.
Validity is the extent to which the measure accurately represent the con-cept that is being assessed. Reliability is the ability to generate the same results when the measure is applied repeatedly in the same population. Sen-sitivity is the proportion of positive responses that are correctly identified as such (sometimes referred to as “the true positive rate”) and specificity is the proportion of negative responses that are correctly identified as such (or “the true negative rate”).
Quality measurement methods also need to be practical and user-friendly, and data needed for assessment should be accessible. They need to keep a balance between clinical complexity (which enhances validity) and simplici-ty (which keeps things user-friendly). Because of the inherent tension be-tween these aims, it can sometimes be challenging to find the balance (52– 60).
Outcome assessment
Measurement of outcomes is generally considered to be the ultimate method of valuing the quality of medical care. Patients and purchasers generally place more value on outcomes than on processes (54), probably because outcomes are relatively concrete and because their validity is seldom
ques-tioned (55). However, in some situations it is more suitable to assess the quality of the processes or structures instead. For instance, the outcome may be irrelevant –as when mortality is chosen as a measure for something that does not aim to increase survival. The outcome may also be affected by fac-tors other than medical care, and these facfac-tors then have to be controlled or adjusted for. Further, it can sometimes be a long time until some outcomes can be evaluated (55).
Process assessment
Methods of assessing processes involve evaluation of adherence to standards and guidelines. Standards are usually based on best practice, consensus among providers and/or medical evidence (52,58). The advantage of as-sessing processes is that this provides information about what is and what is not being done well (defined as which guidelines are followed and which are not) and consequently clearly demonstrates how quality can be improved. Also, providers are more accountable for the processes of care, and can therefore control them better than the outcomes. Hence, it is generally easier to guide improvements in the quality of health care using process measures than outcome measures. Assessing the quality of processes can also be rela-tively simple and less costly. On the other hand, process assessment may not be fully comprehensive and may cover only some aspects of the factors af-fecting outcomes.
Structure assessment
Structure measures assess the organization of the delivery of the processes of health care. The idea is that if certain settings and/or staff routines are in place, there will be a greater chance of achieving the desired outcomes. The advantages of structure assessment are that structures are concrete, and the information needed is often readily accessible. The disadvantage is that there may be a weak relationship between the structure and the processes taking place and/or between the structure and the outcomes (55).
For structure or process measures to be valid, it is essential to establish a link between the process or structure measure and the outcome measure; an provement in a process or structure should ultimately be reflected as an im-provement in an outcome. Ideally, evidence for this link should be scientifi-cally demonstrated, but often this is not done. In these cases consensus among providers is deemed sufficient for validity (53,55,58,61).
Pharmaceutical care and clinical pharmacy practices
The aim of pharmaceutical care is to ensure that patients receive the correct medications in an appropriate dose and dosage for appropriate indications (62). Hepler (63) described pharmaceutical care as an “outcome-oriented, cooperative, systematic approach to providing drug therapy”. The outcome-oriented approach indicates that the term pharmaceutical care describes not so much what the health-care provider does, but more what the patient expe-riences. The term cooperative is used because pharmaceutical care is con-ducted in a multidisciplinary setting with health-care providers working to-gether for the benefit of the patient. As indicated by the name, pharmaceuti-cal care is about pharmaceutipharmaceuti-cals and not about pharmacists; it should not necessitate the involvement of a pharmacist per se. However, pharmacists often play an important role in the delivery of pharmaceutical care – as pro-viders of patient-oriented clinical pharmacy services and/or as active partici-pants in the improvement of organizational structures through which drug therapy is provided (62,63). Patient-oriented and ward-based pharmacist practices are often referred to as clinical pharmacy. The European Society of Clinical Pharmacists (ESCP) defines clinical pharmacy as “a health special-ty, which describes the activities and services of the clinical pharmacist to develop and promote the rational use of medicinal products and devices” (64). It is a broad definition that includes promoting of appropriate prescrib-ing, reducing the risk of medication errors, enhancing patients’ adherence to prescribed medication (through drug counseling as well as ensuring that the patient has access to current medications) and aiming for cost-effective use of medications. Examples of clinical pharmacy practices are medication reconciliation, medication reviews, medication counseling to patients and bedside dispensing of medications at discharge.
Medication reconciliation
Medication reconciliation is “the process of comparing a patient’s medica-tion orders to all of the medicamedica-tions that the patient has been taking” (65). This process should be undertaken at transitions in care when new drugs are ordered or existing orders rewritten (65,66). On admission to hospital, a list of the patient’s current medications is compiled. Information from the pa-tient, from the drug list at the primary care center and from the computerized hospital medical record can be used. The compiled list is compared to the patient’s current medication administration record (MAR) at the hospital. On discharge, the patient’s MAR is compared to the prescribed/ordered dis-charge medications.
Since 2012, the Swedish National Board of Health and Welfare requires health-care providers to perform a medication reconciliation – along with a brief evaluation of the appropriateness of the prescribed medications – for all
patients aged 75 years and older and with five or more medications, at every transition in care and at least once annually (67). The physician is responsi-ble for the performance of the medication reconciliation, but the process can be carried out by a pharmacist or a nurse.
Medication review
Medication review is a systematic evaluation of an individual patient’s med-ications, in terms of indication, effect, safety and adherence to the treament regimen. The therapeutic efficacy of each drug, any unmet therapeutic needs and the progression of the conditions being treated are evaluated. Other is-sues, such as adherence to drug therapy, actual and potential adverse effects, drug interactions and the patient’s understanding of the condition and its treatment are also considered. The overall aim of a medication review is to optimize the prescribing of medications as well as the use of prescribed med-ications (68,69). A medication review should be considered as an ongoing process rather than a separate intervention. Follow-up of the effects of the medication changes is therefore an important part of the review and is neces-sary for a successful outcome for the individual patient.
Drug counseling to patients
During hospital admission, several changes in the patients’ drug treatment are often made. The changes may be accompanied by inadequate discharge patient education and follow-up (70) and there is a high risk of ADEs to occur after hospitalization (71,72). Schnipper et al. (73) conducted a RCT in which patients in the intervention group received pharmacist counseling at discharge and a follow-up phone call a few days later. Thirty days after dis-charge, preventable ADEs were found in 11% of the control group patients and 1% of the intervention group patients.
Multi-dose dispensed drugs and bedside dispensing
The multi-dose dispensing (MDD) system used in Sweden is a computer-based, automated medication dispensing system. The patient receives the dose of all the medications to be taken at a specific time, packaged in a sa-chet labeled with the contents, patient data and the time and date the drugs should be taken. MDD is very common in Sweden, with around 180 000 users (out of a population of 9 million inhabitants) (74). The purpose of the MDD system is to enhance patient safety, particularly among outpatients taking many medications. Other potential benefits are increased patient ad-herence to drug therapy, saving of nurses’ working time in primary health care (by facilitating medication administration), and decreased costs (by reducing waste of unused medications) (75). A recently conducted Swedish
overview concluded that the MDD system increases adherence to drug treatment regimens, but that the effect on patient safety is ambiguous (76). A few studies, mentioned in the overview, found that the prescribing of poten-tially inappropriate drugs was more frequent in patients enrolled in the MDD system (77,78). Other studies focused on the occurrence of medication errors in people receiving MDD. One study found that people enrolled in the MDD system had fewer discrepancies between the drug list at the primary care center and the nursing home than the people who did not have MDD drugs (79), while other studies found higher frequency of medication errors at dis-charge from hospital in patients with MDD drugs than in those without (23,80).
The hospital pharmacy at Uppsala University Hospital previously offered an extended distribution service to MDD patients being discharged, in order to increase medication-associated safety. As part of this service, a pharma-cist visited the ward every morning to collect MDD orders for discharge patients. The orders were checked for drug-drug interactions, duplicate pre-scriptions and irrational dosages and doses by the pharmacist, but the medi-cines were not reconciled with the MAR. The packaged doses were then delivered to the patient at the ward later on the same day before discharge.
Measuring the effects of clinical pharmacist intervention
The value of adding the competence of a pharmacist to the health-care team and the role of the pharmacist in the team, have been widely discussed and studied (81–85). Many studies have focused on the quality of prescribing, showing that the intervention of a clinical pharmacist resulted in an im-provement (86–90). Meta-analyses and systematic reviews of the effects of pharmacist interventions on clinical outcomes have shown discordant results. Kaboli et al. (83) determined that the addition of clinical pharmacists im-proved the quality, safety and efficiency of care, and Koshman et al. (84) that pharmacist care reduced the risk of hospitalizations in patients with heart failure. Conversely, Holland et al. (81) concluded that pharmacist-led medication reviews cannot be assumed to reduce hospital admissions and mortality rates in older people.
Systematic reviews of the advantages and disadvantages of medication reviews and other pharmaceutical services are often complicated by the lack of a general definition of the services and the wide variation in the interpre-tation of the concepts that are being compared (81,83–85,91). In some stud-ies, the clinical pharmacist worked as a consultant and communicated with the prescriber only via written recommendations (87,92), while in other stud-ies the pharmacist was an integrated part of the multi-professional health-care team and had direct contact with other health-health-care providers (5,86,90,93,94). In some studies, the pharmacist had no access to patient
medical records, and this substantially decreased their capacity to perform a thorough medication review (94–96). The studies also differed widely in the extent of interaction between the pharmacist and the patients (81).
Outcome assessment
Mortality
A number of studies have used mortality as a measure of clinical outcome, but few have shown an impact (81,83,84). This is not surprising. Mortality is multifactorial; because it can occur for a number of reasons, the causative agent behind any change in mortality is very difficult to demonstrate.
Morbidity
Morbidity is also often chosen as a measure of outcome; there are also a number of proxies for morbidity that can be and have been used. Examples are the degree of health-care utilization (in primary, secondary or tertiary care scenarios), the rate of ADEs, the severity of the illness or the perceived level of health, etc.
The underlying theory behind the utilization of health care as an outcome measure is that a readmission or a revisit to hospital reflects a change in health status. This measure has the advantage of being objective.
Drug-related problems (DRPs), or ADEs, are often used as measures for assessment of drug-related morbidity and the quality of prescribing. Because of their strong links to drug use, the presence of ADEs is often a suitable choice for measuring the effects of clinical pharmacy interventions. Methods for identifying preventable ADEs (7) and determining causality (97,98) are available for standardizing the assessment. However, these are still subjec-tive measures which to some degree depend on the evaluator.
There are also standardized methods for grading the level of morbidity, so-called severity-of-illness scales (99) and patient-perceived level-of-health scales. An example of the latter is the SF-36, which is the most commonly used assessment of health-related quality of life (HRQoL). It is a multi-purpose, short-form health survey with 36 questions which yields a profile of both physical and mental health (100). EQ-5D is another example of a scale that grades HRQoL (101).
Financial measures
All the above outcome measures are clinical, i.e. they measure the quality of care in one way or another. Some of these measures can also be translated into financial measures; the level of health-care utilization is, for instance, a measure of both clinical and financial outcomes. Other examples of financial outcome measures for pharmacist interventions are quality-adjusted life years (QALYs) (102), and the cost of a patient’s prescribed drugs.
Process assessment
As pharmaceutical care involves several different processes, different measures should be chosen depending on the process to be evaluated. The rate of identified prescribing errors is often used to measure the effects of medication reconciliation on admission or at discharge (23,26,27). The ef-fects of medication reviews are often measured in terms of the quality, or the appropriateness, of prescribing. The quality of prescribing is a multidimen-sional and complex phenomenon and, accordingly, evaluating and measuring it is a complicated task. A systematic approach can be used to assess the appropriateness of prescribing and several instruments have been developed for this purpose. All of them determine quality in a quantitative manner. The tools can be used prospectively as guides to appropriate prescribing or retro-spectively to evaluate the quality of prescribing (45,103,104), and they can be either explicit or implicit.
Explicit instruments
Explicit tools are criterion-based and can be used as checklists. They have a drug-disease focus and consensus opinions from experts in the field or litera-ture reviews have often been used to produce the content of these lists. These tools are generally easy to use, they are not dependent on the experience and knowledge of the user and they can be applied to large quantities of patient data. However, they are often criticized for not accounting for the presence of co-morbidities or patient preferences. Furthermore, the inclusion of some drugs/criteria on the lists is subject to controversy, the tools need continuous updating and they are not readily transferable between countries (17,20,105,106). The most well known and well studied explicit tool is the Beers criteria tool (104,107–109), which is used as a checklist for medica-tions that should generally be avoided in older people. Other explicit tools include the Inappropriate Prescribing for Elderly People (IPET) tool (110) and the Screening Tool of Older Persons’ Prescriptions (STOPP) (103,111,112). These instruments all focus on misprescribing and overpre-scribing, i.e. naming the drugs and the doses that should be avoided and when they should be avoided. Sets of explicit criteria that also account for underprescribing have been developed and validated: the Assessing Care of the Vulnerable Elderly (ACOVE) tool (113) and the Screening Tool to Alert doctors to Right Treatment (START) (103,112,114). The START criteria include a number of conditions and indicate which drugs should be pre-scribed.
Implicit instruments
Implicit tools are judgment-based and focus on the individual patient. They are more sensitive than explicit tools, but are also more time-consuming to use and require access to extensive information about the patients (medical
history, drug history, organ function, laboratory data, functional status, etc.). Further, since the results are based on informed judgment, there is always a chance that the user’s knowledge and attitudes will influence the results and therefore there is a risk for reduced reliability. The Medication Appropriate-ness Index (MAI) (115,116) is the only available validated implicit instru-ment for assessing the appropriateness of prescribing.
As discussed previously, process measures need to be linked to outcome measures in order to be valid. However, the evidence that available process measures for appropriateness of prescribing are associated with clinical out-comes is equivocal and contradictory (20,117). Some studies found a posi-tive relationship between inappropriate prescribing according to the Beers criteria and increased mortality, use of health-care services and ADEs (47,118,119), whereas others reported mixed or negative results (120,121). The prescribing of inappropriate medications, as measured with STOPP and START, is linked to serious avoidable ADEs (122) but, when tested in an RCT, an intervention aiming to reduce STOPP and START scores was not reflected in reduced mortality, falls or health-care consumption (89). In-creased score in the MAI has in a few studies been associated with an in-creased risk of ADEs (123,124).
In this context, it should be emphasized that the tools for assessment of inappropriate prescribing have been developed through literature search, expert opinion and consensus validation. In other words, none of them are designed to prospectively reduce readmissions.
Other weaknesses of the available process measures are that they do not adjust for the patient’s co-morbidities and that they do not take the patient’s views and wishes into account (20,105,125). Several studies have also shown that the most commonly used measures lack agreement in what they identify as inappropriate prescribing (111,126,127). This suggests that measures of one aspect of prescribing quality may not be representative of the overall quality of a patient’s prescribed drugs (126) and is a reminder that the quality of prescribing should be evaluated from multiple perspec-tives.
The 80+ study
In 2005 to 2006, we conducted an RCT at Uppsala University Hospital that assessed the effects of adding a clinical pharmacist to the health-care team on clinical outcomes for older patients (5). Four hundred patients, aged 80 years and older and admitted to the acute internal medicine wards were in-cluded and randomized to the intervention or control groups. Intervention consisted of a comprehensive clinical pharmacy service that was added to standard hospital care.
The main elements of the clinical pharmacist service were: medication reconciliation on admission and at discharge, a thorough medication review and patient education during the hospital admission process, communication of the treatment plan to primary care representatives at discharge, and a fol-low-up phone call to the patients after discharge.
For the medication reconciliation on admission, various information sources were used – including interviews with the patients, the drug lists from the primary care centers and the computerized hospital medical rec-ords. Identified discrepancies and prescription errors were recorded and re-ported orally to the physician who then corrected them. An interview was undertaken with all the patients (or the next of kin or caregiver), including questions about adherence to and understanding of the drug therapy, per-ceived problems and ADRs, and use of over-the-counter drugs.
The medication review was based on information obtained from the pa-tient’s medical records and laboratory findings, as well as information from the patient interview. Relevant DRPs were identified and the pharmacists’ suggested actions were recorded and discussed in the health-care team dur-ing the daily ward rounds. Changes to drug therapy were made by the physi-cian. The patient was monitored during the hospital stay, and was counseled about their drug therapy.
As a complement to the physician’s discharge information, the pharmacist provided drug counseling to the patients at discharge. A discharge letter, summarizing all drug therapy changes made during the hospital stay as well as the rationale for the changes, therapeutic goals and monitoring needs, was written by the pharmacist. DRPs not dealt with during the hospital stay but still of importance were also listed in this letter. After approval of its content by the physician at the ward, the letter was faxed to the patient’s primary care physician. For patients enrolled in the MDD system, the MDD orders were also reconciled with the MAR at discharge.
Two months after discharge, the pharmacists contacted the patient (or the next of kin or caregiver if the patient was not able to communicate coherent-ly) by telephone. Adequate management of the medications at home was ensured, and the patient’s drug list at that point of time was also recorded. We wished to measure the effect of the discharge letter, and the time chosen (two months after discharge) was considered to be long enough for the pa-tient to have had time to visit the general practitioner after discharge but still close enough to the index admission to be relevant.
The patients were followed for 12 months after the index hospital admis-sion and the number of revisits to hospital and deaths were recorded. The primary outcome measure was the frequency of hospital visits (emergency department visits and readmissions [in total and drug-related]) during the follow-up period; the secondary outcome measure was the cost of health care.
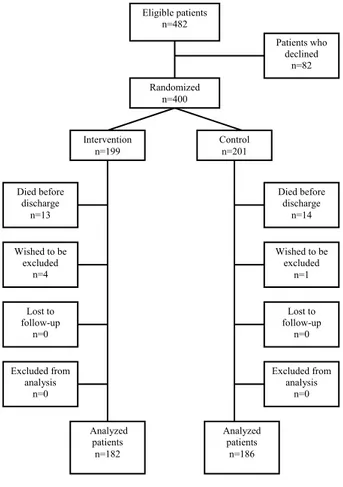
Of the 400 patients included in the RCT, 27 died during the index admis-sion and five wished to be excluded (Figure 1). The remaining 368 patients were eligible for further analyses. For the intervention group, there was a 47% reduction in visits to the emergency department and a 16% reduction in total revisits to hospital versus the control group. Drug-related readmissions were reduced by 80%. The intervention was also cost-effective.
Figure 1. Patient flow diagram
Subgroup analyses
The effects of adding a clinical pharmacist service to the health-care team on process as well as outcome measures have been well studied. However, dif-ferences in the effects of clinical pharmacist intervention on clinical out-comes between different subgroups of patients have rarely been analyzed.
The main aim of a subgroup analysis is to confirm the consistency of the treatment effect or to identify differences among different categories of
pa-Figure 1. Patient flow diagram
Eligible patients n=482 Intervention n=199 Control n=201 Died before discharge n=13 Patients who declined n=82 Wished to be excluded n=1 Wished to be excluded n=4 Analyzed patients n=182 Analyzed patients n=186 Randomized n=400 Died before discharge n=14 Excluded from analysis n=0 Lost to follow-up n=0 Lost to follow-up n=0 Excluded from analysis n=0
tients (128). If differences in effect are found, the patients who benefit from the treatment can – with good reason – be provided with it. Subgroup analy-sis for an intervention, such as that from a clinical pharmacist, may also pro-vide additional understanding of the intervention itself and its focus.
Identifying areas for quality improvement
A high proportion of ADEs are avoidable, and over 50% of drug-related hospital admissions have been deemed preventable (15,129,130). Thus, it is imperative to identify stages in the medication process and/or specific groups of patients where there is a high risk of ADEs occurring, to measure the quality of the process, and, if needed, to develop appropriate preventive interventions. High-risk medication processes or groups of patients may for instance be identified from reports of medication errors or suboptimal pre-scribing.
A different strategy for identifying patients at high risk of an unwanted outcome is through risk-prediction models. Here, a specific outcome, e.g. readmissions to hospital, is selected and modeled and patient characteristics that are associated with a higher risk of that outcome can be determined.
Identifying high-risk areas and measuring quality of care
Medication error reports can help identifying areas with suboptimal quality. To attain data on the existence and magnitude of the problem, a quality as-sessment – with suitable quality measures – is needed. For example, if sub-standard quality in the medication discharge process is indicated, an appro-priate quality measure would be the frequency of discharge errors. This measure can also be used in evaluation of the effects of efforts to improve quality.
In other situations, certain medications that are considered inappropriate or hazardous for a group of people are selected (using available evidence and the literature). The number of dispensed prescriptions of these medications can then be used as a quality measure. An example of this is the national initiative of the Swedish Association of Local Authorities and Regions (SALAR) to reduce the prescribing of certain inappropriate drugs (drugs with anticholinergic effects, long-acting benzodiazepines, tramadol and pro-piomazine), oral nonsteroidal anti-inflammatory drugs (NSAIDs) or neuro-leptics for people aged 75 years and older. Economic reimbursement is used as incentive to reduce the prescribing (131).
It should be noted that, in both examples, process measures are used as a measure of quality. As long as a link to outcome measures has not been es-tablished, it is difficult to evaluate their clinical and financial importance to patients and society.
Identifying high-risk patients
In recent years, a substantial number of tools for predicting the risk of revis-its to hospital have been suggested (132–139). One reason for the interest in these models is that they can be used to help target the delivery of transition-al care interventions by identifying high-risk patients. Since these interven-tions are often resource-intensive, prioritization can be cost-effective. The focus on reducing readmissions can be explained by the use of unplanned 30-day readmission and mortality rates as a national quality measure for hospitals in the U.S. (140). This information is publicly reported, and hospi-tals with excess readmissions, have their payments from the Centers for Medicare & Medicaid Services reduced (141).
A wide range of variables have been tested for predictive ability in the prediction models, including patient sociodemographic factors, medical co-morbidity data, illness severity, prior use of medical services, overall patient functional status and social determinants of health. These prediction models are also based on studies conducted in a variety of populations and settings and with different designs. Different outcome measures (e.g. all hospital admissions or only acute admissions, readmissions or emergency department visits, or mortality), different follow-up times, and different candidate varia-bles have been included. This has resulted in a wide range of data on risk factors for rehospitalisation and mortality, but the results are difficult to compare and generalize. Besides, most models have a predictive ability that is only modestly better than chance (142,143).
The patients’ prescribed medications have rarely been evaluated as poten-tial predictors of readmission in prediction models. This is surprising, since drugs, especially in older patients, are a fundamental component of care.
Aims
The overall aim of this thesis was to study possible improvements in the quality and safety of drug use in hospitalized older people, by assessing the effects of clinical pharmacist interventions and identifying patients at risk of rehospitalization and mortality.
The specific aims were:
• To investigate the effects of pharmacist interventions on appropri-ateness of prescribing, assessed by STOPP, START and MAI, in older patients and to explore the relationship between these results and hospital care utilization (Paper I);
• To explore whether pharmacist intervention is equally effective in preventing subsequent emergency department visits for patients receiving few or many prescribed drugs, and in those with differ-ent levels of inappropriate prescribing (as measured with STOPP and START) on admission, and to describe the impact of the pharmacist intervention on the quality of prescribing for patients in the different subgroups (Paper II);
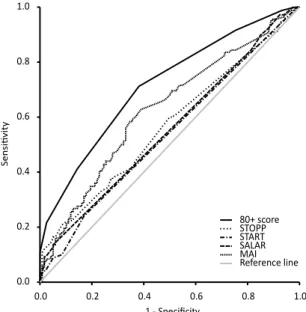
• To construct a score for estimating the risk of revisiting the hospi-tal and of morhospi-tality in older people and to compare the discrimina-tory ability of this score with the following measures for appropri-ateness of prescribing: STOPP, START, MAI and the SALAR drug list (Paper III);
• To survey the frequency, type and occurrence of prescribing and transcribing errors for patients receiving MDD drugs at discharge from hospital and to assess the severity of these errors (Paper IV).
Methods
Population
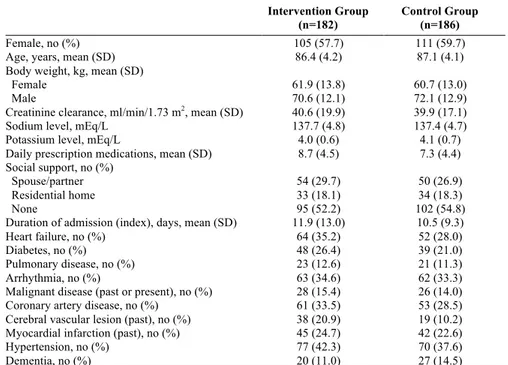
Papers I, II and III were based on patient and outcome data from the previ-ously conducted RCT (the “80+ study” (5)), in which the impact of a clinical pharmacist intervention on clinical outcomes for older patients was as-sessed. Data from 368 patients from this study were eligible for further anal-ysis (Table 1). The patients were included between September 2005 and June 2006 and were followed for 12 months after the index hospital admis-sion. The number of revisits to hospital and the number of deaths during this period were recorded.
Table 1. Baseline characteristics 80+ population
Intervention Group (n=182)
Control Group (n=186)
Female, no (%) 105 (57.7) 111 (59.7)
Age, years, mean (SD) 86.4 (4.2) 87.1 (4.1)
Body weight, kg, mean (SD)
Female 61.9 (13.8) 60.7 (13.0)
Male 70.6 (12.1) 72.1 (12.9)
Creatinine clearance, ml/min/1.73 m2, mean (SD) 40.6 (19.9) 39.9 (17.1)
Sodium level, mEq/L 137.7 (4.8) 137.4 (4.7)
Potassium level, mEq/L 4.0 (0.6) 4.1 (0.7)
Daily prescription medications, mean (SD) 8.7 (4.5) 7.3 (4.4) Social support, no (%)
Spouse/partner 54 (29.7) 50 (26.9)
Residential home 33 (18.1) 34 (18.3)
None 95 (52.2) 102 (54.8)
Duration of admission (index), days, mean (SD) 11.9 (13.0) 10.5 (9.3)
Heart failure, no (%) 64 (35.2) 52 (28.0)
Diabetes, no (%) 48 (26.4) 39 (21.0)
Pulmonary disease, no (%) 23 (12.6) 21 (11.3)
Arrhythmia, no (%) 63 (34.6) 62 (33.3)
Malignant disease (past or present), no (%) 28 (15.4) 26 (14.0)
Coronary artery disease, no (%) 61 (33.5) 53 (28.5)
Cerebral vascular lesion (past), no (%) 38 (20.9) 19 (10.2) Myocardial infarction (past), no (%) 45 (24.7) 42 (22.6)
Hypertension, no (%) 77 (42.3) 70 (37.6)
Dementia, no (%) 20 (11.0) 27 (14.5)
In paper IV, patients enrolled in the MDD system who were discharged from Uppsala University Hospital between February and April 2010 were studied. Patients who were discharged from any of the hospital wards (n=20) that
were using an extended pharmacist discharge service for patients receiving MDD packs, were included.
Assessment of appropriateness of prescribing (Paper I)
The effect of the pharmacists’ intervention in the RCT on the quality of pre-scribing was retrospectively evaluated using three validated tools for meas-uring the appropriateness of prescribing – STOPP, START and MAI. The tools were applied to the patients’ drug lists in the MAR twice: on admission and at discharge. Data from the electronic medical records were used. The assessment was blinded and was conducted by an experienced clinical phar-macist. The instructions for the instruments were followed carefully. A summed score for each tool was calculated for each patient.
The association between the tools and the clinical outcomes was also ex-plored. For this, STOPP, START and MAI scores at discharge were used and the primary clinical outcomes were the number of readmissions and the number of total revisits to hospital during the 12-month follow-up period. The secondary outcome was the number of drug-related readmissions during the same period. In these analyses, data from the intervention and control groups were analyzed together in order to increase the power of the assess-ment.
STOPP and START
STOPP encompasses 65 instances of potentially inappropriate prescribing in older people, including drug-disease interactions, irrational prescribing and drugs that are known to increase risks in older people. The criteria identify Potentially Inappropriate Medications (PIMs) (103,111). START consists of 22 indicators of irrational omission of drug therapy that would be beneficial for the patient. The criteria detect Potential Prescription Omissions (PPOs) (103,114).
Each PIM and PPO generates one point, i.e. the scoring is not weighted. The sum of the STOPP and START scores for each patient is a measure of the level of inappropriate prescribing; a higher score indicating a higher level of inappropriate prescribing. The STOPP and START tools were developed to complement each other, in order to cover aspects of over-, mis- and under-prescribing. However, the creators of the instruments have not used or ana-lyzed the combined scores.
The tools are arranged according to physiological systems for ease of use. They were developed through literature search and are based on well-established instances of potentially inappropriate prescribing for older peo-ple. The draft criteria went through a Delphi consensus process for valida-tion, with experts in geriatric pharmacotherapy on the panel (103,112).
MAI
The MAI consists of 10 questions, or criteria, which evaluate different as-pects of inappropriate prescribing: indication, effectiveness, dosage, correct and practical directions, drug-drug interactions, drug-disease interactions, no unnecessary duplications, acceptable duration of therapy and cost-effectiveness (115,116). The 10 questions are applied to every prescribed drug, and once an answer to any of the questions indicates inappropriateness, a score is assigned. The questions have weighted scores; for example, “lack of effectiveness” scores three points and a drug-drug or drug-disease interac-tion scores two points. The scores are then summed, either for each drug to provide a “drug score”, or for each patient to provide a “patient score”. A higher summed score indicates inappropriate prescribing.
The content and weighting of the MAI scores has been validated. Because it is a judgment-based tool, its inter- and intra-observer agreement have been tested in several studies, some of which showed satisfactory reliability (115,116,144), while some showed only moderate reliability and proposed potentially useful improvements (145–147). It is emphasized that the instruc-tions accompanying the instruments should be followed carefully.
Subgroup analyses (Paper II)
The patients were divided into subgroups according to the number of pre-scribed drugs on admission to hospital. The prescription of <5 and ≥5 drugs was used to determine entry to the subgroups. The rationale for choosing this cut-off point was that the administration of ≥5 drugs is a common definition of polypharmacy (19). Since these subgroups were not well balanced in size, a sensitivity analysis was conducted, using the median number of drugs (≥8) as the cut-off point. The patients were also divided into subgroups based on the quality of prescribing, as measured with STOPP and START. In these analyses, the cut-off points used were based on the median scores (≥2 for STOPP and ≥1 for START), where a higher score indicated a higher level of inappropriate prescribing.
The outcome variable for both analyses was the number of revisits to the emergency department over the 12 months after the index hospital admis-sion. This endpoint was chosen because this was the one on which the RCT pharmacist intervention had the greatest impact.
The changes in the STOPP and START scores from admission to dis-charge were used to describe the effects of the pharmacist intervention on the quality of prescribing for the patients in the <5 and ≥5 drugs subgroups. The number, type and acceptance rate of the pharmacists’ recommendations were also used to describe the effect of the medication review. The types of
recommendations were: discontinuation of drug, initiation of drug therapy, changes to the drug/dosage/route, and medication counseling to the patient.
Development of a score for risk prediction (Paper III)
A score for estimating the risk of rehospitalization and mortality was con-structed by 1) selecting the most relevant risk factors for the chosen outcome and 2) assigning a point score for each risk factor. A composite variable (combining the event of a revisit to hospital and of death during the 12-month follow-up period) was chosen as the endpoint for the analysis. The outcome variable in the regression analysis was the time to the endpoint from the day of discharge from the index admission.
Candidate patient variables were selected based on clinical judgment and the statistical properties of the variables. The clinical variables were: gender, age, renal function, level of social support and medical history (heart failure, diabetes mellitus, pulmonary disease (asthma or chronic obstructive pulmo-nary disease [COPD]), arrhythmia, malignant disease (past or present), coro-nary artery disease, cerebral vascular lesion (past), myocardial infarct (past), hypertension and dementia). The drug-disease variables were the STOPP and START criteria, and the drug variables were the patient’s prescribed medications. The medications were categorized according to the ATC classi-fication system and to similar effects and risks in older people, or according to the SALAR drug list (131).
To detect potential overlapping variables, a principal component analysis (PCA) was conducted and variables were excluded accordingly. The remain-ing candidate variables were subject to regression analysis. The variables extracted from the regression analysis made up the components of the new point score system for risk estimation, the 80+ score. The risk associated with each point total was calculated, and the goodness-of-fit and the discrim-inatory ability of the score were assessed. The score was internally validated.
The total STOPP, START and MAI scores and the total number of pre-scribed SALAR drugs were calculated for each patient. Their discriminatory abilities were assessed, and compared with that of the 80+ score.
The whole dataset (both intervention and control groups) was used in the development of the new score and the effect of the pharmacist intervention was not adjusted for in the regression analyses. As a sensitivity analysis, the discriminatory ability of the 80+ score was assessed for the control group only.
Survey of discharge errors in patients with MDD (Paper
IV)
This study focused on technical medication errors occurring at discharge from hospital. Two pharmacy students at master degree level collected the data under the supervision of two clinical pharmacists.
The data collectors visited the wards every morning prior to the clinical pharmacist visit. For the patients who were about to be discharged with MDD drugs, the data collectors reconciled the drugs on the patients’ MDD order sheets with the drug list in the MAR. Identified discrepancies were recorded as a note that was left for the clinical pharmacist. The clinical pharmacist notified the physician, and the physician had the opportunity to correct the discrepancies that were unintentional. The clinical pharmacist then sent the MDD orders to the pharmacy for dispensing. The pharmacist recorded whether the discrepancy was unintentional or not and whether the discrepancy was corrected, and this was communicated to the data collec-tors.
Unintentional discrepancies were classified as errors and were subject to further analysis. The errors were categorized into different types: faulty omission of drug, faulty prescribing of drug, wrong drug, wrong dose/formulation/dosage regimen, wrong dosage time and double prescrib-ing.
A severity assessment of the errors was also conducted, using an ap-proach similar to the method for safety assessment developed by the Veter-an’s Affairs group (148). The errors were classified into one of four severity categories: minor, moderate, major or catastrophic, based on the errors’ po-tential ADEs and consequences of the errors. The severity assessment was performed by the data collectors together with two experienced clinical pharmacists, and was reviewed by an experienced physician with a speciali-zation in internal medicine.
The associations between occurrence of errors and ward category, type of order (electronic or paper) and the patients’ age, gender and number of med-ications were assessed. The associations between error correction and severi-ty of errors, ward category, severi-type of order and the patients’ age, gender and number of medications were also assessed.
Statistical analyses
Paper I
To assess the effects of the pharmacist intervention, the intervention and control group patients were compared with respect to changes in STOPP,
START and MAI scores from admission to discharge. Rank analysis of co-variance was used, with score at admission as a covariate.
Negative binomial models were used to analyze the relationship between the tools and the clinical outcome, with the logarithm of the time spent out-side the hospital as an offset. Both unadjusted models and models adjusted for baseline covariates (age, gender, weight, social support and medical his-tory) were developed.
Paper II
Poisson regression models were used for the subgroup analyses of the num-ber of emergency department visits. Group (intervention or control), sub-group factor and the interaction between sub-group and subsub-group factor were used as independent variables. The logarithm of the time spent outside the hospital was used as offset. Changes in STOPP and START from admission to discharge were analyzed, using rank analysis of covariance with group (intervention or control) as a factor and scores on admission as covariate.
Paper III
A backward stepwise Cox regression elimination procedure was used to select the candidate variables with statistically significant associations with the outcome. The p-values for inclusion and exclusion were required to be less than 0.01.
The variables extracted from the regression analysis made up the compo-nents of the point score system. The point score system was developed and the risk associated with each point was calculated by following the Framing-ham Heart Study approach (149,150), see Paper III.
The goodness-of-fit of the 80+ score was assessed by plotting predicted vs observed risk and using the Grønnesby-Borgan test (151). The discrimina-tory abilities of the 80+ score, the STOPP, START and MAI scores and the SALAR drug list were assessed using C-statistics. C-statistics, which can range from 0.5 (no discrimination) to 1 (perfect discrimination), provide the ratio of the probability of predicting an event in patients with an event to that in patients without an event. The score was internally validated using an enhanced bootstrap with 1000 iterations.
Paper IV
A multiple logistic regression was performed, with occurrence of one or more medication errors as outcome. Ward category, type of order and the patients’ age, gender and number of medications were included as explanato-ry variables. Error correction for patients with at least one medication error
was also modeled as a hierarchical multiple logistic regression, using the same explanatory variables plus the severity of errors.
Ethical considerations
Each participant in the RCT gave written informed consent and the study protocol was approved by the Uppsala Regional Ethics Committee. When the study presented in paper IV was evaluated by the Uppsala Regional Eth-ics Committee, no formal approval was necessary and the Committee had no objections. All patient data were de-identified and coded. Data were stored in locked cabinets and password-protected computers. None of the results can be traced back to an individual patient. Inclusion in the studies was con-sidered to be associated with very low risk of harm.
Summary of findings
Paper I
In the first paper, the effects of the clinical pharmacist intervention on the quality of prescribing were demonstrated. The links between the process measures used for assessing the quality of prescribing – STOPP, START and MAI – and clinical outcomes were also explored.
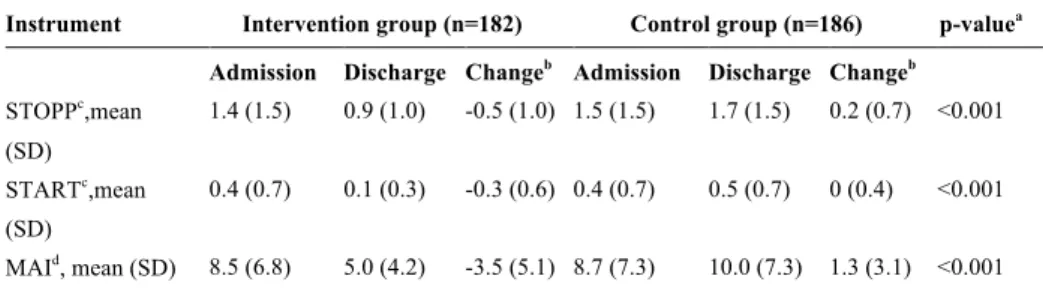
The STOPP, START and MAI scores improved during the hospital ad-mission for the intervention group, while the control group had higher or unchanged scores at discharge compared to admission. The change from admission to discharge differed significantly between intervention and con-trol groups (Table 2).
Table 2. Effects of pharmacist intervention on quality of prescribing. Scores on
admission and at discharge and change from admission
Instrument Intervention group (n=182) Control group (n=186) p-valuea
Admission Discharge Changeb Admission Discharge Changeb
STOPPc,mean (SD) 1.4 (1.5) 0.9 (1.0) -0.5 (1.0) 1.5 (1.5) 1.7 (1.5) 0.2 (0.7) <0.001 STARTc,mean (SD) 0.4 (0.7) 0.1 (0.3) -0.3 (0.6) 0.4 (0.7) 0.5 (0.7) 0 (0.4) <0.001 MAId, mean (SD) 8.5 (6.8) 5.0 (4.2) -3.5 (5.1) 8.7 (7.3) 10.0 (7.3) 1.3 (3.1) <0.001
SD, Standard deviation; a) p-values from rank analysis of covariance for the effect of group status (Inter-vention or Control) on change from admission, adjusted for the score on admission; b) Change from admission calculated as Score at discharge minus Score on admission; c) Number of scores per patient; d) Summed MAI score per patient
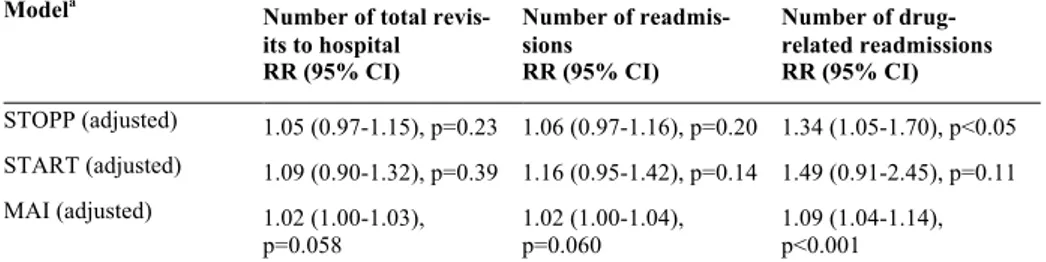
None of the scores for appropriateness of prescribing were associated with the number of readmissions or the number of total revisits to hospital. How-ever, higher scores for MAI and STOPP were linked to a significantly higher occurrence of drug-related readmissions (Table 3).
Table 3. Associations between STOPP, START and MAI scores and the number of
total visits to hospital, number of readmissions and number of drug-related readmis-sions
Modela
Number of total revis-its to hospital RR (95% CI) Number of readmis-sions RR (95% CI) Number of drug-related readmissions RR (95% CI) STOPP (adjusted) 1.05 (0.97-1.15), p=0.23 1.06 (0.97-1.16), p=0.20 1.34 (1.05-1.70), p<0.05 START (adjusted) 1.09 (0.90-1.32), p=0.39 1.16 (0.95-1.42), p=0.14 1.49 (0.91-2.45), p=0.11 MAI (adjusted) 1.02 (1.00-1.03), p=0.058 1.02 (1.00-1.04), p=0.060 1.09 (1.04-1.14), p<0.001 a) Negative binomial regressions. Adjusted models include age, gender, weight, social support and medi-cal history.
RR, Rate ratio; CI, Confidence interval.
Paper II
The second paper presented results from a subgroup analysis, exploring whether the clinical pharmacist intervention was equally effective in pre-venting revisits to the emergency department in patients with many or few medications on admission, and in patients with high and low levels of inap-propriate prescribing.
The patients receiving fewer (˂5) drugs on admission benefited more from the intervention, with respect to the number of emergency department visits, than the patients receiving a higher number of drugs. The effect of intervention on the number of emergency department visits did not differ between the patients with high and low levels of inappropriate prescribing (Table 4). The sensitivity analysis confirmed our findings that the interven-tion was more effective for patients receiving a lower number of drugs (see Paper II).
During the hospital admission process, the START scores improved for the intervention group, across subgroups. The STOPP score improved for the intervention ≥5 drugs subgroup but was unchanged for the ˂5 drugs sub-group (Table 5).
bl e 4. E ffe cts o f p ha rm ac is t in te rv en tio n o n e m er ge nc y d ep ar tm en t ( E D ) v is its . S ubgr oup anal ys es for the num be r of E D v is it s In terv en ti on g ro u p ( n = 18 6) Co n tr ol g ro u p ( n = 18 2) Pa ti ent s (n ) Pe rs on ye ar s (n ) ED Vi si ts ( n ) Ra te Pa ti ent s (n ) Pe rs on ye ar s (n ) ED V is it s (n ) Ra te RR (9 5% CI ) a P -val u e in te ra ct io n a er al l e ff ec t 182 140. 9 49 0. 35 186 141. 0 93 0. 66 0. 53 (0 .3 7-0. 75) - m be r of dr ugs 0. 0175 37 31. 9 6 0. 19 53 45. 7 39 0. 85 0. 22 (0 .0 9-0. 52) 145 109. 0 43 0. 39 133 95. 2 54 0. 57 0. 70 (0 .4 7-1. 04) PP 0. 9051 109 86. 7 31 0. 36 110 85. 5 59 0. 69 0. 52 (0 .3 4-0. 80) 73 54. 2 18 0. 33 76 53. 4 34 0. 64 0. 54 (0 .3 1-0. 96) R T 0. 2020 133 102. 4 43 0. 42 126 95. 9 70 0. 73 0. 58 (0 .3 9-0. 84) 49 38. 5 6 0. 16 60 45. 0 23 0. 51 0. 31 (0 .1 2-0. 75) Ra te r at io s, 9 5% c on fi de nce in ter val s an d p-va lue s fr om P oi ss on re gr es si on m ode ls w it h gr oup, s ubgr oup fa ct or a nd the ir int er ac ti on as inde pe nde nt va ri a-es .