Responsible Investment: Should Investors
Incorporate ESG Principles When
Investing in Emerging Markets?
With Descriptions from Sub-Saharan Africa
Master’s Thesis in Economics
Author: Pontus Hörnmark
Tutor: Per-Olof Bjuggren
Assistant Tutor Louise Nordström Jönköping May 2015
Master’s Thesis in Economics
Title: Responsible Investment: Should Investors Incorporate ESG Principles When Investing in Emerging Markets
Author: Pontus Hörnmark
Tutor: Per-Olof Bjuggren
Assistant Tutor: Louise Nordström
Date: 2015-15-10
Subject terms: Responsible Investment, ESG, CSR, SRI, Emerging Markets
Abstract
The aim of this thesis is to test whether incorporating principles of responsible investment will have an impact on financial performance when investing in emerging markets. A devel-oped market is included to bring up potential structural differences between emerging and developed markets. Principles of responsible investment suggested by the UN concerns en-vironmental, social, and governance (ESG) issues. The financial performance of highly rated ESG portfolios was evaluated by using the capital asset pricing model (CAPM) and the Fama French 3-factor model. Alpha has been used as the performance measurement. Results reveal that incorporating principles of responsible investment by using a best-in-class approach generates statistically significant and positive alphas in emerging markets, while the devel-oped market of the U.S generates an insignificant alpha.
Acknowledgements
Firstly, I would like to thank my tutors Per-Olof Bjuggren and Louise Nordström for helping me and providing constructive feedback and critique throughout the process of writing this thesis.
Secondly, I would like to give thanks to my family and Olivia Gustafsson for providing much needed support over the final semester of writing this thesis.
Definitions
Responsible Investment: An approach to investment that acknowledges the relevance
and importance of environmental, social and governance factors, and of the long-term health and stability of the market as a whole. It is sometimes also referred to as socially responsible investment (SRI)
Emerging Markets: A term that investors use to describe a developing country, in which
investment would be expected to achieve higher returns but be accompanied by greater risk (Financial Times).
Frontier Markets: A term that investors use to describe a developing country, which is
considered to have lower market capitalization and less liquidity than most emerging markets. The expectation is that over time frontier markets will take on the characterisitics of the majority of emerging markets.
Foreign Direct Investment: An investment made to an entity in another country than
the issuing entity. Can be done by either acquiring shares, setting up a subsidiary or associate firm, or by merging. According to OECD a minimum of 10 % ownership in the target investment is needed to be considered a FDI relationship.
Corporate Social Responsibility: Refers to actions corporations take for their impact
on society. Aims to ensure corporations compliance to laws, ethical standards, and international norms.
Investor: participants on financial markets whom engage in trade of financial assets with
expectations of future returns.
Securities: Term for ownership claims of assets, debt, or derivatives.
Private Equity: An asset class were investors pool together capital to create a fund.
Investments is then made directly into private companies or by conducting buyouts of publily listed companies whith the aim of improving their financial results.
Greenwashing: the practice of overemphasizing a company’s sustainability credentials,
often by misinforming the public or understating potentially harmful activities (Oxford reference)
Abbrevations and Acronyms
PRI Principles of Responsible Investment SRI Socially Responsible Investment CRS Corporate Social Responsibility
UN United Nations
ESG Environmental, Social and Governance
CRISA Code for Responsible Investing in South Africa GDP Gross Domestic Product
FDI Foreign Direct Investment
PE Private Equity
BRIC Brazil Russia India China
Table of Contents
Definitions ... i
Abbrevations and Acronyms ... ii
1
Introduction ... 1
1.1 Background ... 1 1.2 Problem ... 3 1.3 Purpose ... 3 1.4 Delimitations ... 3 1.5 Methodology ... 42
Frame of Reference ... 5
2.1 Theories of Corporate Social Responsibility ... 5
2.1.1 Instrumental Theories ... 5
2.1.2 Political Theories ... 6
2.1.3 Integrative Theories ... 7
2.1.4 Ethical Theories ... 8
2.1.5 The Difference Between The Theories ... 8
2.2 Theories of Traditional Finance ... 9
2.2.1 Firm Performance ... 9
2.2.2 Market Efficiency ... 10
2.2.3 Managerial Discretion ... 11
2.3 A Model on Investor Preference and SRI ... 12
2.4 Previous Work ... 14
2.5 Responsible Investment Strategies ... 17
2.6 Responsible Investment in Africa ... 17
3
Method and Data ... 20
3.1 Models ... 20
3.1.1 Single-Index Model ... 21
3.1.2 Multi-Factor Model ... 21
3.2 Regression Estimation Procedure ... 23
3.3 Data ... 23
4
Empirical Results and Analysis ... 27
4.1 CAPM ... 27
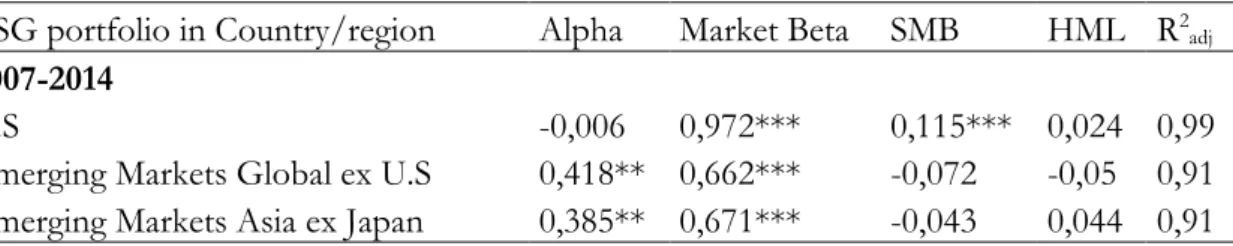
4.2 Fama French 3-Factor Model ... 28
4.3 Analysis ... 29
5
Conclusion and Discussion ... 34
Figures
Figure 2-1 Increased Demand for SRI Opportunities ... 13
Figure 3-1 Market Cap Share of Benchmark ... 24
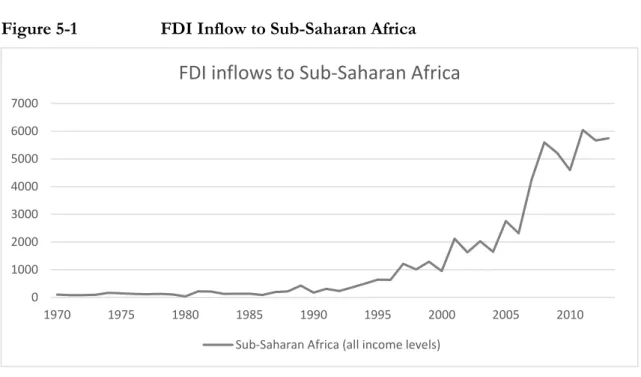
Figure 0-1 FDI Inflow to Sub-Saharan Africa ... 39
Figure 0-3 ESG Trend South Africa ... 39
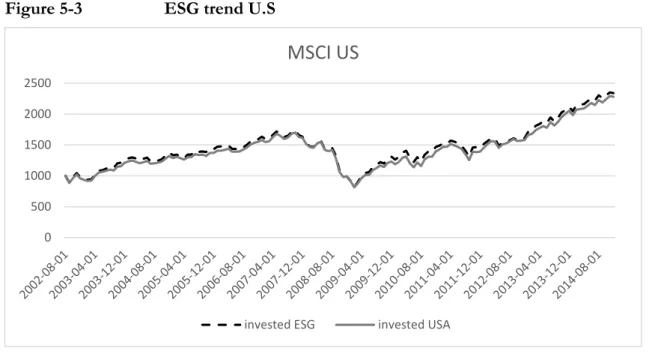
Figure 0-4 ESG trend U.S ... 40
Figure 0-5 ESG trend Emerging Markets ... 40
Figure 0-6 ESG Trend BRIC ... 41
Tables
Table 2-1 Theories and Results ... 9Table 2-2 Summary Previous Work ... 16
Table 3-1 ESG Ratings of Companies in Each Portfolio ... 23
Table 3-2 Data Summary Monthly ... 25
Table 3-3 Overall Performance ESG* ... 25
Table 4-1 Results CAPM Model ... 27
Table 4-2 Results Fama French 3-Factor Model ... 28
Appendix
Appendix………...………391
Introduction
1.1
Background
“Sustainability… is about creating enterprises that create new jobs, increase skills, the businesses make a positive impact on the communities in which they invest, benefit the
environment, improve the transparency and good business practice”
This citation by Stephen J. Bell (IFC, World Bank Group, 2011) about sustainable investment in Sub-Saharan Africa sums up some of the issues that many African countries experience at the moment. In 2006 the United Nations launched a set of principles for responsible investments at the New York Stock Exchange. The principles were developed by a 20-person group drawn from institutions in 12 countries supported by a 70-people group which consisted of experts from the investment industry. The new responsible investment approach acknowledges the importance of Environmental, Social, and Governance factors (ESG). The principles are as follows:
Principle 1: We will incorproate ESG issues into investment analysis and decision-making processes. Principle 2: We will be active owners and incorporate ESG issues into our ownership policies and practices. Principle 3: We will seek approprate disclosure on ESG issues by the entities in which we invest.
Principle 4: We will promote acceptance and implementation of the principles whitin the investment industry. Principle 5: We will work together to enhance our effectiveness in implementing the principles.
Principle 6: We will each report on our activities and progress towards implementing the principles.
Currently there are 1,330 signatories in form of asset owners, investment managers, and service providers with USD 45 trillion in combined assets to the principles of responsible investment program (UN Global Compact, 2015). The signatories contribute to sustainable
This chapter will go through the background of the thesis. Some historical information and development throughout the years of responsible investment will be mentioned in section 1.1. Section 1.2-1.5 describes the problem, purpose, delimitations, and methodology of the study. The problem describes the matter of the thesis and why it deserves to be studied. The purpose denotes what aspects of the problem that this thesis aims to treat. Delimitations mentions the limits to the study and the section on methodology will briefly explain the nature and characteristics of the study.
development through new investment or redirection of existing investment through a more responsible and sustainable conduct.
Environmental and social pressure in recent years driven by scarcity of food and water, access to natural recourses, human rights, and ageing population in the western world are of increasing significance for corporations all over the world. The financial crises of the 21th
century so far have lifted issues on governance such as transparency, corruption, shareholder rights, business ethics, executive compensation, and board structure. All the issues mentioned above has caused managers to encounter increasing demand for corporate responsibility (McWilliams et. al, 2001).
Foreign direct investment flows with a growing pace into Sub-Saharan Africa, (see Figure 0-1 in appendix). The average monthly wage for unskilled labor in some African countries in 2009 such as Ethiopia and Tanzania ranged from USD 35-130, while in the same time period in China it ranged between USD 197-278 (World Bank, 2009). This wage discrepancy might suggest that more corporations, especially in the manufacturing sector will reallocate their production toward African markets. This will lead to a continued increase in FDI towards Sub-Saharan Africa. Many of the issues that the principles for responsible investment touches upon are at another magnitude in emerging markets compared to the developed world such as scarcity of food, water, energy, human rights, corruption, and access to natural recourses. By agreeing to the principles mentioned above FDI can provide a unique opportunity to create and drive inclusive growth in markets where the need is greatest. Socially responsible investment has been around for hundreds of years, one of the earliest documented examples is from the 17th century when Quakers refused to profit from
companies associated with slave work. Other historical eras of SRI was when religious groups refused to invest in production of alcohol and tobacco in the early 20th century, as well as in
the 1980’s many European and U.S investors avoided investment in apartheid South-Africa (Larson, 2015). Throughout the years responsible investment has appeared in different shapes and forms. Initially it was called value-based or ethical investment, the previous mentioned examples of Quaker and the religious groups were part of this phase. Later on SRI (Socially Responsible Investment) was introduced and this is when companies started to carry out CSR (Corporate Social Responsibility) reporting. Since the UN implemented the principles of responsible investment in 2006 the use of the term SRI and CSR is moving more towards ESG integration and reporting as the global standard (Auriel Capital, 2015).
1.2
Problem
Few people might argue against that sustainability is needed for the international market, especially in emerging and frontier markets. But as always, there is a difference between walking the walk and talking the talk. In a report conducted by the World Bank Group (2011), investors and stakeholders of Sub-Saharan African investments rated barriers to integrate sustainable environmental, social and governance principles into investment decisions. Among the highest rated barriers were the lack of evidence that ESG factors will have an impact on financial returns, too costly to implement, and lack of necessary expertise. Previous research on ESG-integration and financial performance is not convincing either way. Therefore this study will examine and evaluate the financial performance of ESG-integrated portfolios compiled of highly rated ESG corporations across both emerging and developed markets against their benchmark indices.
1.3
Purpose
As the financial markets over the world tends to be more globalized, the importance of understanding emerging markets increases. This study will test if investors can expect worse, none, or better financial performance by integrating and applying principles concerning environmental, social, and governance issues when investing into emerging Africa. By comparing and evaluating past performance of sustainable investments in similar markets and compare the results to a developed market my hope is that this report will contribute and potentially shape policy making for investors whitin the area of responsible investment in emerging markets.
1.4
Delimitations
The lack of data from African stock exchanges and reports on ESG issues makes it hard to make a study solely based on African markets. Hence, emerging markets is going to be used as an approximation estimate for similar market conditions as Sub-Saharan Africa. The limitations in the dataset is that all indices are denominated in USD, hence there might differences in the financial returns if one were to analyze the currency exchange rates of local curriencies. Although this does not take PPP into consideration as the exchange rate adjusts so that an identical good in two different countries may have a different price when expressed in the same currency. The use of USD denominated indices and portfolios is conventional when taking the perspective of a foreign investor.
The data is limited with regard to time. The emerging markets ESG portfolio has measured returns since September 2007 to December 2014, hence that is going to be time horizon analyzed for the U.S ESG portfolio as well. The ESG portfolio in South Africa and BRICs only has historical data from july 2013 to january 2015. Due to the short time period of the two latter mentioned markets they will only be analyzed in the CAPM single index model.
1.5
Methodology
A quantitative research method is used. Results and conclusion are going to be drawn from data. The research methods applied in this study will allow one to analyze and compare the results generated through the data. Quantitative research is the systematic examination of social phenomena, using statistical models and mathematical theories to develop, accumulate, and refine the scientific knowledge base. Unlike qualitative research, quantitative research emphasizes precise, objective, and generalizable findings, and is characterized by hypothesis testing, using large samples, standardized measures, a deductive, and rigorously structured data collection instruments. Quantitative research emerged from the positivist tradition de-veloped in the beginning of the 19th century in France (Shenyang, 2008).
2
Frame of Reference
2.1
Theories of Corporate Social Responsibility
Responsible investment and corporate social responsibility (CSR)1 provides a landscape of
theories that can be divided into four major groups according to Garriga, Melé (2004). The theories are grouped as 1. Instrumental Theories, 2. Political Theories, 3. Integrative Theories, 4. Ethical Theories. Each category of theories presents different topics that relates to responsible investment such as profits, political performance, social demands and ethical values. The theories discuss what CSR really implies, whether it is about responsibilities or liabilities of firms. By studying these theories the reader will get a more in-depth view over opinions on why corporations should or should not engage in issues concerning Environmental, Social, and Governance issues.
2.1.1 Instrumental Theories
This group of theories only view firms as a mean for wealth creation. Hence the firm’s responsibility is solely to maximize shareholders wealth. If firms engage in social activity it is only a mean to create profit. The following citation was made by Milton Friedman (1970) on the topic of social responsibility of corporations.
"There is one and only one social responsibility of business – to use its resources and engage in activities designed to increase its profits so long as it stays within the rules of the game, which is to say, engages in
open and free competition without deception or fraud."
Hence, as long as a corporation stays within the rules and regulations of its market they are doing what they are supposed to do, i.e. maximize shareholders wealth. Friedman also states that social responsibilities are for individuals not businesses. Later on Jensen (2000) stated two issues with whether firms should maximize their value or not. Firstly, purposeful
1 CSR would be the traditional way a corporation handles ESG issues
In section 2.1 theories on corporate social responsibility will be presented along with a review of theories and concepts within traditional finance (2.2). Previous studies related to the topic of responsible investment, responsible investment strategies, and a section on responsible investment in Africa will be covered in section 2.4-2.6. For definitions and outline of abbreviations and acronyms see section i and ii.
behavior requires the existence of a single valued objective function, Jensen explains that there is no reason to maximize more than two dimensions at the same time. Thus telling a manager to maximize multiple objectives (such as maximizing both profit and social performance) is the same as giving no objective at all. The second issue is that total firm value maximization makes society better off. Thus social welfare is maximized when a firm attempts to maximize its own total market value. Therefore according to Jensen and Friedman a firm should only engage in social activities if it increases profits or the long term value of the firm, only then will society be better off.
The phrase “Strategic Philanthropy” relates well to the topic discussed by Friedman and Jensen. The phrase means that corporations engage in social activities to generate goodwill among customers, employees and local communities (Porter and Kramer, 2002). This sort of cause-related marketing is often viewed by critics that it emphasizes publicity rather than social impact. There is a convergence of interests when dealing with responsible investment, which are of pure philanthropic character and of pure business. A successful CSR initiative yields a combination of both social and economic benefit for the society and the firm. Reporting on ESG issues and implemeting them into a corporations business practice are costly activites, therefore the integrative theories predicts worse financial performance of a corporation that carries unnessecary expenses.
2.1.2 Political Theories
These theories are sometimes referred to as “Corporate Citizenship” and “Corporate Constitutionalism”, i.e. the connection between corporations and society. The idea of corporate citizenship states that corporations are more or less equivalent to a citizen in a societal setting. Hence businesses need to take the society where it operates into account when conducting its business. The theory arises from the view that large corporations have come to replace the role of some governmental institutions, thus giving firms an increasing importance in the making of social contracts between corporations and society (Dion, 2001). The main outcome of the theory is that corporate citizenship is focused on rights, responsibilities, potential partnerships of business in society, responsibility towards the local community and a willingness to improve the local community and its environment.
Corporate constitutionalism was initially explored by Davis (1960). It was more focused on the power that corporations possess in society. Davis stated that:
Thus he was against the assumption of the theory of the firm that the involvement of corporations in society is solely to create wealth (Jensen and Meckling, 1976). Another claim that Davis made was the principle of “The iron law of responsibility”, which is described in his own words:
“Whoever does not use his social power responsibly will lose it, in the long run those who do not use power in a manner which society considers responsible will tend to lose it because other groups eventually will step
in to assume those responsibilities”.
Thus in the long run when society demands responsibility from businesses, the ones that do not act responsibly will lose their impact on society. Political theories does not predict any specific financial benefits of acting responsibly, but it is rather a responsibility for corporations to engage in environemtnal, social and governance issues.
2.1.3 Integrative Theories
The general idea behind integrative theories is that businesses depend on society for its existence and growth. Hence social demand is the way a corporation interacts with society. Thus managers should make sure that their corporations operates in accordance with social values to be able to continue to grow and be profitable (Preston, 1975). “Social Responsiveness” is a concept that emphasizes the process in which a corporation response to current social issues (Wartick and Rude 1986). The aim is to minimize “surprises” that firms might be exposed to as the social and political landscape changes. The social responsiveness concept was criticized as insufficient and instead a new concept named “The principle of public responsibility” was created by Jones (1980). The word public was used instead of social, since social issues can be thought of different according to various morality-stance groups. The principle advocates that public policy should not only include law and regulation but also the broad pattern of social direction reflected in public opinion, emerging issues, and formal legal requirements.
Scwartz and Carrol (2003) proposed three core domains that corporations should integrate into their practices. The domains were on economic, legal and ethical responsibilities of corporations. The economic and legal dimensions are considered as required, while being ethical is only expected by the society. In an earlier version by Carrol (1991) the model had a fourth dimension which was described as a desire from society that corporations should engage in philanthropic activities as well. Similarly to political theories, integrative theories
does not predict any specific financial performance, the engagement in environmnetal, social and governance issues is rather a responsibility towards society.
2.1.4 Ethical Theories
The last main group of theories on the relationship between business and society is the ethical theories. These theories wants to integrate principles into corporations so that by doing right, corporations can contribute to build a better society. The major theory within ethical theories is the stakeholder theory. The theory is based on two major concepts. Firstly, stakeholders are persons or groups with a legitimate interest in corporate activities. Secondly, the interests of all stakeholders are of intrinsic value, i. e. each group of stakeholders value their own stake in the firm, not only the firms ability to further the interest of shareholders (Donaldson and Preston, 1995). Thus this theory requires firms to pay attention to the interests of all stakeholders and not only the shareholders. Examples of stakeholders are governments, owners, customers, non-governmental organizations, communities, suppliers, financial communities, competitors, and employees.
An analytical approach to stakeholder theory by Freeman (2015) states that there are three levels of analysis to understand a corporation as a whole. The first is the rational level, which is how the firm fits into a larger environment. Secondly, at the process level which is described as how firms operate in their routine processes. Thirdly, the transactions which is how the firm executes deals and contracts to stakeholders. A short example would be the following, rational level: How does firm X respond to a change in regulation in the industry which it operates in. process level: how does the internal performance and reward procedures work? transactions level: examine how the salesperson is treating customers. Ethical theories advocates for that responsible practices creates a profitable environment for the firm, thus it will enhance financial performance.
Universal rights and sustainable development are two major goals of ethical theories. Although these issues are usually handled at macro-level rather than at corporate level. These issues were the foundations to why the ESG principles where introduced in 2006 by the United Nations.
2.1.5 The Difference Between The Theories
Instrumental theories considers corporate social responsibility only as a strategic tool to achieve economic objectives, and ultimately wealth creation. Friedman and Jensen are examples of advocators to this approach, it is a widely accepted business practice globally
(Windsor, 2001). Political theories emphasize the interaction and connection between business and society. The major approach whithin political theories is corporate citizenship. The idea is that corporations have come to replace the role of many institutions in society (Dion, 2001). The importance of the connection between coporations and society has created a demand for meeting legal, ethical, and economic responsibilities placed on corporations by shareholders. Political theories distinguishes themselves against instrumental theories as they stress the responsibility against society, while instrumental theories consider corporations only responsibility is wealth maximization for their shareholders. Integrative theories are similar to political theories, although they underline that corporations are dependent on society for their existence. Hence to be able to continue to grow and be profitable a corporation has to respond to social demands (Wartick and Rude, 1986). The main approach whitin ethical theories is stakeholder theory, which points out that corporations should not only maximize shareholder value, but rather pay simultaneous attention to the interests of all stakeholders related to the firm. The main divider between the theories is to whom corporations are responsible for creating wealth. Table 2-1 below presents a summary of the results from each theory and their implications.
Table 2-1 Theories and Results Theory Result
Instrumental Theories Corporations should maximize shareholder’s wealth
Political Theories Corporations have a responsibility to society to fulfill certain functions Integrative Theories Corporations are dependent on the wellbeing of society to exist and be profitable Ethical Theories Corporations should consider the interest of all stakeholders
2.2
Theories of Traditional Finance
The following concepts in financial theory are relevant as they are the building blocks in the model suggested by Mackey et al (2007), which will be discussed in the following section (2.3) on price determinants of socially responsible investment opportunities.
2.2.1 Firm Performance
There is a variety of definitions and ways to calculate firm performance. Some scholars examine cash flows (which is discussed more in detail in subsection 2.2.3) while others look at other parameters of firms. For the purpose of this report which aims to examine whether
investors should integrate ESG-principles when making investment decisions the performance measure will be through the price of equity. By multiplying the price of equity to the amount of outstanding shares one gets the market value of equity of a firm. The advantage of using price of equity as a measurement for firm performance is simply because it is easily measured as an indicator of firm performance. Thus historical data compounded over different time horizons can be analyzed and assessed. Tobin (1969) introduced Tobins q which was intentended to normalize firm performance by creating a ratio between the value of capital, both equity and liabilites relative to its replacement cost. Thus q values over 1 indicates that the market value is greater than the value of the corporations recorded assets, while q values less than 1 indicates that the market value is less than the recorded value of assets. Tobins q can give investors a hint on if the securities they are analyzing is over or undervalued.
2.2.2 Market Efficiency
According to Fama (1970) ”A market in which prices always fully reflect available information is called efficient”. Fama described that the primary role of capital markets is the allocation of ownership of an economy’s capital stock. Thus, investors choose among investment opportunities under the assumption that prices at any time fully reflects available information. There are three forms of efficient markets according to Fama. Weak form, suggests that security prices today is a reflection of historical price-related information. Hence an investor can make better returns by analyzing past performance of securities. In equation 2-1 the weak form of efficient market hypothesis is explained. Where 𝑃𝑡is the
current price of a stock, 𝑃𝑡−1denotes the last observed price, 𝐸[𝑅] is the expected return and
the final component denoted as 𝜀 is a random compenent of the equation. 𝑃𝑡 = 𝑃𝑡−1+ 𝐸[𝑅] + 𝜀 (2-1)
Semi-strong form, prices reflects all publicly available information. To gain better returns an
investor needs to have inside or private information on securities. Strong form, prices reflects all publicly and private information. Investors are not able to gain better returns based on either historical, publicly, or private information. Efficient market hypothesis suggests that companies with ESG reporting and their ratings is publicly available information for investors, hence its significance and value contribution for investors is already included in the price of equity of these firms. This study assumes a semi-strong efficient market hypothesis.
The essence behind efficient market hypothesis is that prices of stocks should follow a “Random Walk”. That is, price changes are random and unpredictable, although it is not because of market irrationality but rather as a consequence of investors competing to discover information on whether they should buy or sell stocks before the rest of the market becomes aware of the same information (Bodie et. al, 2013). The same authors (Bodie et. al) claimed the following on the topic of efficient markets:
“The market is competitive enough that only differentially superior information or insight will earn money, the easy picking have been picked.”
2.2.3 Managerial Discretion
Firm’s Cash flows can be used to value firms. Free cash flow is a term which is the cash flow in excess of that required to fund all projects that have positive net present values when discounted at the relevant cost of capital (Jensen, 1986). Conflict of interest between shareholders and managers over payout policies etc. has caused a problem on how to motivate managers to reach a firms optimal size. Free cash flow to equity is used to calculate the equity available to shareholders after accounting for the expenses to continue operations and future capital needs for growth. The firm’s value of equity according to free cash flow to equity is described through the equation (2-2) below.
∑
𝐹𝐶𝐹𝐸𝑡 (1+𝑘𝐸)𝑡+
𝑃𝑇 (1+𝑘𝐸)𝑇 𝑇 𝑡=1 (2-2)FCFE denotes the free cash flow to equity, ke is the cost of equity and g denotes the growth
rate of FCFE. Hence a decrease in the firms FCFE results in a lower valuation of market value of equity, thus decrease in stock price of a publicly traded firm (Bodie, et. al, 2013) Individual investor entrust their personal wealth to managers of publicly held corporations in hope to receive financial returns on their investment. There is however an agency cost related to this, since there may be conflict between the interest of shareholders and managers. Thus a Manager might have incentives to maximize his own wealth and not the shareholders wealth. This principal-agency issue is commonly handled by the forming of contracts. The level of agency cost depends on statutory and common law in the process of forming contracts between the parties involved (Jensen, Meckling, 1976).
2.3
A Model on Investor Preference and SRI
Mackey et. al (2007) created a theoretical model in which they explain how the supply and demand for socially responsible investment opportunities determine whether engaging in responsible activities can improve, reduce, or have no impact on a firm’s market value of equity. The authors describe the conflict between traditional economic arguments were managers should only make decisions that maximize shareholder’s wealth, while the other hand some scholars argue that firms have a duty to society, and their responsibilities goes well beyond only maximizing shareholder’s wealth. The latter scholars argue for that socially responsible behavior can enable a firm to differentiate its products, avoid costly government fines and fees, and can act to reduce a firm’s exposure to risk. Although, Mackey et. al advocate that there is a way to resolve the conflict. The theory explains how managers in publicly traded firms can engage in socially responsible activities that do not maximize the present value of the firm’s future cash flow, yet still maximize the market value of equity of the firm. The model is derived from a simple model of supply and demand. The model is explained through the equations denoted below:
𝑆𝑆𝑅 = 𝜃𝑠𝑁 (2-3)
SSR: Available supply of stock in firms that are funding socially responsible activities
N: Total firms in an economy s: Number of stocks
Θ: Proportion of firms engaging in socially responsible behavior
𝐷𝑆𝑅 = 𝜔𝑚𝐼 (2-4)
DSR: Total amount of money controlled by socially conscious investors
I: Total investors in an economy m: Amount of money per investor
ω: Proportion of socially conscious investors
𝑃
𝑆𝑅=
Θ𝑠𝑁 𝜔𝑚𝐼=
(1−𝜔)𝑚𝐼(1−Θ)𝑠𝑁= 𝑃
𝑃𝑀 (2-5)(1-ω): Proportion of wealth maximizing investors (1- Θ): Proportion of profit-maximizing firms
PSR denotes the price for a stock in a socially responsible firm, while PPM denotes the price of
a share in a profit maximizing firm. Equation (2-5) shows supply and demand for socially responsible investment opportunities in equilibrium, hence when the share of the population demands the same share of supply of shares in socially responsible investment. When the market is out of equilibrium, firms that are looking to maximize their profits now have an incentive to change their type of behavior to meet the new demand from investors.
If there is a difference between the financial performance of socially responsible firms and conventional firms this could be explained through Mackey’s et al. theory that the supply and demand for socially responsible investment opportunities is out of equilibrium. Hence there is either excess supply or demand. (For a more explicit explanation of what determines stock prices look at the section on theories of traditional finance in 2.2) In a situation where there is excess supply of a specific investment opportunity, the price of it should be lower than its benchmark. In a situation where there is excess demand for a specific investment opportunity the price should exceed its benchmark.
Figure 2-1 Increased Demand for SRI Opportunities
The aim of including this model is to be able to make sense and interpret the empirical results of this study. Figure 2-1 above shows a graphical interpretation of how an increase in proportion of demand for socially responsible investment opportunities increases price in a competitive market. An assumption is made that the supply of socially responsible investment opportunities is less responsive to changes in demand. Since for example to increase the proportion of supply of socially responsible investment opportunities there has to be either new issue of shares or additional profit maximizing firms reallocating towards
Price
SRI
Quantity SRI
Increased Demand For SRI Opportunities
Supply SRI Demand SRI
being considered socially responsible, making the public aware of such a reallocation through ESG ratings etc. is generally associated with a time lag. Demand is assumed to be more responsive to change due to the nature of media attention and liquidity of markets.
2.4
Previous Work
In the previous section (2.1) on corporate social responsibility some theories was introduced to get a more general knowledge behind the issues of whether corporations should engage in ESG issues or not. This study aims to answer whether investors should integrate ESG principles when investing in emerging Africa. As stated in the problem section of this report, one of the major barriers to if investors should take ESG principles into account was the lack of evidence on financial performance of ESG-integrated investment opportunities. With the theories stated in the previous section, the following section will go through the body of litterature written on the topic of responsible investment and sustainable investment. The fundamental principle behind SRI is that investors are not asked to give up financial returns in order to invest responsibly. Some investors might even demand better performance from responsible investment practices. The market expects responsible companies to outperform the general market in the long run due to their leadership in adopting low-risk and sustainable practices (Larson, 2015). However, no statistical evidence of significant difference was found between ethical funds versus conventional funds when comparing 103 funds during 1990-2000 by Bauer, et. al (2005). Grossman and Sharpe (1986) constructed a highly diversified portfolio excluding companies with operations in apartheid South Africa. They found that even with the use of risk-adjusted returns their portfolio outperformed the S&P 500 during 1960-1983. Hamilton et. al (1993) found that investors can expect to lose nothing by investing in socially responsible mutual funds, thus socially responsible factors have no effect on expected stock return.
Bello (2005) tested financial performance and portfolio diversification between 42 socially responsible mutual funds against an equal number of randomly selected conventional mutual funds during 1994-2001. Neither Bello found any significant difference between the groups when it came to financial performance or degree of portfolio diversification, he found no significant difference when looking at portfolio characteristics between the groups in terms of portfolio concentration, total portfolio holdings, and size of companies in the portfolio. Although both groups in Bello’s study underperformed the S&P 500 (Standard & Poor 500) and the DSI 400 (Domini Social Index) during the same time period.
When it comes to screening Statman (2006) found that socially responsible investors do not forego a lot of opportunities. When looking at market indices made up of stocks that are considered socially responsible they usually correlate highly to indices compiled of conventional stocks. Orlitzky et al. (2003) did a meta-analysis on the relationship between corporate social/environmental performance and corporate financial performance. By making a quantative study reviewing 52 studies with a total sample size of 33.878 observations. The meta-anaytical findings suggests that corporate virtue in the form of social responsibility and environmental responsibility is likely to pay off. They concluded that by balancing the claims of multiple stakeholders, managers can increase the efficiency of their organization’s adaption to external demands. This is in line with stakeholder theory that is discussed more in the ethical theories section in 2.1.4. By showing a positive correlation between corporate social performance and corporate financial performance, they also rejected the hypothesis that there would be a trade-off between corporate social performance and corporate financial performance, i. e the relationship seems to be simultaneous.
Kempf and Osthoff (2007) tested which of the major SRI strategy that had the best financial performance. They implemented positive screening, negative screening and a best-in-class approach to the S&P 500 and the DS 400 for the period 1992-2004. They found that investors can earn remarkably high abnormal returns by following the strategy2 of the
best-in-class approach. Positive screening also provided positive alphas, while negative screening did not. The alphas stayed siginicant even after taking into account reasonable transaction costs.
Another expected property behind SRI is that in the long run companies should accumulate less risk, due to the fact that firms whom are considered responsible should be less likely to be exposed to scandals such as practices that damage the environment or being associated to child-labor for example. These sort of events are known for damaging a firm’s reputation and its goodwill value. This property was partly confirmed by the Allianz Global Investors when they released a report in (2011) were they found that by optimizing ESG asset allocation investors could reduce tail risk with up to one third of the initial risk. Nofsinger and Varma (2014) compared 240 socially responsible funds during 2000-2011 and their financial performance. By sorting the funds with regards to responsible investment strategy (covered in section 2.5) they found that socially responsible mutual funds outperform
conventional mutual funds during periods of market crises. Although, the cost of protection during crises comes at the expense of underperforming during non-crises. This pattern could be valued by investors seeking downside protection to their investments when exposued to market crisis. Another important result by Nofsinger and Varma (2014) with siginifcance to this report was that the ESG driven portfolios performed genreally better than the their peer funds using other resposnible investment strategies.
Table 2-2 Summary Previous Work
Author Sample Method Result
Bauer et. Al (2005)
103 ethical mutual funds, during
1990-2001
CAPM, 4-factor asset-pricing model
No evidence of statistically sig-nificant difference in return be-tween ethical and conventional
funds Grossman
& Sharpe (1986)
NYSE excluding firms with operations in apartheid South Africa,
during 1960-1983
CAPM, Jensens Alpha South Africa Free portfolio out-performed NYSE by 0,187 % annually
Hamilton et. Al (1993)
32 socially responsible mutual funds and 150 conventional funds,
during 1981-1990
CAPM, Jensens Alpha
No evidence of statistically sig-nificant difference between the performance of conventional and socially responsible mutual funds
Bello (2005)
42 Socially responsible mutual funds and 42 conventional mutual funds, during
1994-2001
CAPM, Jensen’s Alpha, Sharpe Information Ratio,
Excess Standard Devia-tion adjusted return
Socially responsible mutual funds do not differ from conventional funds in asset characteristics, de-gree of portfolio diversification,
or long-run performance
Statman (2006)
4 Socially responsible indexes against S&P 500, during 1990-2004
Alpha, Correlation analy-sis
Returns of socially responsible indexes generally exceed returns of the S&P 500 index. High cor-relation between socially respon-sible indexes and the S&P 500
Orlitzkt et. Al (2003)
Meta-analysis of 52 studies with a sample size of 33.878
observa-tions
Correlation analysis be-tween corporate social performance and corpo-rate financial performance
Positive correlation between cor-porate social performance and corporate financial performance
Another issue that has been discussed in prevous work on responsible investment is the term “Greenwashing”. It refers to the practice of overemphasizing a companys environmental credential. According to Parguel et. al (2011), poor sustainability ratings encourages greenwashing among companies aiming to improve how they are perceived by the public. In
the presence of good sustainability rating practice it deters companies from greenwashing. Another potnential issue is that there is a correlation between high market capitalization and high ESG performance, which might suggest that larger companies can afford to have employees working solely on ESG reporting and sustainability issues compared to smaller or less profitable corporations (Auriel Capital, 2015).
2.5
Responsible Investment Strategies
There are several strategies on how investors make their portfolios socially responsible. First, screening is the most common and used practice. Screening can be either negative or positive. Negative screening refers to exclusion of investment opportunities that do not fit into the ethical standards of the investor. Positive screening is when investors include investment opportunities that are in line with the ethical standards of the investor. Secondly, Shareholder advocacy is a practice when shareholders use their rights to engage in negotiations and petitions against actions carried out by the firm that are not in line with the ethical standards of the owners. Thirdly, Community investment is when corporations invest in the neighboring or affected community to its operating activity (Larson, 2015). Fourthly, Best-In-Class approach is when investors pick the highest ESG-rated investment opportunities relative to their peers, this is the approach that this study has implemented. Fifthly, making investments whithin a specific theme specified by the investor. Below is an interpretation of the strategies suggested by UN Global Compact (2015).
Responsible investing
Traditional Screening ESG integration Themed
Limited or no focus on ESG factors of under-lying invest-ments
Negative and posi-tive screening, and best in class ap-proach. Based on criteria defined in a variety of ways
The use of qualitative and quantitative ESG infor-mation in investment pro-cesses, at the portfolio level, by taking into account ESG-related trends
The selection of assets that contrib-ute to adressing sustainability challegnes such as climate change or water security.
2.6
Responsible Investment in Africa
Some major issues when investing in Sub-Saharan Africa are political instablility, unstable monetary policies, war, violenece, and natural disasters causing famine and disease etc. The World Bank divides Sub-Saharan African nations into emerging markets and frontier
markets. Currently there are only three countries that fits the framework for being an emerging market, they are South-Africa, Nigeria, and Kenya. The rest is considered to be frontier markets (IFC, World Bank Group). One of the largest efforts so far to provide investors with reporting of sustainability was carried out by South-Africa in 2010, when the country’s King Code of Corporate Governance required companies on the Johannesburg Stock Exchange to integrate sustainability into their operations and report on their ESG performance (CRISA, code of responsible investment in South Africa). Mainly South Africa, but also Nigeria and Kenya draws the bulk of investment to the Sub-Saharan region, which might imply that these trends of sustainability reporting is likely to radiate across the continent (IFC, World Bank Group).
There are now over 500 companies listed across 19 different stock exchanges in Africa, although the low liquidity of many African exchanges remains a barrier for investors to move in and out of investment opportunities. Transaction costs on African stock exchanges are still high in comparison to developed exchanges, which reduce the apetite for foreign investors to engage in trade. In Nigeria for example, transaction costs range from 4 to 4,2 % (IFC, World Bank Group). While African Stock exchanges remain illiquid and expensive in terms of transaction costs a popular alternative for foreign investors is to invest via Private Equity. 44 % of private equity funds into Sub-Saharan Africa is ESG branded compared to 20 % under general asset management. Thus, Private Equity is a positive driver in Africa to improve sustainable reporting of firms.
Stuctural features of developing countries3 according to Krugman et al. (2012) differ widely
among themselves. There are no typical structures that accurately descibe all developing countries although they tend to be characterized by some common features. There is usually a history of rigid direct government control of the economy, this is commonly practiced through restrictions on international trade, governemnt ownership or control, control of financial transactions, and a high level of government consumption as a share of GDP. The role of the government in the economy has been reduced over the past decades in various areas of developing areas. There is a history of high inflation in many of the devloping countries. When governments becomes unable to pay for its expenditures, printing money is usually considered to be the easiest way out from insolvency, causing high rates of inflation. Weak credit institutions usually arises in devloping countries. Loans from banks may be made
on the basis of personal connections rather than financing prospective entrepreneurial initiatives. Bank supervision in some developing countries tend to be innefective due to inexperience, incompetence, and corruption.
Limited transparency for asset owners even in publicly traded stocks is commonly occuring. Hence the way managers manage money in firms is usually hard to influence, even for shareholders. The legal framework fo resolving asset ownership and property rights is usually weak. Natural resources or agricultural commodites often make up an important share of exports, usch as gold, coffee, timber, and petroleum. The strict government controls, taxes and regulations has made corrupt practises such as bribery and extortion more frequent in developing countries. Previous studies conducted by Transparency International (2008), shows a strong positive relationship between annual real GDP per capita output and an inverse index of corruption. Transparency international concluded that several factors underlie the positive relationship. Government regulations that promote corruption can potentially harm economic growth. Corruption itself tends to have a negative effect on economic growth and efficiency. Poverty breeds a higher willingness to circumvent the rules.
3
Method and Data
3.1
Models
For the purpose of finding out the past performance of highly rated ESG integrated portfoliostwo main models will be used. The first one is the single index model of the capital asset pricing model (CAPM), which will provide the Jensen’s alpha4 as a performance
measurement of risk adjusted return. The second one is going to be a multi-factor model which is the Fama French Three Factor Model, which also provides alpha as a performance measurement while taking other factors than the market-index into account. There are three possible hypotheses when it comes to the performance of socially responsible funds according to Hamilton, et al. (1993).
The hypotheses are denoted below:
H0: Expected returns of socially responsible portfolios are equal to conventional portfolios H1: Expected returns of socially responsible portfolios are lower than of conventional portfolios H2: Expected returns of socially responsible portfolios are higher than of conventional portfolios
Out of the four groups of theories mentioned in the theoretical framework one can draw conclusions on wheter they predict that corporations engaging in ESG issues receives positive, negative or no financial impact on firm performance. One might argue for that instrumental theories predicts that socially responsible portfolios performs worse than conventional portfolios, as their assets in form of shares in corproations are considered to deviate from the traditional goal of the firm of maximizing shareholder value. Intergrative and political theories are more based on the relationship between society and corporations in terms of responsibilities and dependency. Those theories might suggest that there is neither a gain or loss in financial performance but rather a responsibility for corporations to
4 Might also be denoted simply as Alpha
In this section we will describe and give an account for the methods used in order to conduct the research. Section 3.1 will go through the capital asset pricing model and the Fama French 3-factor model. Section 3.2-3.3 describes the regression estimation procedure and data collection, 3.3 also includes description and summary of the data used in this thesis.
engage in ESG related issues. Ethical theories or more commonly known as stakeholder theory suggests that firms should take all stakeholders into account when conducting business practise to create a profitable environment at all levels of the firms operations, hence they predict a better financial performance from corporations engaging in responsible behavior.
3.1.1 Single-Index Model
The first model that will be used is the Capital Asset Pricing Model (CAPM) single-index model. The intercept which is denoted as α gives the Jensen’s Alpha, which can be interpreted as an under- or out-performance measurement relative to a market proxy. Jensen et al. (1972) states that the model lies under a certain number of assumptions, (1) all investors have risk-averse utility functions and are wealth maximizers and choose among portfolios solely on the basis of mean returns and variance, (2) There are no transaction costs or taxes, (3) All investors have homogenous views regarding the parameters of the probability distribution of all security returns, (4) All investors can borrow and lend at a given riskless rate of interest. In this report alpha will be used as an empirical way of assessing the marginal return associated with the ESG portfolios compared to their indices. The equation for explaining CAPM is:
r
i– r
f= α
i+ β
i(r
m– r
f) + ε
i (3-1)The left hand side of the equation denotes the excess return of the portfolio or security that is going to be evaluated. The right hand side of the equation denotes two sources of uncertainty and one performance measurement. rm – rfis the excess return of a broad
market-index, i.e. the market return minus the risk free rate.
β
i denotes the systematic risk that theportfolio or security is exposed to compared to its benchmark, or the typical response in excess returns against the index’s excess return.
α
i denotes the alpha (Jensens alpha) that isexplained in previous section as any risk adjusted return beyond the market index. The final term in equation (4) is the
ε
i which represents the residual risk, with an expected value ofzero (Bodie et. al, 2013).
3.1.2 Multi-Factor Model
Fama and French (1992) questioned the adequacy of only using a single-index model to explain movement in indices/stocks. The CAPM single index model seemed to fit in data during 1926-1968, but on data during 1941-1990 the relation between Beta and Stock returns
disappears. Fama and French concluded that by adding two additional risk proxies, returns with regard to size and a book-to-market ratio variable one can explain cross-sectional variation in average stock returns more accurately. They found that average returns is negatively related to size and positiviely related to book to market ratios. This implies that smaller firms and firms with low book to market ratios are riskier than other firms. The Fama-French three factor model is explained through equation (5) below.
𝑟𝑖− 𝑟𝑓 = 𝛼𝑖 + 𝛽𝑚(𝑟𝑚− 𝑟𝑓) + 𝛽𝐻𝑀𝐿𝑟𝐻𝑀𝐿+ 𝛽𝑆𝑀𝐵𝑟𝑆𝑀𝐵+ 𝜀𝑖 (3-2)
The left hand side of the equation indicates the excess return of the portfolio or the security against the risk free rate. 𝛼𝑖 Is the intercept or the financial performance beyond what the
following three factors predicts. 𝛽𝑚(𝑟𝑚− 𝑟𝑓) denotes the systematic risk that the portfolio
or security is exposed to compared to its market-index, or the typical response in excess returns against the index’s excess return. 𝛽𝐻𝑀𝐿𝑟𝐻𝑀𝐿 is interpreted as “High-Minus-Low”
ratio, which is explained as a Book-to-Market premium or more explicitly the difference in returns between firms with a high versus low Book-to-Market ratio. 𝛽𝑆𝑀𝐵𝑟𝑆𝑀𝐵 denotes
“Small-Minus-Big” ratio, which is explained as a size premium, or the difference in returns between small and large firms. The final term 𝜀𝑖 represents the residual risk, with an expected
value of zero (Bodie et. al, 2013). The two extra factors in this model compared to the previous Single-Index model is based on the findings of Fama and French (1996) that most anomalies that are found using the CAPM model disappears when using a three-factor model.
HML and SMB variables are constructed in a two-step process. Firstly, size for any firm is defined once a year as the total market value of equity. Two groups are defined, one containing all stocks on the market in which the analysis is conducted that have a size larger than the median size of a stock. The second group is simply the stocks with a size smaller than the median sized stock. Then firms are broken into three groups on the basis of book value to market value of equity. The break points are the lowest 30 %, middle 40 %, and the highest 30 %. Thus 5 marketable portfolios are created. Returns for the market weighted portfolios in each of these five categories is then estimated. Secondly, the HML variable is made by using an analogous approach as the SMB variable above. It represents a series of monthly returns as the high book to market ratio minus the low book to market ratio stocks. By doing this one attempts to have the size variable free of both book to market effects and book to market variable free of size effects (Elton et al, 2011).
3.2
Regression Estimation Procedure
The modern interpretation of regressions analysis is concerned with the study of the dependence of one variable, the dependent variable on one or more other variables, the explanatory or independent variables. The goal is to be able to estimate or predict mean or average value of a population (Gujarati, Porter, 2009). Regression deals with the dependence of one variable on other variables, although it does not imply causation, hence a statistical relationship can never establish a casual connection. The ideas of causation has to come from some theory outside of statistics. This study will analyse time series data, more specific details on the data is discussed in the following section. CAPM, which is a single-index model is going to be estimated by using a two-variable regression analysis. Fama-French, which is a multi-index model is going to be estimated by using a multi-variable regression. For the purpose of this study the most important variable that will be examined is whether the intercept is going to be positive or negative and whether it is going to be statistically significant. For a more detailed view of the equations that are going to be regressed are presented in previous sections 3.1.1 and 3.1.2.
3.3
Data
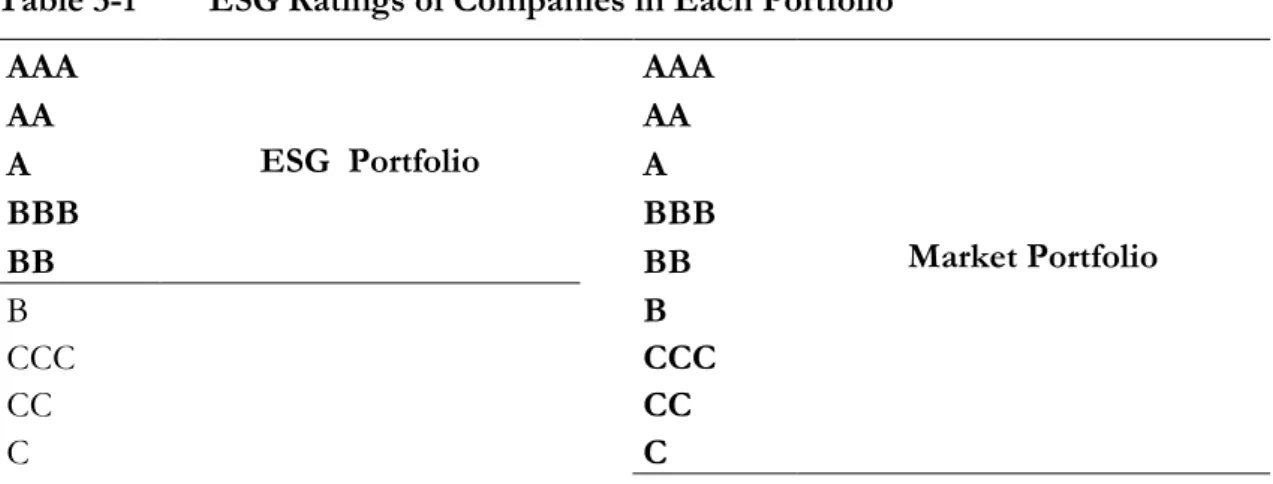
The data in this study is obtained from Thomson Reuters Datastream, which provides information and data on economic research. The data consists of total return-indexes from emerging markets and developed markets. For each market Datastream also offers another index which is an ESG-index. The ESG-index is a capitalization weighted index that provides companies with high ESG performance compared to their sector peers. The index is constructed by MSCI. The Indices will be denoted as ESG portfolio and Market portfolio i. e. the benchmark portfolio. Ratings are done in accordance to table 3-1 below.
Table 3-1 ESG Ratings of Companies in Each Portfolio AAA ESG Portfolio AAA Market Portfolio AA AA A A BBB BBB BB BB B B CCC CCC CC CC C C
For emerging markets the conventional index5 consists of 823 companies operating across
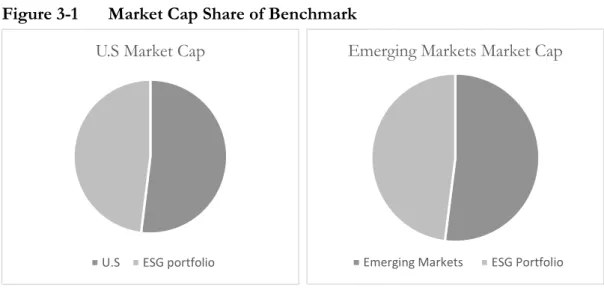
23 emerging markets. The emerging markets ESG portfolio consists of 350 companies with the highest ESG-ratings out of the 823 companies from the MSCI emerging markets index. The ESG portfolio was created in September 2007 by MSCI and provides monthly data. Its sector weights reflects the relative sector weight of the underlying indices to limit the systematic risk introduced by the ESG selection process. For developed markets United States will be used as a comparison group against the emerging markets. The same methodology is applied in creating the U.S ESG portfolio. The benchmark is the MSCI USA index which has 631 constituents which represents the performance of the large and mid cap companies in the US. The ESG portfolio for the US market has 341 consistuents. The market capitalization share for each ESG portfolio to its benchmark is presented below.
The market capitalization for the emerging markets is USD 3.984.060 million and USD 1.910.213 million for the ESG portfolio. The market capitalization for the U.S is USD 19.804.276 million and USD 9.517.330 million for the ESG-portfolio.
For the purpose of this report the ESG-indices will be handled as portfolios and their performance will be evaluated against their benchmarks. All data is denominated in USD as this report takes the perspective of a foreign investor, therefore USD is useful as a world currency. Data availability is better for returns presented in USD than with local currency as well. Table 3-2 below presents some summary statistics for the monthly data used in this
5 Market Portfolio
Emerging Markets Market Cap
Emerging Markets ESG Portfolio
Figure 3-1 Market Cap Share of Benchmark
U.S Market Cap
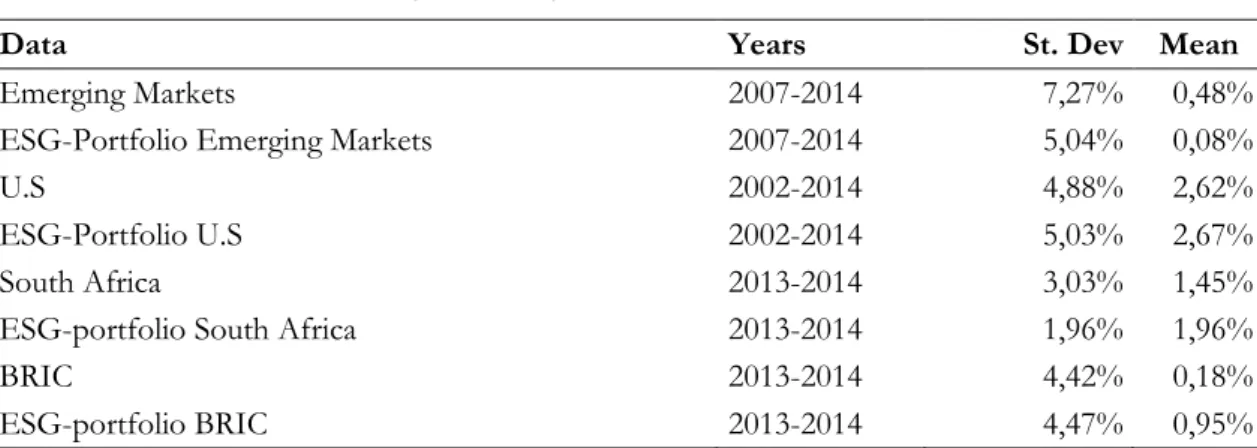
study. One can observe that emerging markets seems to have the highest risk in terms of standard deviation compared to the developed market of the U.S. Although, The U.S portfolios seem to provide the highest average returns compared to the rest of the markets included in the study.
Table 3-2 Data Summary Monthly
Data Years St. Dev Mean
Emerging Markets 2007-2014 7,27% 0,48%
ESG-Portfolio Emerging Markets 2007-2014 5,04% 0,08%
U.S 2002-2014 4,88% 2,62%
ESG-Portfolio U.S 2002-2014 5,03% 2,67%
South Africa 2013-2014 3,03% 1,45%
ESG-portfolio South Africa 2013-2014 1,96% 1,96%
BRIC 2013-2014 4,42% 0,18%
ESG-portfolio BRIC 2013-2014 4,47% 0,95%
All companies are measured based on publicly available information. The data framework is identical for all companies in a sector allowing the generation of comparable across sectors, industries and countries. Each sector, industry or country has specific assessments and relative valuation models and portfolio monitoring (Thomson & Reuters, 2013). The indices are based on a “best in class” approach, i. e no negative screening is made in the compilement of the ESG-portfolios (read more on this in section 2.6 on responsible investment strategies).
Table 3-3 Overall Performance ESG*
The reliability of the data, i. e. the consistency is dependent on the construction of the indexes and portfolios by MSCI, although the sampling procedure for such a well known financial data provider has to be rigorous, table 3-3 above shows the sampling methodology carried out by MSCI.
Environmental Performance Corporate Governance Performance Social Performance
Resource Reduction Board Structure Employment Quality
Emission Reduction Compensation Policy Health and Safety
Product Innovation Board Functions Development
Waste Total Shareholder Rights Human Rights
Waste Recycle Gender Diversity Injury Rate
Energy Use Total Audit Independence Women Employees
Water Withdrawal Vision and Strategy Community
Since data from several international markets can be obtained, a cross-market comparison can be made between emerging markets and developed markets. Potential threats to the reliability of the data would be if there are a lot of individual variation and inconsistency in the compilement of the firms in the ESG-portfolios over time. Another issue regarding the stability of the data is the time horizon. The historical observations of monthly data is limited, which might imply that the predictive validity observed in this study is limited to short-term to medium-term. SRI is considered to be a long-term approach to investment, thus the short-term availablility of data might be a potential threat to the validity of the findings in this study. Although if the same sort of behavior can be observed over several markets, that might indicate that there is still reliability to the study.
All data on the Fama-French factors that are used in the multi-index model are obtained from Keneth R. French’s data library. The factors for emerging markets is more of a struggle to find good data on. The data that is the best proximation for emerging markets that is going to be used is the following; world excluding U.S, and South East Asia exluding Japan. Theese datasets will do as a proximation for Fama-French factors in emerging markets. For the risk free rate which is used in both single index and multiple index model 3-month U.S treasury bill rate is used. Historical rates on treasury bills is obtained through Thomson Reuters Datastream.
4
Empirical Results and Analysis
4.1
CAPM
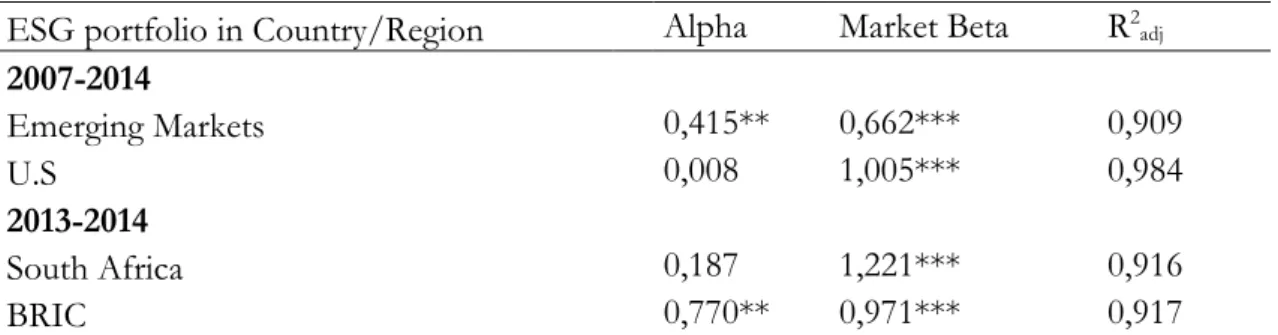
The results from the single index model CAPM is presented in table 4-1 below. As mentioned before in the data section of this study, each market has a ESG-Portfolio consisting of BB or higher rated companies out of the benchmark’s body of companies. Emerging markets and the U.S has a longer time horizon of observations. South Africa and BRIC only has ESG related data for the past two years. Jensens Alpha which is denoted as Alpha in table 4-1 has a positive sign for each ESG portfolio. Emerging markets shows a statistically significant alpha at the 5% level, as do the ESG portfolio in the BRICs. U.S and South Africa presents positive alphas, although they are not statistically significant at any level.
Table 4-1 Results CAPM Model
ESG portfolio in Country/Region Alpha Market Beta R2 adj 2007-2014 Emerging Markets 0,415** 0,662*** 0,909 U.S 0,008 1,005*** 0,984 2013-2014 South Africa 0,187 1,221*** 0,916 BRIC 0,770** 0,971*** 0,917
* Significant at the 10% level
** Significant at the 5% level
*** Significant at the 1% level
Reported above are the OLS estimates for each markets ESG Portfolio. The model that has been used is the CAPM model
ri – rf = αi + βi (rm – rf) + εi
CAPM for U.S gives a R2
adj of 0,984 and a market beta of 1,005 suggesting that there is very
little variation between price movements in the ESG-portfolio and its benchmark, almost all of the movement in the ESG portfolio is explained by the movement in the U.S benchmark.
This section contains all empirical results from the CAPM single index model and the Fama French 3-factor multi index model. The results are obtained by running regressions on high ESG-rated portfolios against their benchmarks. The regressions are run in order to answer the research question for this study. The chapter concludes in an analysis section where we try to interpret and make sense of the results obtained through the models. A note on policy implications is also presented at the end of the analysis section.