Main field of study – Leadership and Organisation
Degree of Master of Arts (60 credits) with a Major in Leadership and Organisation
Master Thesis with a focus on Leadership and Organisation for Sustainability (OL646E), 15 credits Spring 2016
Supervisor: Jonas Lundsten
The Use of Social Impact Measurements in
Socially Entrepreneurial Organizations
A Quantitative Survey Study on Organizational Size
Albina Iljasov
Abstract
This thesis investigates the relationship between organizational size and the decision of using social impact measurements in Swedish socially entrepreneurial organizations, which include organizations and individuals that aim at solving social problems. Data is collected using an online survey, and three different ways to measure organizational size are used and tested whether they have a positive relation-ship with the use of social impact measurement. Organizational size is measured as the yearly turnover, available personnel and the number of members and participants in the organization. The association was analyzed through three different analytical methods, and we also present detailed descriptive statis-tics for the data sample. The results showed significant relationships between available staff as well as members and participants and the use of social impact measurements, while no significant relationship between the yearly turnover and the use of social impact measurements could be confirmed. We suggest a consideration of impact measurements when addressing sustainable organizational development as well as consideration of organizational size for local governments when introducing policies, funding and other support for socially entrepreneurial organizations.
Keywords: organizational size, social impact measurement, socially entrepreneurial organizations, per-formance measurements, evaluation
Table of Content
1. Introduction ... 1
1.1. Initiatives to address social needs ... 1
1.2. Performance evaluation and impact measurement ... 1
1.3. Socially entrepreneurial organizations ... 2
1.4. The matter of size when measuring impact ... 3
1.5. Problem formulation ... 3
1.6. Purpose ... 4
2. Methodology ... 5
2.1. Positivist approach and inference ... 5
2.2. Role of theory ... 5
2.3. Research design ... 6
2.4. Quantitative research approach ... 6
3. Theoretical Framework ... 7
3.1. Organizational evaluation ... 7
3.1.1. Business sector ... 7
3.1.2. Public sector ... 8
3.1.3. Civil sector ... 8
3.1.4. Socially entrepreneurial organizations ... 8
3.2. Organizational size ... 9 3.3. Conceptual framework ... 10 4. Methods ... 11 4.1. Survey creation ... 11 4.2. Data collection ... 13 4.3. Data sample ... 14 4.4. Statistical analysis ... 15 4.4.1. Model I ... 16 4.4.2. Model II ... 16 4.4.3. Model III ... 18
4.5. Ethical considerations and quality of research ... 19
4.5.1. Ethical considerations ... 19
4.5.2. Quality of the research ... 19
4.5.2.2. Limitations ... 20
5. Results ... 22
5.1. Descriptive results ... 22
5.2. Statistical results ... 26
5.2.1. Model I ... 26
5.2.2. Model II and III ... 27
5.3. Summarized results ... 28
6. Discussion ... 30
6.1. The decision to assess social impact ... 30
6.2. Sustainable organizational development ... 32
7. Conclusion ... 33
7.1. Relationship between organizational size and social impact measurements ... 33
7.2. Future research and practical implications ... 33
Reference List ... i
Table of Tables
Table 1: Independent variables. ... 9
Table 2: Descriptive data ... 15
Table 3: Correlation ... 17
Table 4: Main challenges ... 25
Table 5: Main opportunities ... 25
Table 6: Results Model I HB ... 26
Table 7: Results Model I HC ... 27
Table 8: Results Model I HA ... 27
Table 9: Results Model II and III. ... 28
Table of Figures
Figure 1: Sectors represented in our data sample. ... 22Figure 2: Organizational age. ... 23
Figure 3: Initial funding. ... 23
Figure 4: Methods for performance evaluation ... 24
1
1. Introduction
In the first chapter we give a short introduction to the topic of this thesis. Using relevant literature we discuss the current situation. We explain the used terminology and finally formulate the purpose of this study.
1.1. Initiatives to address social needs
New types of social challenges are continuously increasing in our fast developing society, and differ largely on their context, including the region, culture and its effect on the society (Nicholls, 2008). The failure to provide social and environmental services to address urgent needs leads to a raising number of new types of organizations and collaborative initiatives (Alvord, Brown & Letts, 2004; Fayolle & Matlay, 2010; Nicholls, 2008; Short, Moss & Lumpkin, 2009). The interest and scope of such organi-zations has increased significantly in recent years due to a perceived failure of the dominant corporate, liberal models governing consumption and welfare services today (Phillips, Lee, Ghobadian, O’Regan & James, 2015). With the added strain from a global, economic recession and increased pressure on public spending, the need for new, innovative solutions to solve social problems has grown stronger (Phillips et al., 2015; Short et al., 2009). This has resulted in a move by private organizations away from the more common CSR policies towards the development of corporate social innovation as a potential answer to pressing local and global needs, such as poverty, environmental destruction and social exclu-sion (Phillips et al., 2015). Due to what Alvord and colleagues (2004) describe as social market failures, these organizations and individuals identify opportunities to provide social goods and services to a need-ing community, and must balance the economical and social values in order to prevent a deficit on either one of the sides. This phenomenon has been described in the literature as the Window of Opportunity (Kingdon, 2003; Werther & Chandler, 2010). Social value and its creation are phenomena that have increasingly drawn attention from individuals and institutions at the local, national and global level to tackle social issues (Wilson, Silva & Ricardson, 2015). These actors are increasingly interested in in-vesting in solutions for societal issues, such as improving social, environmental and socio-economic conditions of the society that can provide social as well as financial return for both the investors and the community (Wilson et al., 2015). However, while the interest in social investment is increasing and becoming a focus in the private and public sectors, consequently the question is arising on how to assess and measure the impact on society of such activities.
1.2. Performance evaluation and impact measurement
Evaluating organizational performance and thereby measuring the results is essential for all organiza-tions that seek to improve and develop (Baron, 2011). It is important to have specific and measurable performance goals in an organization to be able to evaluate its performance (Caproni, 2011). The value of an accurate assessment of organizational performance can enhance internal governance, strategic planning and efficient resource allocation, which in turn are drivers for innovation and organizational effectiveness (Paton, 2003). Some researchers argue, based on organizational theories, that the organi-zational effectiveness and legitimacy are a construct within bounded rationality rather than objective reality (Meyer & Scott, 1992; Nicholls, 2008; Zammuto, 1984). Nicholls (2008) adds that “...legitimacy judgments represent organizational performance constructed via stakeholder voice…” (Nicholls, 2008:47). To improve innovativeness and effectiveness of an organization, it is therefore vital to address the right stakeholders and take their views into consideration (Werther & Chandler, 2010). A multi stakeholder perspective, as presented in Werther and Chandler (2010), includes organizational (internal to the organization), economical, and societal (external) stakeholders in the context of globalization and
2 technology which enables an organization not only to identify all important stakeholders, but also to prioritize their respective needs and expectations. However, measuring performance is not the same as measuring impact; assessing social impact also means measuring what the organization accomplishes outside of their own organizational boundaries, and is in this way more challenging to quantify by meas-urements. Exploring ways to measure impact is not a new focus, but one that is becoming more of a concern as organizations look for new ways to improve their activities and demonstrate this impact to others, for example through CSR-work (Werther & Chandler, 2010). In part, this requires a shift in thinking from measuring merely outputs to additionally measuring outcomes, and the challenge is to find ways to measure elements related to social issues and not only the economic results. In addition, there is an interest from outside of organizations, a pressure from philanthropic funds and public service commissioners, to find ways of making their decisions on how resources are or should be allocated (Short et al., 2009). When moving from measuring organizational performance to measuring social im-pact, stakeholder consideration becomes increasingly important to provide guidance for internal stake-holders, managers, employees and shareholders (Kernot & McNeil, 2011). At the same time the impact can be presented to economical stakeholders, such as customers, beneficiaries, suppliers and competitors, on one hand for marketing purposes and on the other hand as inspiration (Kernot & McNeil, 2011). Societal stakeholders, such as governments, communities and other actors that might influence or be influenced by the organization, are important in the sense that they provide ground for any action the organization takes (Werther & Chandler, 2010). Providing tangible evidence that organizational activi-ties have a social impact on society can be highly influential in terms of regulation settings, movements and social change. Further, social impact metrics are no longer managed independently by the organi-zations themselves, but defined and constructed together with relevant stakeholders (Costa & Pesci, 2016). This way the organization can show if it has reached the set goals and fulfilled its responsibilities towards clients and beneficiaries both in terms of results and impact.
1.3. Socially entrepreneurial organizations
Carroll’s (1991) pyramid of corporate social responsibility distinguishes between different kinds of or-ganizations’ responsibilities towards the society. As a basis the economic responsibility towards owners and investors is followed by the legal responsibility to follow regulations and laws of the environment, and finally the ethical and the discretionary responsibilities to enhance the social standard of the com-munity the organization operates in (Carroll, 1991). Werther and Chandler (2010) challenge this view by saying that the two later responsibilities of Carroll’s model are becoming a growing necessity for businesses today because of the fast changing environment and mindset (Werther & Chandler, 2010). The ethical and discretionary behavior can build the fundament for the economical and legal responsi-bilities and thus the success of the business (Werther & Chandler, 2010). Some organizations take this approach further to the core meaning of their existence and incorporate the ethical and discretionary responsibilities into their mission. In the literature, these are often described as socially entrepreneurial organizations (SEOs), including social entrepreneurs, social enterprises, and social businesses (Elking-ton, 2001; Emerson, 2003; Kaplan, 2002; Nicholls, 2008; Wilson et al., 2015; Zadek, 1998). These actors are described as organizations or individuals that operate at the intersection between innovation, market-change and sociality (Nicholls, 2008). In Sweden, none of these have any specific legal form yet (Alamaa, 2014: Defourny & Nyssens, 2008). Social entrepreneurship has previously been conceptual-ized in three different approaches. The first approach centers on social demands of vulnerable groups that are currently unmet (varies to a large extent based on the societal challenge addressed - hunger, poverty, human rights, etc.); the second approach is broader and targets challenges of society as a whole; and the third approach is concerned about systemic reforms of societal transformation (Short et al., 2009). Any final, valid definition for SEOs does not seem to exist. In this thesis we use the term socially entre-preneurial organizations to refer to social entrepreneurs, social enterprises and social businesses alike. We do not make the distinction between different types of organizations as they all have similar features, such as to do good for society, create public value, come about social or community change or develop sustainable community benefit. Meanwhile, they are business-like in operations but without primarily financial motives. They are aiming towards solving social problems or provide social services on the local, national or global level while taking any legal form or size (Fayolle & Matlay, 2010).
3
1.4. The matter of size when measuring impact
Like all other organizations, SEOs vary largely in organizational size, and while some assess social impact, others do not. A risk if only large organizations assess impact can be the complete loss of knowledge and innovation from smaller organizations. Evaluations in general can be regarded as a form of knowledge production, and therefore objective evaluations, both in terms of performance and impact, are one component of broader knowledge strategy and organizational learning (Nielsen, Lemire & Skov, 2011). This means that if no measuring of impact is done, no knowledge will be created regarding the ways to come about social change. This in turn can limit social innovation and creativity, also limiting social solutions to the existing ones. A related risk is decreased possibilities for funding opportunities without any evaluation or impact assessment (Kernot & McNeil, 2011). Potential funders and investors must choose among a large set of organizations which they have imperfect information about, and by measuring impact the organizations themselves can demonstrate to funders how valuable their work is and simultaneously compare their performance to others (Lecy, 2010). If organizations can show a social impact, funders and investors could then more easily invest into the most effective organizations and thereby disseminate a powerful incentive for adopting best practices (Lecy, 2010). Likewise, smaller organizations without possibilities to demonstrate an impact miss out on funding opportunities both from the public and private sector, potentially risking the whole organization’s existence. Further, the goal of evaluations in general is to continuously create and sustain an overall organizational process that from knowledge can create quality. Internal and external evaluations are required to make such a goal reality regardless of whether it is evaluating performance or impact, and thus measuring in general has become a valuable commodity for organizations in modern society (Baron, 2011). If no evaluation is done, there will be limited possibilities for development in that organizational field, and the organization will remain small without potential to grow. The literature shows that large organizations have a distinct advantage when it comes to evaluation of both results and impact due to extensive, available resources and opportunities for funding from numerous sources (Baron, 2011; Gallo & Christensen, 2011; Stanwick & Stanwick, 1998). Meanwhile, smaller organizations oftentimes may not have the resources or political influence to justify an evaluation staff or activity (Baron, 2011). No matter what the size of the organization, evaluations can be a productive activity that reaches beyond the political, economic, or social barriers to propel organizations to improve quality, efficiency, and effectiveness (Baron, 2011), making it maybe even more important for small organizations, and SEOs particularly, to assess and measure their social impact to gain the legitimacy and financial stability they need. As a final implication, if only large organizations measure impact, their assessment methods can become dominating in the field. Over time, it can create bias in the measurements as only bigger organizations use them and the tools become even more subjective rather than the opposite. This way, rigorous impact studies that val-idate large organizations’ activities become influential as they can generate field consensus and inform policy makers about a sector in the long run (Baron, 2011). If only larger organizations assess impact, it could thus be a problem for the development of reliable social impact measurements (SIM) as they also have to be versatile to fit many different organizations.
1.5. Problem formulation
As stated above, it is essential for SEOs to measure performance and social impact for internal devel-opment (such as guidance and inspiration) as well as external develdevel-opment (including acquiring legiti-macy and attracting investors) (Caproni, 2011; Kernot & McNeil, 2011; Meyer & Scott, 1992; Nicholls, 2008; Paton, 2003; Werther & Chandler, 2010; Wilson et al., 2015; Zammuto, 1984). On the other hand, such assessments are commonly seen as subjective and not representative for organizational activities. In addition, they are often described as resource intensive and time consuming (Baron, 2011; Elkington, 2001; Emerson, 2003; Kernot & McNeil, 2011; Wilson et al., 2015). While it generally seems to be beneficial to measure social impact for organizations of all sizes that aim towards solving social prob-lems or providing social services, some undertake such assessments and some do not. Gallo and Chris-tensen (2011) examine a large number of firms and find out that organizational size is strongly connected
4 to sustainability related activities since such initiatives require resources in form of human and financial capital, and larger firms generally have more of them. Stanwick and Stanwick (1998) provide evidence that organizational size is indeed positively related to corporate social performance due to available resources on one hand and due to increased influence by multiple stakeholders on the other hand. Other studies show that size affects the leadership behavior needed for management innovation (Vaccaro, Jan-sen, Van den Bosch & Volberda, 2012). Most attention on organizational size has been drawn from the business sector; however it has also been shown that organizational size is an important predictor for innovations in nonprofit organizations (Jaskyte, 2013). Since organizational size seems to be an im-portant factor for decision-making, evaluation and resource allocation (Baron, 2011; Tolbert & Hall, 2011), it is relevant to investigate if there is any relationship between the size of an organization and the use of social impact measurement.
1.6. Purpose
The purpose of this thesis is to explain how the use of social impact measurements in socially entrepre-neurial organizations relates to organizational size.
5
2. Methodology
In this chapter we give a brief overview of our philosophy of science and state the warrant inference. Afterwards we shortly present the scope of our empirical research including the chosen research design, role of theory and the overall research approach.
2.1. Positivist approach and inference
Positivism has a broad interpretation in contemporary social sciences as it embraces any approach which applies scientific methods to a social and human phenomena conceived as belonging to some natural order (Hollis, 1994). In recent philosophy of science, positivism means that the theoretical knowledge can simply be reduced to an empirical observation so that one can predict what will be found in further observations (6 & Bellamy, 2012; Hollis, 1994). Based on a positivist ontological and epistemological assumption as defined by 6 and Bellamy (2012), we review collected empirical data and attempt at generalizing our inference as far as possible to broader context, as we believe that knowledge is trans-ferable and comes from experiences independent of the learner. At the same time, we are aware that generalization across a field with little consensus and few clear definitions is difficult and hence risks the external validity of the study. However, it has previously been argued that the very nature of progress in academic research speaks against attempting at maximizing the external validity at any cost in the context of a single study (Calder, Phillips & Tybout, 1982). Thus, as any researcher, we desire to add knowledge regarding how the world works, and the reality we are investigating refers to whatever oc-currence in universe that causes a certain phenomena (Hollis, 1994). If the strategy for doing this is sound, it can offer an explanation with enough probability to predict future happenings (Hollis, 1994). To avoid any biased generalization, we base our study on previous, peer-reviewed research, and test our explanatory inference on empirical data. The first chapter shows that some SEOs conduct such assess-ments and some do not, and based on the fact that organizational size is a decisive factor for decision making, we infer that the use of SIMs depends on organizational size.
2.2. Role of theory
In this thesis, we use a deductive approach to address our purpose. In accordance with our philosophy of science, a rather positivistic epistemology, we gather and organize knowledge that exists externally through quantitative collection of data and analytic methods. A deductive approach is therefore a com-mon choice for positivists (6 & Bellamy, 2012). Conducting deductive research always holds a precise statement of expected findings based on what we know, or suspect to know (6 & Bellamy, 2012). It begins with stating a hypothesis. This hypothesis may stem from previous body of evidence, but it is not a criteria for deductive research (6 & Bellamy, 2012; Blaikie, 2003). In our case, we start with a practical observation and a potential explanation for why it occurs. We then proceed to deducing three hypotheses and testing whether our claim seems plausible by using appropriate, empirical data (Blaikie, 2003). Confirmation of the hypotheses can lead to conclusions regarding a certain phenomena, generalizations across units, settings and times, and the rejection of other, possible explanations than the one remaining at the end of the research (6 & Bellamy, 2012; Calder et al., 1982).
6
2.3. Research design
For our research we use a variable-oriented research design (VOR) for analyzing the relationship be-tween variables chosen from a large number of observations (6 & Bellamy, 2012). Since we aim to carefully generalize our findings to a larger population of SEOs in Sweden, based on the findings from the sample, it is an appropriate design for our purpose. It is however always important to consider the sample of the population as it will be a major determinant for the quality of the study (Brown, 2006). We return to the sample issue in Chapter 4. The analysis of variable-oriented research is generally done statistically and determines the relationship of outcomes, or dependent variables, to particular factors that we believe are causing these, the explanatory (independent) variables (6 & Bellamy, 2012). VOR in general is often used to test such relationships, for example whether changes in one variable are systematically linked to changes in another. If such a relationship can be proven, theories and models can be verified, rejected or refined (6 & Bellamy, 2012). VOR is used in social sciences because it makes it possible to broaden the conclusions about social life and test general applications of theories (6 & Bellamy, 2012).
2.4. Quantitative research approach
There is a general distinction between qualitative and quantitative research; while the first one rather uses words, the later provides numerical proof (Blaikie, 2003). A common belief is that numbers are needed to ensure objectivity and provide reliability, but in fact quantitative data often starts with words which are later transformed into numbers. The data then goes through statistical manipulation, and is presented either in words, numbers, or both (Blaikie, 2003). For our research we choose a quantitative research approach, and we collect and analyze primary data using quantitative methods because it best suits our purpose of investigating a relationship between two different factors and it is in line with our methodological assumptions. The main purpose of this paper is to carefully try to explain how organi-zational size of SEOs in Sweden relates to the use of social impact measurements. For stronger repre-sentation of the target population, various organizations that differ in size, structure, development stage and sector are represented. By using a deductive and quantitative research approach, we create a frame-work anchored in current, academic literature when constructing the survey instrument, then collect, code and quantitatively analyze the empirical data. Based on our positivist methodological assumption, we then present the findings, discuss and interpret results.
7
3. Theoretical Framework
In this chapter we present our theoretical background in which we anchor this study. First, we provide an overview of organizational evaluation and the performance measurements used in different sectors. Then, we review the literature on organizational size and present the emerged dependent and explana-tory variables of this study. We finally combine the two concepts in the third part of the chapter in a conceptual framework and state the hypotheses.
3.1. Organizational evaluation
To be able to evaluate if, or measure to what extent, organizations meet their performance and impact goals they first need to set their objectives. Defining goals can often be problematic since organizations have multiple goals that frequently contradict each other (Tolbert & Hall, 2011). This often results in organizations formulating official goals in a rather broad and abstract way to state the general purpose of the organization in annual reports and other publications. If the goals are abstract and broad, the assessment on how and when they are achieved becomes more complex. In addition, organizations also formulate operational goals internally to state what they are actually trying to achieve in a more detailed way (Perrow, 1961). Tolbert and Hall (2011) present three different approaches organizations use for performance orientation. The system-resource approach says that the main goal of an organization is to survive by acquiring and managing scarce resources; participant-satisfaction approach describes the orientation to attract contributions of members that are necessary for the organizational existence; and finally the stakeholder approach implies that to assess effectivity, the organization needs a referent (Tolbert & Hall, 2011). Either way, all kinds of organizations aim to evaluate their effectivity and per-formance, but the approaches can differ from organization to organization, from industry to industry and from sector to sector. In the following, we present how different sectors evaluate and measure their performance and what tools are commonly used for this.
3.1.1. Business sector
Evaluating performance is commonly done through the use of performance measurements, which is the assessment of an action that has been caused intentionally (Cordery & Sinclair, 2013; Payer-Langthaler & Hiebl, 2013). Originated from the business sector, performance measurements firstly concentrate on creating value for stakeholders, primarily for the organization’s owners or shareholders (Munir, Baird & Perera, 2013). In businesses, a traditional accounting system is preferred, such as the well-known bottom line (Kellen & Wolf, 2003). Behn (2003) argues that there are eight main purposes for the use of performance measurements, namely to evaluate, motivate, promote, budget, control, celebrate, learn and improve. Especially strategic management divisions use business performance measurements in order to evaluate and improve organizational performance (Venkatraman & Ramanujam, 1986). Busi-ness performance can be seen as a subset of the overall concept of organizational effectiveBusi-ness. BusiBusi-ness performance is dualistic, one part is the financial domain, hence how well the organization fulfills its economic goals, including return on equity and return on investment, as well as improved market value (Venkatraman & Ramanujam, 1986). The other part of business performance is indeed non-financial, the operational performance. This includes, among others, measuring the market-share, product quality and new product introductions, as well as technological efficiency (Venkatraman & Ramanujam, 1986). Strategic management objectives differ depending on the purpose of the managerial activity and there-fore, performance measurements should be adjusted to the respective purpose of the action rather than a one-size-fits-all approach (Behn, 2003). The probably most common attempt at balancing the financial
8 and operational performance is the framework of balanced scorecard, which provides businesses with a set of broader measurements (Kaplan & Norton, 1996).
3.1.2. Public sector
In contrast, programs designed by governmental institutions often aim at various objectives with pro-duced outcomes that compete in terms of created value, but at the same time there is a problem with existing evaluations only capturing one dimension of governmental performance (Oh & Bush, 2015). It has not yet been fully successful to apply the complexity of such measurements to the public sector (Ammons & Rivenbark, 2008). It is suggested that a universal approach is not realistic for the public sector, but rather a more representative evaluation can be achieved when the wide variety of performance measurements and contexts are considered (Costa & Pesci, 2016; Oh & Bush, 2015). The authors argue that existing performance measurements only partially cover the outcomes of governmental programs, and suggest that different aspects of performance measurement should exist within one of the three dimensions - value, orientation and data. These dimensions constitute the context, and therefore a rep-resentative performance measurement must be continuously considered from multiple perspectives, and adjusted according to specific settings (Oh & Bush, 2015). What is missing in the public sector perfor-mance measurements might in fact be an evaluation of the social impact achieved through different policies and practices that could encompass the outcomes of governmental programs that are not fully covered today.
3.1.3. Civil sector
In the civil sector, where SEOs are often placed, the ownership relation from the business sector does not exist and monetary value cannot or should not be distributed within the organization (Cordery & Sinclair, 2013). Huang and Hooper (2011) argue that the main reason for the civil sector to evaluate performance is to present their worthiness and effectiveness to potential or existing funders and benefi-ciaries, as well as to allocate resources and learn from feedback and comparisons to similar organizations. The accounting measures that are common for businesses are not the primary focus in the civil sector; funders rather want to see how well the organization delivers social goods and services, and if it gener-ally learns from previous evaluations (Huang & Hooper, 2011). The balanced scorecard framework has been developed and adjusted for non-profits (and SEOs) and is one of the used SIM in the civil sector (Kaplan, 2002). The framework is considered to have advantages mostly for internal processes and mis-sion guiding, but is rather limited and still not fit for comparisons (Nicholls, 2008).
3.1.4. Socially entrepreneurial organizations
Non-profit organizations have traditionally had an inherent interest in fostering social change to achieve societal improvements (Short et al., 2009). That’s why the civil sector is often called the third sector, and similarly why SEOs often have their rooting within the civil sector (Milbourne, 2009). However, many of them often come to face a tension between their social aims and demands of making financial profits to be able to keep providing some social good (Battilana, Sengul, Pache & Model, 2015; Battilana & Lee, 2014). As defined in the introduction part, we consider SEOs as organizations or individuals that tend to be business-like in operations, but without primarily financial motives. Although they are par-tially dependent on funding and external investments, they seek economic independence without com-promising their social purpose (Fayolle & Matlay, 2010). At the same time, they provide products and services that governments fail to arrange, and often SEOs are in focus of policy makers who are trying to increase the quality of welfare while reducing the public expenditures (Cordery & Sinclair, 2013). We therefore place SEOs somewhere in between the three sectors, which results in complex perfor-mance measurements as a combination of all three. Another dimension specific for SEOs as the provider of social goods and services as suggested by current literature generally requires accountability (Bagnoli & Megali, 2011; Nicholls, 2008; Paton, 2003; Zadek, 1998). The issue of accountability concerns the relationship between the SEO and its beneficiaries and funders in form of trust and legitimacy, which can be built upon provision of transparent evidence-based results (Bagnoli & Megali, 2011). Perfor-mance measurements therefore become instrumental for SEO managements in terms of accountability
9 and as the performance of SEOs oftentimes is expected to be a social impact, SEOs performance eval-uations can be understood as the use of various social impact measurements. The use of such measure-ments to assess SEOs organizational performance becomes the dependent variable of our research.
3.2. Organizational size
Organizations are generally difficult to define, but common definitions include four main elements: size, particular goals to achieve, different roles, and an authority system (Tolbert & Hall, 2011). A great variety within each of these categories exists. The formal organizational structure has three dimensions that are still valid today: arrangements of organizational units, level of rules and standardized procedures as well as the level of autonomy in decision-making (Tolbert & Hall, 2011). In the closed-system ap-proach as presented by Tolbert and Hall (2011), organizational size is next to technology and organiza-tional culture, one of the key elements that shape the formal structure of organizations (Tolbert & Hall, 2011). Within these dimensions, size is the decisive factor which with ascent has great influence on organizational formal structure and internal processes. For example the bigger the organization, the more complex it becomes and therefore the need for more formalization arises; complexity thereon leads to decentralization of decision making due to increased control and coordination difficulties which again leads to increased formalization (Blau & Schoenherr, 1971). The question about what is the actual size of an organization then arises. Organizational size can be represented in at least four different concepts: 1) capacity, such as number of beds in a hospital or classrooms in schools; 2) staff available for the organization (this is the most common way to define size); 3) inputs, such as number of clients served, and outputs, for example sales volume; 4) discretionary resources, for businesses it is the amount avail-able for investment (Kimberley, 1976). All four ways to define size has some disadvantages of only partially representing the size of an organization. For the first definition it is not given that the capacity is fully used, and therefore the numbers can be misleading. For the second approach, it needs to be clarified if part-time, temporary or volunteered personnel are included or not. The third and fourth def-initions limit comparison to similar organizations and exclude some types. Evaluations highly depend on what measurements are used; different definitions deliver different results (Kimberley, 1976). In our study we base our independent variables on this idea, and operationalize according to the following: discretionary resources as the organization’s yearly turnover; staff as number of part- and full-time em-ployees and volunteers, and inputs as number of members and participants in the organization. We do not include the capacity aspect because it is not relevant for this context since the range of goods and services provided is too wide to measure in this way and does not provide good ground for further analysis. These three size-measurements become the explanatory (independent) variables for our re-search.
Table 1: Independent variables. Suggestions from previous research on how to measure size with exam-ples, and the operationalization and variable names for this study (based on Kimberley, 1976).
Type Example Operationalization Variable Discretionary
resources Resources available to the organization in form of wealth and net assets
Yearly turnover size_turnover
Personnel Staff available to the
organi-zation Full-time employees Part-time employees Volunteers
size_staff
Inputs Number of clients served or
10
3.3. Conceptual framework
As presented above all types of organizations evaluate and measure their performance in one way or another (Huang & Hooper, 2011; Munir, Baird & Perera, 2013; Oh & Bush, 2015; Tolbert & Hall, 2011). Depending on the sector and set goals, the organizations decide what they want to achieve and how it shall be done. For SEOs it is often done by measuring social impact in the community where they operate. The use of SIM is a way for SEOs to balance the performance measurements from all three sectors while adding a layer of legitimacy (Bagnoli & Megali, 2011; Nicholls, 2008; Paton, 2003; Zadek, 1998). There are various approaches on how to measure social impact developed in different areas of the world: Measuring Effectiveness from the UK (Leviner, 2006), PHINEO from Germany (Epkenhans, 2012), SIMPLE also from the UK (McLoughlin, Kaminski, Sodagar, Khan, Harris, Arnaudo & McBrearty, 2009) and many others (Elkington, 2001; Emerson, 2003; Kaplan, 2002; Nicholls, 2008; Zadek, 1998). Assessing social impact is difficult and the measurements need to be chosen with caution (Nicholls, 2008). However, some SEOs do undertake such assessments. Based on organizational theories that em-phasize the importance of organizational size to have great effect on the formal structure as well as on the internal processes, we assume that the decision to use SIM to assess performance partially depends on the size of the organization. Many other factors can also influence the decision of using or not using SIM, one example could be whether the SEO receives public funding or not, since organizations or activities receiving governmental support need to provide evidence of their success to collect further funds (Huang & Hooper, 2011). Another factor can be the main field in which the SEO operates, for example initiatives that target a bigger part of the community and are expected to have an impact on society, such as organizations working in healthcare or labor integration. In contrast to SEOs that work mainly with animals, these organizations are maybe more likely to evaluate the social impact in order to legitimize their activities. In our research we will concentrate mainly on the size of the organization since there has been much research done on organizational size affecting the occurrence of activities related to evaluation, sustainability, corporate social performance and leadership (Gallo & Christensen, 2011; Jaskyte, 2013; Stanwick & Stanwick, 1998; Vaccaro et al., 2012). Therefore we hypothesize that organizational size is related to initiatives to measure social impact in SEO. Above we specify our in-dependent and in-dependent variables and based on the presented assumption we formulate the following claim: the use social impact measurements increases with size of socially entrepreneurial organizations. From this we derive three different hypotheses based on Table 1:
HA: The use of social impact measurements relates positively to yearly turnover in socially
entrepreneurial organizations.
HB: The use of social impact measurements relates positively to number of available staff
in socially entrepreneurial organizations.
HC: The use of social impact measurements relates positively to number of members and
11
4. Methods
In the following chapter we detail how the survey for data collection was created and the rationale behind the asked questions. We then provide an overview on how we distributed the survey to collect relevant data, present the sample and describe our methods for the analysis. We finally argue for our ethical considerations, and the strengths and the limitations of this conducted research.
4.1. Survey creation
As suggested by Ejlertsson (2005), we began our data collection process with a thorough literature re-view (see Chapter 3) to identify the right terminology and existing problems in the field, but also to limit the scope of the study and keep it focused. Survey studies are suitable methods for research in many fields and levels, but to develop a quality instrument is more challenging than many novice researchers realize at first. Poorly designed surveys will produce unsatisfactory data that cannot answer the desired question (Passmore, Dobbie, Parchman & Tysinger, 2002). A good way to ensure the quality is to use existing questionnaires, as they have already been assessed for validity and reliability (Ejlertsson, 2005; Kitchenham & Pfleeger, 2002). Unfortunately, this was not possible in our case as we are doing research with an ambition to investigate the connection between organizational size and the use of SIMs which has to our knowledge not been done before. Despite the explorative topical component, the survey is constructed to describe and explain this association. The next task was to determine what language to use in the survey, and whether we should provide it in both English and Swedish in order to maximize the number of potential respondents. After careful considerations we chose to only formulate the ques-tions in English; a detailed discussion of the advantages and disadvantages of this decision is provided in section 4.5.2. Quality of the research.
A survey asks the respondents to answer questions, so the starting point in designing a survey instrument should always be the survey's purpose and objectives. When writing this piece of information we con-sidered components as suggested by previous research (Ejlertsson, 2005). The survey description needs to be brief but at the same time define the context of the survey, tell the respondents who is eligible to fill it in, what areas to cover, and what types of information we are looking for (Kitchenham & Pfleeger, 2002). It is particularly important to keep it short and concise. However, we expected our target popu-lation to have some prior knowledge of the areas, as they are in fact social entrepreneurs or working in socially entrepreneurial organizations, which allowed us to use a somewhat academic language. As a researcher you should however not assume that the respondents know the terminology you use, which is why we started the description by very briefly defining the terms socially entrepreneurial organiza-tions and social impact measurements. This is to ensure that we have the same understanding of some basic concepts in order to minimize the risk of misinterpretation and internal loss of data (Kitchenham & Pfleeger, 2002).
As explained in Chapter 3, our dependent variable is the current use of SIM in SEOs. This variable is a self-reported, categorical question of whether the corresponding organization uses such measurements or not, giving the options of ‘No, never’, ‘Yes, once or twice’, ‘Yes, regularly’ or ‘I don’t know’. We also added a question about how the organizations evaluate their performance today to explore what kind of measurements are commonly used in SEOs in Sweden, if any at all. For our explanatory variables, we claim that organizational size has a positive association with the dependent variable. As stated above, organizational size is measured as 1) the yearly turnover; 2) the number of employees and volunteers, and 3) the number of members and participants within the organization. When formulating these ques-tions for our survey instrument, we considered both opques-tions of open or closed quesques-tions. An open
re-12 sponse format allows subjects to answer a question by typing their own response in text and, conse-quently, a question is closed when a respondent is asked to select an answer from a list of predefined alternatives (Kitchenham & Pfleeger, 2002; Passmore et al., 2002). By restricting the respondents' re-sponse options, closed questions are easier to analyze and are often preferred in surveys to ease the statistical analysis. However, if deciding to use a closed question option, we may need to include a ‘None of the above’ or ‘I don't know’ answer when asking categorical questions (Kitchenham & Pflee-ger, 2002; Passmore et al., 2002). In addition, the type of questions we needed to ask would be chal-lenging to create categories from, for example what is a suitable interval for a category asking for the organization’s yearly turnover? To avoid this issue and allow for more individual responses, we chose open questions for our explanatory variables. On the other hand, we chose a closed question design for the dependent variable; it is not asking the respondent to provide a number, but a report of some previous happening, and keeping it open would leave room for misinterpretation. A further decision when using closed categorical questions is whether the respondent can choose one or more responses to the question (Kitchenham & Pfleeger, 2002). Since we want the respondents to provide only one answer, we ensured that the categories are mutually exclusive (limited by the technical options provided by the survey plat-form). Answering open questions requires more time and effort from subjects than checking responses on a list and thus, the response rate may be lower and the data less complete than that obtained using a closed format (Passmore et al., 2002). But in our favor, the open questions were only asking about numbers therefore not too daunting or time consuming. Similarly, questions must be formulated in a way that respondents can answer them easily and accurately. It is also important to make sure that re-spondents have sufficient knowledge to answer the questions (Kitchenham & Pfleeger, 2002). In this case, the asked questions are on behalf of the organization the respondent represent, and the responses should be fairly easy to look up in case the respondent does not know the answer already.
Additionally to our dependent and explanatory variables we included a series of other questions. For example two questions to describe the context of the SEO, such as the area it operates in (e.g. education, environment, unemployment) which was a compulsory question allowing only one answer, and who are the main beneficiaries (e.g. unemployed, refugees, children) which was not compulsory and with the option of giving multiple answers. This allowed us to better understand our data sample and provide evidence that our results will represent not only organizations with similar mission and beneficiaries, but a very broad set of organizations.
Furthermore, it was important to keep in mind that the number of questions you can realistically ask in a survey depends on the amount of time respondents are willing to commit to it. In a self-administered questionnaire like ours it is possible to ask more questions, but we still needed to be sure that it is not considered too daunting. If it is, we risked getting answers that are inaccurate or incomplete (Kitchen-ham & Pfleeger, 2002). One way to reduce the time taken to complete a survey is to have standardized response formats, for example standardized to an ordinal scale (Kitchenham & Pfleeger, 2002). Apart from the dependent, independent and descriptive variables, we also wanted to describe what seems to be the major reason for assessing or not assessing social impact in Swedish SEOs. We asked one ques-tion respectively about the main challenges and opportunities of performing such assessments. These were formulated with a series of options that arose from reviewing current literature (Kernot & McNeil, 2011; Wilson et al., 2015), with an extra category of ‘Other’ for the respondents to specify if they did not feel their view was already represented as an option. For these questions we used a five-point Likert scale for frequency ratings of different alternatives importance ranging from 1 to 5, where 1 is ‘not at all important’ and 5 is ‘very important’ (Blaikie, 2003; Ejlertsson, 2005). A traditional Likert scale with this structure is commonly used in surveys, thus the format is familiar to respondents and it lends itself well to measuring constructs like attitudes and values like we did in this case. The number of scale points can vary; we chose five which is usually sufficient.
Some questions in our constructed survey were compulsory while others were not. The rationale behind each compulsory question is that it will give data that is important or even necessary for our research. The non-compulsory questions are rather interesting aspects that we could include or use in other ways that relates to our research, but that was not crucial for the results. In the end, we used a total number of 13 questions. We did not include a question about geographical location of SEOs mainly because we
13 wanted to limit the amount of items. We furthermore decided to view Sweden as a whole and would not have any relevant way to relate geographical data to our study since it is not a part of our hypotheses. Likewise, we believe it would be too broad to be able to interpret it in a meaningful way. After submit-ting the complete survey, respondents came to a page that thanked them for their participation and con-tribution to our study, and the option of registering for a copy of the study upon completion.
In the construction of this survey we have attempted to make the questions as clear as possible. Further, we refrained from using a large number of questions as long instruments tire respondents and can lower response rates (Passmore et al., 2002). After the first construction we performed a minor pilot study (Ejlertsson, 2005) where a few, people that were external to the study but easily available to us were asked to fill in the survey. After this, we studied the results and assessed how well the questions worked and if they were interpreted as we had intended. According to common practice we made some minor changes to the survey after the pilot study in order for it to be more functional and intuitive. These changes mainly concerned formulation matters in either the question descriptions or survey description, such as what the response is expected to contain or how we defined SEOs or SIMs. After these last edits, we were ready to launch. The complete questionnaire can be found in Appendix 1. The survey was done using Google Forms.
4.2. Data collection
Using common research methods like interviews or telephone surveys is often both an expensive and difficult task. The internet offers unprecedented research opportunities to overcome such barriers (Tijdens, De Ruijter & De Rujiter, 2012). In this section, we discuss how we used the internet in this study, and how it can be used to meet the challenges of large-scale, continuous data collection from a great geographical base. Since the beginning of a more widespread internet access among the public the world has experienced a drastic expansion in number of web users, online services and applications, and every day millions of people use the internet to gather information, entertainment or to converse in online communities and social networks (Tijdens et al., 2012). The internet can reach extremely large populations, as well as very rare populations, and it can provide data collection methods beyond tradi-tional surveys (Tijdens et al., 2012). A challenge however, is to recruit a sufficient number of web users with the right interest in these targeted organizations. One option is to identify websites or online com-munities aimed at specific topical issues, and ask them to either participate or help distribute the survey by linking it on their website (Tijdens et al., 2012). Our distribution followed this pattern, and was done using internet by a form of distribution by interest method. It implies a method where a survey is dis-tributed over different communication channels connected to a certain interest, for example when visit-ing a certain website or buyvisit-ing a particular magazine (Ejlertsson, 2005). In our case, we did this over Facebook (social media) and email. We approached different groups and organizations involved in so-cial entrepreneurship and similar organizations and initiatives where actors can post messages and share a link to our survey. In some groups we could post this message ourselves, but for more formal organi-zational pages we asked for help from administrators to share it so that everyone who has liked their page, out of interest, could see our survey call (Ejlertsson, 2005). However, this only determines who can see the call for the survey, who then also chose to participate is beyond our control, and up to each respective individual. The included descriptive questions helped us then to identify the final sample of respondents.
In addition, we also had the condition that only people who are part of a SEO can participate in our survey. There is no way for us to ensure this is the case, though we constructed the questions in a way that if you were not eligible, you were not able to answer the questions properly. We also have no reason to suspect to that some answers were simulated since the survey was distributed by interest, and not openly shared with all Facebook-users. As mentioned earlier on, there is also some limitations concern-ing the language used as respondents had to be able to understand academic English, and also have access to a computer to be able to respond. Hence, the total population (Ejlertsson, 2005) is SEOs oper-ating in Sweden, and the target population of the survey on the other hand was SEOs in Sweden with access to a computer, and who are able to understand the language in the survey.
14 Since there is no consensus or vast body of evidence within the field, there is so far no real possibility to determine how big the total population of SEOs in Sweden actually is, and consequently how big share of the population our sample represents. In order to generalize findings, the sample must be rep-resentative for the entire population which is commonly achieved through a randomized selection to avoid any upward or downward bias (Ejlertsson, 2005). Randomization is generally the best sampling method but very rarely possible, and unfortunately nor was it in our case. We instead chose the method of self-selection as described above. Previous studies have shown that the quality of data does not differ significantly between web-based and hard-copy surveys, providing support for the feasibility of using a web-survey format (Kiernan, Kiernan, Oyler & Gilles, 2005; McCabe, Boyd, Young, Crawford & Pope, 2005). In general, web surveys have relatively poor response rates, likely because they are in most cases self-selective (Converse, Wolfe, Huang & Oswald, 2008). We were aware of this fact, and in addition to the web survey we approached a large number of SEOs over email (closer to 350 organizations), distributing the survey to a more targeted group than what was possible on the online platform. Contacts details to these 350 organizations were found on a web platform created by Sofisam, which is a collab-oration between three Swedish authorities (the Swedish Agency for Economic and Regional Growth, the Swedish Social Insurance Agency and the Swedish Unemployment Office). The platform contains a large share of all Swedish work-integrating, social enterprises (in Swedish: arbetsintegrerande sociala företag). However, this too is based on voluntary registration and did not enable us to reach any total population. Self-administered surveys distributed by email in this way are not expensive or difficult to use, and provide privacy and anonymity to respondents (Passmore et al., 2002). However, such surveys can typically yield numerous unusable or incomplete responses and may require multiple mailings to obtain a response rate high enough to generalize the data gathered to the whole target population (Pass-more et al., 2002). In our case, the internal loss of data due to such problems were however very low, and to obtain a satisfying response rate we also sent out a reminder email one week after the first email-ing. The survey accepted responses for a duration of two weeks, and even though we received emails from additional respondents after the closing date, we did not allow for any more responses once the survey had closed.
Our survey software (Google Forms) is an online method that instantly imports the data into an Excel sheet and both counts and sorts the responses. Although, we had to recode some of our variables to enable statistical analysis, which is explained in section 4.3 Data sample and 4.4. Statistical analysis.
4.3. Data sample
From the Facebook posts and approximately 350 email requests we had gotten a number of 67 respond-ents when the survey closed down. In order to be able to use our dependent variable as intended, we had to recode it to a dummy variable rather than a categorical as otherwise the number of responses in each category would have been unsatisfactory. A dummy variable means using binary categories or options rather than the four categories initially used as response options for the question: ‘Have you undertaken any assessment of your organization's social impact?’ In addition, we got three different responses in the field for ‘Other’. Thus, we had to organize our data differently to get a binary variable. The ‘Other’ responses were easily sorted into the existing categories (for example ‘once every fiscal year’ were put into the response category ‘Yes, regularly’). We then eliminated the respondents who said ‘I don’t know’ (n=11), as these are irrelevant for our analysis. This number can be considered as internal loss of data. For the remaining (n=56), we coded the data according to this “No, never” became ‘0’ and both ‘Yes, once or twice’ and ‘Yes, regularly’ became ‘1’. Thus, the interpretation of the variable is that if the organization has not undertaken any assessment of their social impact, it is represented by a 0, and if it has ever undertaken any such assessments, the organization is represented by a 1. The total sample from this point is n=56.
For our independent variables we also had to perform some coding prior to conducting the statistical analysis. When respondents gave an answer that ranged from one number to another (such as 40-45), we consistently chose the larger number. There might for example be some vacancies not represented in currently employed staff number or other reasons for why they chose a ranging response. Similarly,
15 if they responded a number with decimals, we always rounded up rather than according to common mathematics. For example, if they had 2.25 employees the number was rounded up to three as there are three individuals working in the organization. As explained in Chapter 3, we consider both full-time and part-time employees in this measurement of size and did not restrict answers merely to full-time, how-ever this adjustment only concerned five observations. The rationale behind both these decisions were mainly to be consistent in our choices, and we decided to choose max value. Further, some organizations indicated both a number of ‘clients’ and another number of ‘members’ for the question ‘How many members and participants do you have in your organization?”. In this case we used only members and disregarded the number of ‘clients’. For the variable of yearly turnover, both a no profit situation and a negative profit (loss) are represented as ‘0’. In cases where respondents stated several annual turnovers we chose the most recent year (2015). As shown in Table 2, some additional internal loss of data was present in the independent variables, and the total number of observations differs slightly between var-iables. A much more detailed descriptive analysis of our data will be provided in the next chapter, section 5.1 Descriptive results.
Table 2: Descriptive data. Descriptive data for statistical analysis, *= dependent variable.
4.4. Statistical analysis
All three hypotheses in this study, HA, HB and HC, are stating a positive relationship. There is a
connec-tion between sample size and the ability to estimate populaconnec-tion parameters, or to be confident about a particular relationship in a subsample. If the set significance level is equaled or below in the analysis, the estimator is said to be significant. That is, the estimated value is expected to be present in the total population from which the sample was drawn. Generally, we can be more confident about results from large samples, and have to be more cautious when small samples are used (Blaikie, 2003). However, the case against the broad use of statistical significance testing has been developed by many opponents (Carver, 1978; Johnson, 1999). The discussion of statistical significance uses the argument that as the world is not perfect, we must allow for some errors in how confident we are of our estimated results. While we may be pretty sure we know what the factors are, we can never be 100% sure - there is always a chance, no matter how small, that we might be wrong (Blaikie, 2003; Carver, 1978). The statistical significance of an estimator is represented by a p-value, and the significance level can be made as small as one wishes. The use of a fixed significance level of say 0.05 promotes the seemingly random distinc-tion between a significant finding if p = 0.049, and a nonsignificant finding if p = 0.051. Thus, if an important finding is statistically non-significant, the researcher will conclude that the sample was insuf-ficient and call for further research, an action criticized by some for being of schizophrenic nature (John-son, 1999). It has even been claimed that all forms of statistical significance testing should be abandoned in favor of other measures such as effect estimates (Carver, 1978; Carver, 1993). In general, a signifi-cance level of 0.01, 0.05 or 0.10 is commonly used (Blaikie, 2003; Dougherty, 2011). If p-values are larger than 0.05, for example 0.12, it still means that we can with a certainty of 88% say that the hypoth-esis is probable.
Despite this above discussion we use, as much research suggests (Blaikie, 2003; Dougherty, 2011; John-son, 1999), a significance level of 0.05 as determinant for rejection or confirmation of our hypotheses.
Variable Total n Min Max Mean Median
evaluation* 56 0 (n=30) 1 (n=26) 0.46 - size_turnover 52 0 15 000 000 2 445 365.39 1 000 000
size_staff 56 0 1 000 77.98 9.5
16 However, we specify for all models to what level the results are significant, and even if not met at the 0.05 level still discuss its relevance. All analyses were performed in the statistical software Stata (version 12).
4.4.1. Model I
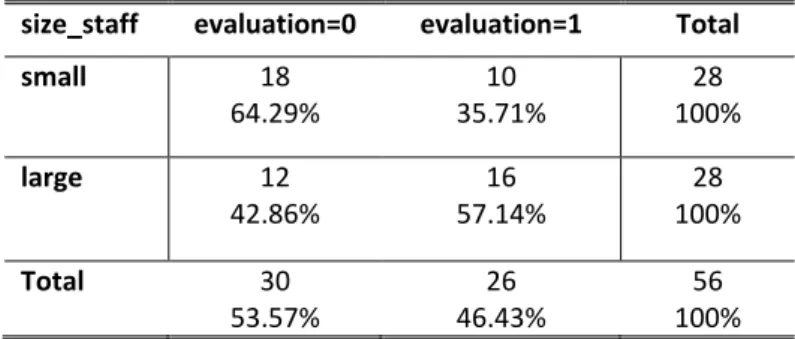
When doing hypothesis testing with two different sample groups, a t-test is a common approach. It compares the difference in means between two different groups assuming normally distributed and con-tinuous dependent variable (Blaikie, 2003). However, as our dependent variable is binary, this is not a good approach for us. Therefore, we instead conducted to a Chi-square test.Applied researchers have employed this test for more than one hundred years, and some claim there is a call for greater consider-ation of foundconsider-ational techniques like the Chi-square test, even before newer, more advanced methods arguing that the Chi-square test remains an important and useful method to analyze categorical data (Sharpe, 2015). In fact, a Chi-square test is probably the most commonly used test as it can be used for any distribution of nominal (also known as categorical) data (Gilbert & Prion, 2016). This means vari-ables with characteristics that cannot be quantified, because they are instead used to separate units or individuals into groups or categories, rather than each item having an own, numerical value (Gilbert & Prion, 2016). A Chi-square test can be calculated using any number of categories, but the simplest ex-ample compares two variables in two categories creating a 2x2 table. Sharpe (2015) suggests one should avoid a Chi-square contingency table greater than 2x2 if possible, and so we followed this advice. After collecting and coding our categorical data, a Chi-square test is a simple technique to find out if more cases fell into one category than another, what is called a goodness of fit (Sharpe, 2015). A cell-by-cell comparison of observed frequencies and percentages helps us to better understand the nature of the evidence, and is provided in the next chapter (5.2 Statistical results).
It is important to have a somewhat equal distribution of observations between groups. Our groups were created from the dummy variable, 0=have not assessed any social impact, and 1=have assessed social impact at least one time. For example, if the group who did not measure social impact consisted of 90% of the respondents, the outcome would be attenuated such that it mathematically cannot approach the maximum value regardless of the strength of the relationship between the variables (Sharpe, 2015). In our case the non-evaluating and evaluating group are similar in size, which makes our data suitable for a Chi-square test. In any study where a Chi-square test is used, the categories must be established in a logically defensible and reliable manner (Sharpe, 2015). As our independent variables are in fact non-categorical after data collection, we grouped them appropriately at the median for each variable (size_staff=9.5 size_members=20, size_turnover=1 000 000).
4.4.2. Model II
After this first hypotheses testing, we moved on to performing a simple linear regression for each vari-able. We began by estimating an Ordinary Least Squares regression which assumes a linear relationship between two or more variables, in our case only two. It is used to develop estimates for coefficients that seek to quantify the relationship when a dependent variable is assumed to be determined by another variable, normally by estimating a difference in means (Dougherty, 2011). One problem with the mean as a measurement is that the tails of a distribution can dominate its value entirely, making the mean value inordinately influenced by only one or a few extremely large or small observations (Tukey, 1977). Thus, if a measurement is intended to reflect what a typical phenomenon is like, the mean can fail (Tukey, 1977). Extreme values like this are called outliers, commonly considered to be a data point that is far outside the norm for a specific variable (Osborne & Overbay, 2004). A high variance or the presence of outliers can lead to inflated error rates and substantial distortions of parameter and statistic estimates, resulting in a higher risk of falsely rejecting the hypothesis (Osborne & Overbay, 2004). One method to adjust for the presence of extreme outliers in the data is to exclude those particular observations from the analysis completely to determine whether they play a significant role for the explanation value of the model. Previous studies has shown a strong beneficial effect of such a technique, as accuracy tended
17 to increase significantly and errors of inference tended to drop substantially once outliers were com-pletely removed (Osborne & Overbay, 2004). After careful consideration, we decided to do so in the variable where such a value seemed particularly problematic (size_turnover). This action lowered the mean value with over 500 000, and the median with exactly 100 000 (in Table 2, this observation is already excluded).
After this, there were however still some presence of very large values, particularly for the variables size_members and size_turnover as can be seen in Table 2 by the fact that the median value differs largely from the mean value. A popular measure of the dispersion of the probability distribution is the standard errors, a method to measure the dispersion of distributions around the mean (Blaikie, 2003; Dougherty, 2011). The lower the standard errors, the more concentrated is the data to the mean, larger standards errors on the contrary indicates that the data is spread wider from the mean (Blaikie 2003). Another strategy for dealing with the problem of a few very large values is to give less weight to the values in the tails of the distribution and pay more attention to the values near the center (Tukey, 1977). Due to the nature of our data distribution, we therefore chose to use robust standard errors to correct for some of the variation caused by extreme values present in our explanatory variables. Using robust pro-cedures such as robust standards errors is a common method when researchers want to protect their data from being distorted by the presence of some extreme values or large variance. Such techniques accom-modate the extreme values in the data set at no serious inconvenience, making the data robust against the presence outliers (Osborne & Overbay, 2004).
We must also consider the possibility that our size variables are correlated. If so, we would not be able to isolate any effect to any particular variable of size, as they would be correlated to each other and thereby clouding the results. Table 3 presents the linear association of all variables. Correlation indicates the extent to which different units such as individuals or organizations occupy the same relative position on two variables (Lee Rogers & Nicewander, 1988). To test the correlation we use a common correlation coefficient, Pearson’s r, which is limited to values between -1 and 1 (Blaikie, 2003). A value of 1 indi-cates a perfect positive correlation between two variables, meanwhile -1 is the perfect negative correla-tion. A correlation coefficient of 0 shows no correlated relationship between the two variables (Blaikie, 2003). A simple scheme for Pearson’s r indicates that a coefficient of approximately 0.1 is considered low, 0.3 medium and 0.5 as rather high (Blaikie, 2003). In our case almost all linear relationships are between 0.1 and 0.3, which is considered as low to medium. The only coefficient that reaches a value over 0.5, which is generally considered high, is the relationship between the explanatory variables size_members and size_staff. This represents a correlation between the number of members and the number of staff, implying that we can expect the effects of these variables to correlate to some extent. For this reason, we chose to perform three individual regression models instead of a multiple regression combining all three explanatory variables.
Table 3: Correlation. The correlation matrix shows the correlation values for depend-ent and independdepend-ent variables.
evaluation size_turnover size_staff size_members
evaluation 1
size_turnover 0.1079 1
size_staff 0.1598 0.1034 1
size_members 0.2284 0.1288 0.6950 1
To return to the method of Ordinary Least Squares, it implies an equation based on some underlying assumptions. Suppose a single linear relationship exists between a number of variables according to Y=α+βXi+ε. The variables of the hypothesized relationship are called X and Y, ε is a random error term