DISSERTATION
ACCOUNTING FOR SPATIAL SUBSTITUTION PATTERNS AND BIOECONOMIC FEEDBACK LOOPS: AN ECONOMIC APPROACH TO MANAGING INLAND
RECREATIONAL FISHERIES
Submitted by Daniel B. Deisenroth
Department of Agricultural and Resource Economics
In partial fulfillment of the requirements For the Degree of Doctor of Philosophy
Colorado State University Fort Collins, Colorado
Summer 2011
Doctoral Committee:
Advisor: Craig A. Bond Co-Advisor: John B. Loomis Chris Goemans
Stephen Davies Chris Myrick
Copyright by Daniel B. Deisenroth 2011 All Rights Reserved.
ABSTRACT
ACCOUNTING FOR SPATIAL SUBSTITUTION PATTERNS AND BIOECONOMIC FEEDBACK LOOPS: AN ECONOMIC APPROACH TO MANAGING INLAND
RECREATIONAL FISHERIES
This dissertation consists of three papers which address separate but related issues in recreational fisheries management. Paper one estimates the economic contribution of the private, recreation-based aquaculture industry in the Western United States. Paper two presents a method for combining models of site selection with input-output models in order to better estimate the true economic impacts of augmentation or deterioration of recreational sites. Finally, paper three presents a dynamic, bioeconomic model of a recreational fishery and uses that model to simulate what would happen over time to anglers and fish populations (as well as value to anglers) if fish stocking were to be halted at a single recreational fishery. All three papers are policy relevant today given the
increased pressure from (and litigation filed by) environmental groups to reduce fish stocking due to conflicts with native and endangered species.
Paper one explores the economic contribution of the private, recreation-based aquaculture industry in the Western United States. New sectors are constructed in IMPLAN input-output software using data gathered between 2007 and 2010 from producers and their direct customers (stocked fisheries). Information from a third survey
of anglers in Colorado and California is integrated to predict the short-term shocks that would occur to various industries if anglers at privately stocked fisheries were to discontinue fishing (simulating a hypothetical collapse of the industry). Accounting for both the backward and forward linkages of the private, recreation-based aquaculture industry‟s production, model results indicate that for every dollar of fish stocking, $36 dollars of recreational angler-related expenditures are supported, and that the total economic contribution of this industry in the Western United States is roughly $2 billion annually. This is the first study addressing the forward linkages and total economic contribution of this industry in the Western United States.
Paper two addresses a similar issue as paper one, but goes further to account for substitution patterns among anglers. Using information from a survey of anglers in 2009, a repeated nested logit (RNL) model of angler spatial substitution behavior is estimated. Then, the RNL is used to predict changes in angler days associated with changes in fishery attributes. By linking the RNL and input-output model, better insight is gained into the economic losses associated with augmentation or deterioration of stocked fishing sites. Results indicate that if a single site is closed within the region of analysis, of the 29,500 anglers that will no longer fish at that site, only 6,500 anglers will leave the region of analysis (the rest substituting to other in-region sites). Standard impact analysis would therefore overestimate the economic impacts of such a policy by 450%. Results are similar when catch rates are reduced by 50% at one site, with 14,000 anglers leaving that site but only 3,000 leaving the region.
The third and final paper of this dissertation presents a means by which managers may manage inland recreational fisheries from a dynamic bioeconomic perspective. A
discrete-time, discrete-space, infinite time horizon numerical model of a fishery is built in GAMS software to reflect responses of anglers to the fishery and responses of the fishery to anglers over time. A data-driven random utility model is used to inform angler
response and value functions in this dynamic bioeconomic model. Results from one region in California indicate that a) current fish stocking levels may be inefficiently high, and b) elimination of fish stocking programs at popular lakes may not lead to a crash in fishery populations, since anglers will simply substitute to other nearby fisheries (rather than “fish-out” the lake). Managers who can predict the intertemporal effects of fishery management alternatives in this way will be able to better meet the demands of
ACKNOWLEDGMENTS
I owe a great deal of thanks to Craig Bond for always expecting more out of me. Thanks also to John Loomis for knowing how to get things done, and to Marshall Frasier for keeping an eye on that which is important. Thanks to Chris Goemans for his willingness to take hours of his time to help me understand the simplest concepts. Thanks to Steve Koontz for his patience with me and help in my professional development. Thanks to Rebecca Cooper, Ken Cline and Jeremy Liley for making sure that there were never any major problems with the project, and to Jay Griebling for helping me run the project like a business (and for making work fun). Finally, thanks to Noriko for taking care of all the little things, as well as me, so that the big things simply fell into place on their own.
DEDICATION 大学生の時、私は妻に結婚してもいいですかと聞きました。でも、妻の家族は、 ドクターの後でもいいですが、今はだめですと言いました。その時とにかく結婚 しましたけど、今からドクターが終わるので、全部は大丈夫です。規子、あなた の強さ、支援、積極的な態度、我慢と、あなたの人生をより広い視野から考える ことができる力に、感謝しています。規子がいなかったら、このディーサーテー ションをできませんでした。愛しています。
When I was an undergraduate and asked my wife to marry me, her family insisted that we wait until I finish a Ph.D. Although she married me anyways, I am happy to know that I‟ve fulfilled the initial conditions under which our marriage would have been acceptable. Noriko, I appreciate your ongoing strength and support, your positive attitude, your patience with me, and your ability to see the bigger picture in life. I couldn‟t have finished this without you.
TABLE OF CONTENTS
Chapter 1: The Economic Contribution of the Private, Recreation-Based
Aquaculture Industry in the Western United States ... 1 Chapter 1 References ... 31 Chapter 1 Appendices... 33 Chapter 2: Using the Random Utility Model to Account for Substitution Effects in Economic Impact Analysis: The Case of Recreational Fish Stocking and the
Critically Endangered Mountain Yellow-Legged Frog ... 75 Chapter 2 References ... 105 Chapter 2 Appendices... 109 Chapter 3: A Bioeconomic Approach to Managing Inland Recreational Fisheries 110 Chapter 3 References ... 135 Chapter 3 Appendices... 138
Chapter 1: The Economic Contribution of the Private, Recreation-Based Aquaculture Industry in the Western United States
Forthcoming in the Journal of Aquaculture Economics and Management, 6/2011. Some
very small differences exist between this chapter and the actual submission due to
formatting and length requirements of the journal.
1. Introduction and Problem Statement
In 2006, the Center for Biological Diversity and Pacific Rivers Council filed a lawsuit against California Fish and Game, accusing the agency of failing to report the impacts of fish stocking on high mountain aquatic species (Center for Biological Diversity, 2010, PRC, 2010). Reasons for filing this lawsuit include:
“1) [Fish Stocking] can spread disease, invasive species, or unwanted fish,
2) Stocked fish prey on and compete with native fish and amphibians [e.g. the Critically Endangered Mountain Yellow-Legged Frog] for food and habitat, and;
3) Planted fish disrupt the food web and alter natural ecosystem processes to the detriment of native species.” (PRC, 2010)
After several years of litigation, in September 2010, the California Department of Fish and Game (CA DFG) published an Environmental Impact Statement (EIS) which mandated that prior to fish stocking, all waters in that state must be subjected to a “Pre-Stocking Evaluation Protocol” in order to confirm that the stocking activity will have “less than significant” impacts on native and critically endangered amphibians, most notably the charismatic Mountain Yellow-Legged Frog (CDFG, 2010). The regulations also affect the private aquaculture industry, which stocks fish in many private waters, and is often contracted to stock fish in public waters in California (Deisenroth and Bond,
20101). Private stocking permits will now be required and enforced, and will also expire annually, making it potentially more difficult and costly to stock fish in public and private waters (CDFG, 2010).
The outcome of this litigation is unprecedented in fisheries management, where, for the last century, stocking efforts have increased exponentially in order to meet the needs of a growing population of recreational anglers. And the negative effects of stocking are not limited to California: it has been revealed that the most widely stocked fish in the US and in the world, Oncorhynchus mykiss (Rainbow Trout), have detrimental effects on native species of amphibians and fish in many Western2 states, with particular focus on native trout in the Rocky Mountains and amphibians in California (Halverson, 2010; Knapp et al., 2007; Armstrong and Knapp, 2004). As more research implicates Rainbow Trout as the culprit for species declines and even local extinctions of native species, public lands managers may begin to curtail fish stocking in order to meet the needs of the general public.
These public lands managers also realize that not only does fish stocking augment the quality of the anglers‟ experience, but that in some rural areas, economies may
depend almost exclusively on tourism dollars generated from that fishery. In fact, much of the $45 billion in retail sales that recreational fishing generates annually in the United States (US) is supported by fish stocking programs which augment fishing quality and
1 Deisenroth and Bond (2010) is the final technical report to the Western Regional Aquaculture Center, and
includes a lengthy and extensive review of the data collection process, more detailed state-level analysis to the extent possible, and a more detailed description of the ASRF industry in general. This report is well over 100 pages long, and most of the information in this report is irrelevant to a professional economic audience.
2 The Western Regional Aquaculture defines the Western States as Alaska, Arizona, California, Colorado, Idaho, Montana, Nevada, New Mexico, Oregon, Utah, Washington and Wyoming. This definition is used for this paper.
encourage angler trips to local and distant fisheries (ASA, 2008). For example, Caudill (2005) found that the US Fish and Wildlife Service (USFWS) stocked 9.4 million
rainbow trout in 2004 and that for each dollar of fish produced in USFWS hatcheries, $32 dollars of economic activity was generated in local and regional economies.
While most of the lay public are aware of federal and state fish stocking agencies such as the USFWS or state-level fish and game departments, few are aware of the private aquaculture businesses which supply fish for both private and public fisheries. These businesses provide fish for thousands of privately-stocked bodies of water in the Western US, including municipal, county, and state public waters, private fishing clubs and dude ranches, fee fishing ponds, and private land. Not only are privately stocked fisheries utilized by lifelong members and affiliates, but they also supplement the fishing opportunities for other anglers provided by state and federal fisheries. The stocking of fish in public and private waters encourages tourism, which in turn stimulates the economies of the rural communities adjacent to these waters. In light of recent litigation placing restrictions not only on public fish stocking, but also on private fish stocking, knowledge of the economic contribution of such stocking is necessary in order to inform sound policy decisions.
This study estimates the economic contribution of the private, recreation-based aquaculture industry (sometimes referred to as the aquacultural suppliers of recreational fish, or ASRF) in the Western US. These producers supply fish to both private and public recreational outlets of all types, including everything from public lakes and rivers to private backyard ponds. However, to date, no study has estimated this economic contribution and as such, little is known about the potentially detrimental economic
effects of such stocking mitigation plans as suggested by the 2010 CA EIS. As such, the information provided in this paper will prove useful to policymakers and private
aquaculture facilities alike.
2. Literature
There has been little research documenting the economic contributions or impacts of any portion of the private aquaculture industry in any country, and to date, no studies have investigated the economic contributions of that portion of the industry related to support of recreational freshwater fishing (although Váradi (2001) provides background of the relationship between inland aquaculture and fisheries in Europe).
Economic impacts are usually calculated using input-output (or similar) models, such as IMPLAN, which trace the backward linkages of exogenous expenditures on inputs using matrices of linked sectors calibrated to a specific region. Examples of this technique as applied to aspects of aquaculture production include investigations of the regional economic impact of the farmed-shrimp industry in India (Reddy, Reddy, and Kumar, 2004) and southern Honduras in a development context (Stanley, 2003), and the
contributions of the pet turtle industry to the Louisiana economy (Hughes, 1999). Several studies have used similar regional techniques to estimate the economic impacts of entire fisheries from the demand side by using angler expenditures to trace through the impact of the fishery, including the recreational bluefin tuna fishery in Hatteras, NC (Bohnsack, et al., 2002) and a largemouth bass fishery at Lake Fork, TX (Chen, Hunt, and Ditton, 2003).
While many other economic reports refer to “economic contributions” as
“economic impacts,” it should be noted here that there is a critical difference. We define economic contribution analysis as that which does not take into account potential
substitution opportunities that may exist in the absence of an industry. Instead, economic contribution analysis simply traces the flows of expenditures stemming from ASRF production. For example, if the ASRF industry ceased to exist, producers may enter into other agricultural or industrial/commercial industries, while anglers might fish public, non-stocked fisheries or take advantage of alternative recreational opportunities. As such, economic contribution analysis will overstate potential contraction of the regional
economy were an industry to simply cease to exist.
This study evaluates the economic contribution of ASRF producers for two reasons. First, other studies typically report economic contribution figures, so the economic contribution of the ASRF industry provides a consistent comparison between the ASRF industry and other industries. Second, in the short run, it is likely that ASRF producers, their
customers, and anglers will have difficulty transitioning into other industries and
recreational opportunities. In the very short run, the economic contribution of the ASRF industry may be a good measure of the effect of a hypothetical removal of ASRF
production. As such, the economic impacts of that industry are left to future research. This paper proceeds as follows. The following section outlines the sampling frame and data collection of ASRF producers, ASRF customers and recreational anglers. Next is a section detailing the theoretical basis and methodological approach of the economic contribution model. Summary statistics on the three surveyed groups follow, as well as results on the direct expenditures resulting from ASRF production, economic
multipliers, and the total economic contribution of the ASRF industry. Finally, a brief section draws conclusions for policymakers.
3. Data Collection and Sampling Frame
In order to assess the magnitude of the forward and backward linkages associated with the private recreation-based aquaculture industry, three entities were surveyed: the potential population of the ASRF industry, a sample of their first point-of-sale customers, and a sample of anglers. All surveys were administered according to the Dillman Tailored Design Method (Dillman, 2000). These surveys, along with supplemental material
including maps of survey regions, can be found in appendices 1A-1N.
In total, 418 permit-holding ASRF producers were identified in the Western US3. Of these, 245 producers were found to not be in the ASRF business, identified through phone calls, mail correspondence, or consultation with industry advisors. The remaining 173 potentially active producers were mailed surveys, and 52 of these producers actually completed a survey, yielding a minimum 30% response rate. This is a low estimate of response rate, since the 173 possible producers may not have all been active producers in 2007 (see Bond et al., 2011, for further discussion of response rates of agricultural producers relative to the general public). The number of producers per state, as well as the general production characteristics of these facilities, aligns with the most recent census of aquaculture (potentially mitigating concerns regarding sample selection bias),
3
As finfish farming is illegal under Alaska Statute 16.40.210 unless farmed by a non-profit ocean-based salmon ranch, Alaska does not have any producers that fit into the for-profit ASRF category. The large scale Alaska salmon hatchery system, for example, which produces fish which are harvested by both commercial and sport fishermen, is operated by non-profit associations. As such, Alaska is excluded from the economic analysis. Initially, some surveys were distributed to Alaska producers (non-profit), but ultimately all Alaska data was excluded. A brief summary of secondary research related to the Alaska system is presented in Deisenroth and Bond (2010).
where the majority of facilities in the west exist in Washington, California, Oregon, Idaho or Colorado and the majority of facilities produce trout (USDA, 2006).
The second surveyed subpopulation was ASRF first point-of-sale customers, who were contacted by mail between November 2009 and January 2010. Since no publicly-available lists of all ASRF customers in the West are readily publicly-available, a list of 686 potential buyers was compiled through the cooperation of several ASRF producers in Colorado4. These customers included all identified categories of potential buyer,
including private fishing clubs, dude ranches, homeowners‟ associations, municipalities, state parks, fee-fishing ponds, and private landowners.
Of the 686 surveys originally mailed, 74 respondents‟ addresses were
undeliverable and 20 responded that they were no longer operating a fishery of any type and had not stocked fish recently. Of the remaining 592 potential respondents, 260 mailed their survey back for a response rate of 44%. Cross referencing survey
respondents‟ information with industry advisor data reveals that our sample of 260 is representative of the 686 originally surveyed.
The third subpopulation was of anglers in Colorado and California. In order to generate the broadest and most representative sample possible, surveys were distributed to anglers on-site at a variety of sites in order to capture differences in expenditure patterns. Sites include many types of recreational fisheries, including private and public ponds, lakes, reservoirs, streams, and rivers. This also includes private ranches, private fishing clubs, municipalities, homeowner‟s associations, and other private property. Sites
4
are also adjacent to both large population centers and rural areas in order to provide the most generalizable depiction of the economic effects of the ASRF industry.
During the summer and fall of 2009, anglers at 53 private and public fisheries were surveyed. Surveys were typically distributed in-person, although some surveys were distributed by mail using angler lists provided by private fishery managers (who did not wish to have surveys distributed in-person on-site). Surveys were distributed to 873 public fishery anglers and 355 private fishery anglers in Colorado, with 489 respondents to the public survey and 222 respondents to the private survey for an overall response rate of 58%. An additional 613 surveys were distributed to California public sites, with 359 surveys returned for a response rate of 58.5%. These response rates are consistent with other surveys of anglers (e.g. Loomis, 2006).
4. Methodology
4.1 General Approach
This paper includes both the forward and backward linkages of the ASRF industry in order to assess its total economic contribution to the Western US. Backward linkages are dollars generated by spending by the ASRF industry on inputs supplied by various industries (e.g., feed producers, insurance companies, automobile manufactures, etc.) and individuals (e.g., labor). Forward linkages are the dollars generated through the usage of ASRF products by both privately stocked fisheries and by anglers. The calculation of spending flows by this latter group is similar to the approach adopted by Caudill (2005), although in that study it was assumed that all anglers who visit a site do so as a result of fish stocking. The current study, however, accounts for the fact that many anglers would likely visit a site and spend dollars on recreation even if fish stocking did not occur. In
that sense, this study generates a more conservative estimate of the economic contribution of fish stocking.
IMPLAN (IMpact Analysis for PLANning, MIG, Inc., 1997) input-output software is used in this study to account for the backward linkages of ASRF induced expenditures. IMPLAN was originally developed by the US Forest Service but was made available to the public in 1988 by the Department of Agricultural Economics at the University of Minnesota. Currently, IMPLAN is updated and distributed by Minnesota IMPLAN Group (MIG, Inc., 1997). IMPLAN uses data for industries within a region to generate linear production functions which relate the amount of final demand for a particular sector‟s products with the amount of inputs required to achieve that level of final demand. Formally:
(1) Y (I A)*X,
where Y represents the final demand for goods, I is an identity matrix, X is a vector of inputs and A is a matrix of technical coefficients which link inputs to outputs in all sectors. Solving for X yields:
(2) X (I A)1*Y,
which is the amount of input, X, needed to satisfy final demands, Y. (I-A)-1 is the matrix of technical interdependence coefficients which measure direct and indirect levels of inputs needed to achieve final demand Y.
Economic contributions are often reported in the form of multipliers, which link one dollar of final demand to a certain amount of economic activity within a region. For example, an output multiplier of 1.85 for a particular sector indicates that for every $1 of goods purchased from that sector, an additional $0.85 cents are generated within the
region. As Y represents final demands in equation (2), the vertical sum of a column in the (I-A)-1 matrix represents the output multiplier for a particular sector.
For this study, Y represents expenditures on goods and services resulting from ASRF stocking. The matrix of technical coefficients in IMPLAN is used to calculate X, which is the amount of total economic activity resulting from changes in final demands of anglers in the absence of ASRF fish stocking. By simulating a cease in angler
expenditures, this study essentially simulates a hypothetical removal of the ASRF industry from the Western economy, and therefore a hypothetical removal of ASRF stocking induced expenditures. The economic contribution of these expenditures is ultimately a measure of the economic contribution of the ASRF industry.
Input output modeling makes several assumptions which may not be appropriate in this instance, including Leonteif production functions, fixed prices, and a failure to account for potential substitution patterns in the absence of certain goods. However, despite these drawbacks, IMPLAN is a standard tool used to trace spending flows throughout a regional economy, and since the results of this paper will likely be compared with other similar reports, it is important to maintain consistency in order to facilitate efficient policy recommendations. For a more thorough review of input-output analysis and its major shortcomings, please see Miller and Blair (2009).
4.2 Forward Linkage Construction
In order to estimate the total economic contribution of the ASRF industry, the forward linkages of that industry‟s production, coming in the form of anglers‟ final demand and expenditures related to ASRF stocking, must first be estimated. Then, the backward linkages of these angler expenditures are traced through IMPLAN in order to estimate the
amount of money generated per angler dollar spent, and thus per dollar of ASRF product sold.
The first step of the forward linkage construction (angler expenditures related to ASRF stocking) was to estimate total ASRF industry sales. This was calculated by multiplying the average sales of sampled firms by the total number of firms in the industry, which is estimated as outlined in section 2. Formally:
(3) p s P S p i P i P
1 ,where SP is total industry sales, P is the estimated total number of private hatcheries in ASRF, p is the sample size and siP is the sales dollars of individual firms in our sample.
Next, the number of ASRF first point-of-sale customers was estimated. While the total number of ASRF customers is uncertain, the amount that the average sampled customer spends on ASRF products is known. Using total ASRF industry sales from equation (3) above, total ASRF industry sales were divided by individual customer purchase amounts to estimate the number of ASRF customers as follows:
(4) c e S C c k c k P
1 / ,where C is the total number of ASRF customers, ekc is individual sampled customer annual expenditure on ASRF products and c is the sample size of ASRF customers.
Survey data for each ASRF customer includes annual gross sales and
expenditures, the percentage of these sales attributable to fishing, and the percentage of fishing sales attributable to stocked fishing. These self-reported figures were used to
estimate the amount of gross sales and expenditures attributable to stocked fishing as follows: (5)
c s C S c k k k c k CSF
1 / ,where SCSF is total stocked fishing related sales of ASRF customers, skc is the gross sales
of individual ASRF customers, k is the percentage of sales attributable to fishing and
k
is the percentage of fishing sales attributable to stocked fish5.
Finally, to estimate the number of angler days generating these sales, the average amount of money that the mean angler spends on-site in a day is used. Dividing total stocked-fishing related revenue by the amount of money spent by an angler in a typical day on-site, the number of privately-stocked-induced angler days in a year at all ASRF customer sites is estimated by:
(6) c e S C AD c k a k CSF
1 ,where AD represents ASRF-induced angler days and eka represents on-site daily angler expenditure for ASRF customer k. This assumes that all stocked-fishing-induced sales come from anglers6.
5 These calculations are based the assumption that survey respondents are able to approximate k
andk with a reasonable degree of accuracy. This may be a difficult task given that many of these customers are not solely fishing-based operations; many are general dude ranches or private clubs which offer other recreation services such as scenic viewscapes, horseback riding and hunting, and may not be able to accurately estimate the appropriate shares. Still, this is likely more accurate than Caudill, 2005, where 100% of fishing revenues are assumed to come from stocked fishing.
From the models presented here, total angler expenditures are simply daily angler expenditures multiplied by the total number of angler days. Only primary-destination angler expenditures are used for this part of the analysis, since it is unknown what portion of secondary or tertiary-purpose anglers‟ expenditures are attributable to fishing:
(7)
It should be noted that all estimates were derived from sample rather than population statistics. The potential for both sample-selection bias and self-selection bias is present, and may result in either over- or under-estimation of economic contributions. Still, every effort was made to capture representative samples, and the authors believe that the results are a reasonable depiction of the ASRF industry‟s economic contribution to the Western US. Furthermore, the multipliers derived in the next section are within the range of other agricultural industries (MIG, 1997). If there is any bias in our estimation, it is likely to come from the scope and size of the industry, which is estimated rather than known. The direction of this bias, however, is unknown, but would have only linear effects on the final contribution estimates.
6 Some ASRF customers do not have any sales (e.g. private backyard pond owners). For these customers,
we utilize a separate survey question which simply asks how many anglers visit the site annually. We assume here that all angler visits are due to stocked fishing and that survey respondents interpreted the annual angler question as annual angler days. This is for three reasons: 1) we have no other prior since we have no data on angler visitation patterns at private ponds with no sales; 2) it may be difficult for a non-sales fishery manager to retrospectively differentiate between two anglers coming for one day each or one angler coming for two days; and 3) the average privately stocked fishery with sales has fewer angler days (only 21% of total angler visitors) than stated anglers due to the fact that most angler days are not attributable to fish stocking. If we assumed that 100% of angler days were attributable to fish stocking for ASRF customers with sales, our data indicates that these producers interpreted “annual angler visitors” as “annual angler days.”
* .
5. Results
5.1 Demographic Statistics from the Surveyed Populations
Most WRAC-region producers (nearly half) are located in California. This makes sense given the climate and population of that state. Colorado, Oregon, and Washington are home to the vast majority of the remainder of potential ASRF businesses. There were no completed surveys from Arizona, and several Arizona permit holders indicated that they are in the food-fish aquaculture businesses, farming fish such as Tilapia due to the warmer weather and water. A breakdown of the number of potential producers by state can be found in table 1.
Table 1: Identified Producers By State
State Active Permits Not in Business Potential ASRFBusinesses Source of Information
Alaska 77 77 0
Department of Fish and Wildlife
Arizona 15 11 4 Department of Agriculture
California 154 84 70 Department of Fish and Game
Colorado 45 22 23
Colorado Aquaculture Association
Idaho 11 1 10 Department of Agriculture
Montana 8 3 5
Department of Fish, Wildlife, and Parks
Nevada 7 4 3 Division of Wildlife
New
Mexico 1 0 1
Mike Sloane, New Mexico State University Extension
Oregon 31 13 18
Department of Fish and Wildlife
Utah 24 12 12
Department of Agriculture and Food
Washington 41 18 23
Department of Fish and Wildlife
Wyoming 4 0 4 Department of Fish and Game
A typical ASRF business is operated by a 55-year old married man who has been in the business over 20 years. Gross sales for ASRF businesses average $330,000
annually (although sales are much higher for a few businesses but lower for a majority of businesses). Finally, income from aquaculture typically constitutes about half of
household income, with many producers indicating through phone conversations that they are involved in some other agricultural activity for supplemental income. Table 2 summarizes the demographic statistics of survey respondents.
Table 2: Demographic Statistics
Variable Average Standard
Deviation Minimum Maximum
Age 55 13 30 85
% Male 90% n/a n/a n/a
Years in ASRF Business 22 13 1 60 Years in Aquaculture in General 23 13 4 60 Size of Household (Persons) 3.3 2 1 8
% Married 88% n/a n/a n/a
% Who Live On-Site 80% n/a n/a n/a
Earnings as a % of
Total Income 45% 37% 0% 100%
The typical respondent to the ASRF customer survey is a 60 year old married man with a college education and 13 years of experience. He still has one child at home, and in many cases either his wife or his child are contributing to household expenses. Most live on site, with 5% of their annual income is derived from fish-stocking related services. ASRF customer demographic statistics can be seen in table 3.
Table 3: ASRF Customer Demographic Statistics
AverageStandard
Deviation Minimum Maximum
Age 58.51 11.49 94 24 % Male 90% 31% 0% 100% Years of Experience 12.79 12.43 0 64 Years of Education 15.80 2.17 9 19 Household Members 2.84 1.47 1 11 Contributing Members 1.67 0.78 0 6
% Married 89% 69% n/a n/a
% With Home On Site 59% 49% n/a n/a
% of Income from Fishery 5% 18% n/a n/a
The survey of anglers suggests that those intercepted at private fisheries are older, more likely to be retired, and receive a higher income than their public fishery
counterparts. The average age of anglers at private fisheries is just over 60, compared with 53 and 50 for Colorado public and California anglers, respectively. Anglers at private fisheries also have an average of 15.77 years of education (a 4-year bachelor‟s degree is 16 years), compared with 14.8 and 14.2 for Colorado and California public fishery anglers, respectively. Most of the private fishery anglers surveyed are members of a private fishing club, with only small percentages of public fishery anglers being
members. Most anglers at all types of site are male. Summary statistics are provided in table 4.
Table 4: Angler Demographic Statistics
Average
Standard
Deviation Minimum Maximum
% Male 89% n/a n/a n/a
% Employed 71% n/a n/a n/a
% Retired 35% n/a n/a n/a
% Private Fishing
Club Member 22% n/a n/a n/a
Age 53 15 89 15
Years of Education 15 2 6 19
Income $80,778 $38,736 $20,000 $500,000
5.2 Production Functions and Multipliers
Using sales and expenditure data from the three surveys, two new sectors are constructed in IMPLAN: one for ASRF producers and another for ASRF customers. The production functions for these sectors map a dollar of sales of a particular product into a set of expenditures on supplies, equipment and personnel. This section summarizes the production functions and multipliers of all three surveyed populations: ASRF producers, ASRF customers, and recreational anglers (expenditure patterns for the latter category). The information contained in these multipliers is used in the calculation of the total economic contribution of the ASRF industry.
5.2.1 ASRF Producers
All producer data is averaged and aggregated into a single production function which is built into IMPLAN. For every amount that is inputted into the new “ASRF Producer” sector, the “Other Animal Production” sector, which originally included ASRF producers, is reduced by that same amount in order to keep the same economy-wide output and employment levels. The specific per-producer averages (excluding food fish) used in model construction are given in table 5 Of the $330,000 in gross annual sales,
$120,000 is attributable to non-depreciated expenditures such as fish and eggs, feed, electricity, and gasoline. Labor expenditures exceed $90,000 annually, including wages, benefits and labor taxes. $75,000 is spent annually on the purchase, maintenance and lease of buildings, fish production facilities, equipment and transportation equipment. Finally, proprietors net only $45,000 annually. This makes sense, given that the average ASRF producer only derives 50% of his annual income from his ASRF operation. Note that the high standard deviations relative to the means of each expenditure category indicate a large variation in scale among ASRF producers in the region.
Using the production function above, IMPLAN traces through the backward linkages of ASRF expenditures to generate economic multipliers, which are summarized in table 6 for the ASRF industry. For every dollar spent on ASRF products, $1.85 is generated in the Western economy. This is due to the direct effect of the $1 to ASRF producers, the indirect effect of $.35 to input suppliers, and the induced effect of $.50 from spending by employees and proprietors. Likewise, every million dollars of ASRF sales results in 21.61 full-time jobs in the Western economy. Finally, for every full-time job supported by the ASRF industry directly, .37 additional jobs are supported throughout the economy.
Table 5: ASRF Production Function
Category Average Annual Expenditures Standard Deviation Absorption Coefficient*Fish and Eggs $23,041 $83,605 0.070
Feed $41,439 $90,718 0.125
Electricity $10,220 $21,596 0.031
Natural Gas/Propane $572 $1,600 0.002
Other Utilities $2,484 $10,498 0.008
Gasoline $9,079 $25,831 0.027
Chemicals/Supplies and Oxygen $6,564 $23,238 0.020
General Consumable Supplies $2,206 $6,452 0.007
Shipping and Distribution $9,823 $31,747 0.030
Non Labor Insurance $4,041 $10,357 0.012
Licenses/Permits/Inspection Fees $1,778 $4,736 0.005
Marketing and Advertising $1,340 $4,190 0.004
Other $2,610 $11,910 0.008
Non-Shipping Depreciated Vehicle
Expenses $2,779 $6,661 0.008
Total Non Depreciated Expenditures $117,977 Buildings, Fish Production Facilities,
General and Transportation
Equipment $74,966 $16,383
Labor Expenditures $92,772 $173,915
Proprietary Income $45,144 $33,795
Sales $330,858 $40,291
Employment 7.15 8.59
Total ASRF Producers 173
Aggregate Sales $57,238,415
Aggregate Employment 1,237
*The percentage of total direct sales revenue that is spent on non-depreciated
expenditures. The sum of all absorption coefficients is often referred to as the “gross absorption coefficient.”
Table 6: ASRF Industry Multipliers
Direct Effect Indirect Effect Induced Effect Total Effect Type SAMb Multiplier ASRF Output 1.00 0.35 0.50 1.85 1.85 ASRF Employmenta 21.61 4.21 3.72 29.54 1.37 aEmployment effects are reported per $1,000,000 of gross sales b
SAM stands for Social Accounting Matrix. This multiplier captures the direct, indirect, and induced effects of the ASRF industry.
Given the unique nature of the Western states, it is unlikely that the economic effects of the ASRF industry will be distributed uniformly across the region. Indeed, only one producer was identified in New Mexico, while 70 were identified in California. The present analysis therefore treats the Western Region as the region of analysis and makes no attempt to differentiate between states.
5.2.2 ASRF Customers
Average ASRF customer expenditure figures are used to create the ASRF
customer sector in IMPLAN. As discussed in section 3, annual expenditures and sales are multiplied by the reported percentage of sales attributable to stocked fishing. Table 7 summarizes this production function. For every amount that is inputted into the new “ASRF Customer” sector, the “Other Recreation Industries” sector, which originally included ASRF customers, is reduced by that same amount in order to keep the same economy-wide output and employment levels. Most expenditures are categorized as depreciated and non-depreciated inputs. Non-depreciated inputs include fish, non labor insurance, food (for customers), feed (for fish) and electricity. Depreciated expenditures include maintenance, purchase and lease costs of buildings and facilities. In an
accounting sense, the average ASRF customer takes a loss annually from his fishing operation, primarily due to the fact that half of these customers have no sales. Rather, they purchase fish for their own enjoyment and do not anticipate accounting profits from their fishing operation.
Table 7: ASRF Customer Production Function in IMPLAN
IMPLAN Category Annual Expenditures Standard Deviation Absorption Coefficient ASRF $2,656 $8,786 0.195360 Feed $245 $1,981 0.018008 Chemicals $199 $1,086 0.014654 General Supplies $48 $378 0.003542 Electricity $341 $1,610 0.025090Natural Gas/ Propane $74 $513 0.005452
Other Utilities $194 $1,560 0.014272 Food $982 $12,694 0.072231 Fishing Equipment $72 $351 0.005299 Vehicle Expenses $145 $942 0.010687 Gasoline/ Diesel $172 $833 0.012617 Marketing $300 $2,028 0.022091 Licenses/ Permits $88 $477 0.006457
Non Labor Insurance $551 $3,420 0.040513
Other $873 $6,719 0.064217
Total Non-Depreciated
Expenditures $6,939 0.510489
Other Property Income $6,986 $67,824
Labor Expenditures $2,975 $14,096
Proprietor Income (residual) -$3,306 n/a
Sales $13,593 $60,210
Employment 0.43 1.32
Total ASRF Customers 20,053
Aggregate Sales $272,588,780
Aggregate Employment 8,658
Multipliers for the ASRF customer sector in the Western region can be found in table 8. Every dollar spent on ASRF customer products results in $1.79 being generated in the regional economy. Furthermore, as this industry is labor-intensive, every million dollars of ASRF customer sales directly supports 32 full-time jobs annually. Due to the indirect and induced effect, every job directly supported by the ASRF customer sector implies an additional .28 jobs in the region.
Table 8: ASRF Customer Multipliers
Direct Effect Indirect Effect Induced Effect Total Effect Type SAM Multiplier ASRF Customer Output 1.00 0.61 0.17 1.79 1.79 ASRF Customer Employment 31.76 7.76 1.27 40.80 1.28 5.2.3 AnglersAnglers spend their money on a variety of items on a typical fishing day. The typical private fishery angler spends the bulk of his money on package deals, guide fees and hotels. Conversely, the typical public fishery angler spends most of his money on gasoline, licenses and supplies. As fishing licenses are not required at many private sites, anglers at private fisheries can enjoy fishing without the added upfront cost of $31 or $41.50 for Colorado and California, respectively (CDOW, 2010, CDFG, 2010)7.
Although California anglers spend a bit more overall than do Colorado anglers, gasoline expenditures of California anglers dwarf those of Colorado anglers. Colorado Anglers, on the other hand, spend more money on airfare and rental cars (more Colorado anglers are from out-of-state). Figure 1 demonstrates the different types of expenditures of the three surveyed angler groups.
7 Fishing license expenditures per day are not the same as annual license costs in that these expenditures refer to those purchases made for the most recent fishing trip (which may have been the cost of a license, or may have been zero, even for public-fishery anglers).
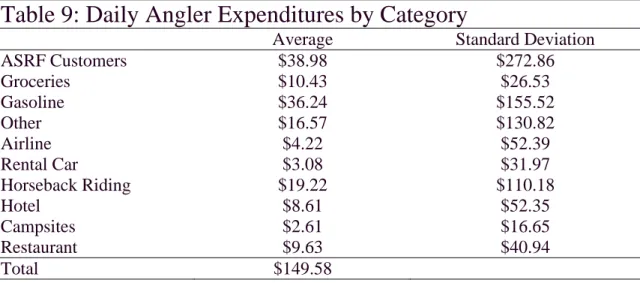
Expenditures from all three angler groups are averaged and aggregated into sales categories that align with IMPLAN sectors. Table 9 gives the amount spent by the average angler in a typical day in a variety of these categories.
Table 9: Daily Angler Expenditures by Category
Average Standard Deviation
ASRF Customers $38.98 $272.86 Groceries $10.43 $26.53 Gasoline $36.24 $155.52 Other $16.57 $130.82 Airline $4.22 $52.39 Rental Car $3.08 $31.97 Horseback Riding $19.22 $110.18 Hotel $8.61 $52.35 Campsites $2.61 $16.65 Restaurant $9.63 $40.94 Total $149.58 $0 $10 $20 $30 $40 $50 $60 Gas oline Resta urant Groc erie s Supp lies Publ ic C ampi ng Priva te C ampi ng Hot els Hor seba ck R iding Gui de F ees Fishi ng Li cenc es Fishe ry Ent ranc e Fe es Car R
entalAirline Packa
ge D eals Other
Figure 1. Daily Angler Expenditures by Category
Colorado Public ($138/Day) Colorado Private ($135/Day) California ($180/Day)
With the information in table 9, IMPLAN software is used to simulate a hypothetical removal of angler dollars from the Western Region. Then, the effect of a removal of one dollar of angler expenditures is reported in the form of output and employment multipliers, just as in the previous two sections. On average, every dollar spent by anglers results in an additional $.83 cents generated in the region, and every million dollars spent by anglers directly results in 18.36 jobs (25.07 jobs when accounting for the multiplier effect).This information is summarized in table 10.
5.3 Forward linkages and Total Economic Contribution of the ASRF Industry Table 7 shows the level of sales, jobs, and expenditures at an aggregated industry level for the ASRF industry (not including the sales of food fish). These numbers are found by multiplying the average levels (from above) by the total number (173) of potential individual ASRF businesses. Average sales data in conjunction with our
estimate of 173 total producers and equation (3) above results in a mean estimate of $57.2 million in ASRF direct sales annually.
Mean annual expenditures of ASRF customers on ASRF products is
approximately $2656 annually. Since ASRF industry sales total $57.2 million, but only $53.2 million to non-ASRF customers (some producers buy from other producers), we predict, using equation (4), that there are approximately 20,053 ASRF customers in the Western US. Therefore, while ASRF customers purchase only $53.2 million of ASRF
Table 10: Angler Expenditure Multipliers
Direct Effect Indirect Effect Induced Effect Total Effect Type SAM Multiplier Output 1.00 0.41 0.41 1.83 1.83 Employment 18.36* 3.64 3.07 1.37 1.37products, equation (5) predicts that the availability of those products is estimated to create $272.6 million in direct sales to anglers.
Using equation (6), we estimate that there are 6.99 million ASRF supported angler days in the Western US. This is in contrast to Caudill (2005) which assumes that all angler expenditures are due to stocked fishing. This study accounts for ASRF customers reported percentage of sales attributable to stocked fishing. Our ASRF customer survey indicates that anglers spend an average of $38.98 in a typical day at a private fishery. However, our angler survey reveals that anglers in fact spend $149.58 on a typical fishing day. This is due to off-site expenditures such as airfare, gasoline,
groceries, etc. As such, there are shocks to other industries, such as petroleum refineries, which would occur as a result of a hypothetical removal of the ASRF customer industry, as seen in table 9. The direct expenditures by the 6.99 million privately stocked fish induced angler days is estimated to be $1.046 billion annually, with $272.6 million of this going to ASRF customers.
The total economic contribution of the ASRF industry is calculated by tracing the backward linkages of a complete hypothetical exodus of ASRF industry-induced angler expenditures from the region in IMPLAN. ASRF industry-induced angler expenditures amount to $1.04 billion dollars annually in the Western US, but these direct expenditures lead to many indirect and induced effects throughout the economy.
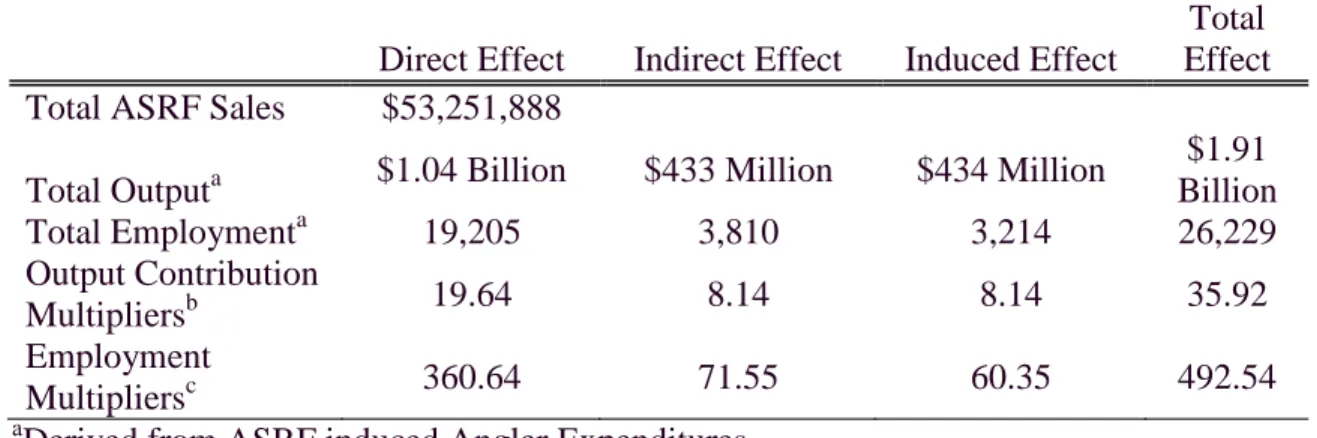
Table 11 provides estimates of the total output and employment contributions of
forwardly-linked industries related to ASRF. The $53.25 million dollars of direct sales of ASRF products leads to a total of nearly $2 billion dollars in economic activity in the Western Region of the US. This translates into a “contribution multiplier” of 35.92: for
every $1 of sales of ASRF products, $35.92 dollars of in-region economic activity is attributable to the ASRF industry8. Furthermore, 26,229 full-time jobs are supported by the presence of this industry. An employment contribution multiplier of 492 in this
instance means that for every one million dollars of ASRF sales, nearly 492 full-time jobs are supported in the region.
Table 11: Output and Employment Contribution of ASRF
Industry in the Western United States
Direct Effect Indirect Effect Induced Effect
Total Effect Total ASRF Sales $53,251,888
Total Outputa $1.04 Billion $433 Million $434 Million
$1.91 Billion Total Employmenta 19,205 3,810 3,214 26,229 Output Contribution Multipliersb 19.64 8.14 8.14 35.92 Employment Multipliersc 360.64 71.55 60.35 492.54 a
Derived from ASRF induced Angler Expenditures b
Dollars of economic activity per dollar of ASRF producer output. c
Jobs per million dollars of ASRF producer output.
Several industries are affected more significantly than others. Table 12 outlines, as an example, the top 10 industries affected in terms of output by the presence of the ASRF industry. ASRF customers rank first, but closely following is gasoline stations, grocery stores, and sporting goods stores.
8 This is different from a traditional multiplier (see table 6), which only accounts for the backward linkages of an industry‟s output.
Table 12: Top 10 Output Sectors Impacted by ASRF Industry
(in Millions of Dollars)
IMPLAN Sector Direct Effect
Indirect Effect Induced Effect Total Effect ASRF Customers $272.58 $0.00 $0.00 $272.59
Retail Stores - Gasoline
stations $253.42 $5.30 $2.51 $261.23
Other amusement and
recreation industries $134.43 $0.25 $0.86 $135.54
Retail Stores - Sporting
goods- hobby- book a $115.89 $1.67 $1.36 $118.93
Food services and drinking
places $67.33 $24.47 $19.33 $111.13
Retail Stores - Food and
beverage $72.93 $0.32 $6.85 $80.10
Hotels and motels-
including casino hotels $60.22 $1.49 $2.61 $64.32
ASRF Industry $0.00 $57.24 $0.00 $57.24
Real estate establishments $0.00 $33.06 $19.99 $53.05
Imputed rental activity for
owner-occupied dwellings $0.00 $0.00 $45.80 $45.80
Total $1,046.11 $433.39 $433.57
$1,913.0 7
6. Conclusion
For people not native to the region, the Western United States represents the frontier of adventure. Recreational fishing is no small part of this image, with Rocky Mountain Trout, wild coastal salmon runs, and Southern California world-record largemouth bass creating opportunities for anglers to test their skills and connect with nature. This recreational industry also supports billions of dollars of sales and hundreds of thousands of jobs in that region. The private, recreation-based aquaculture industry supports a substantial portion of this economic activity.
The Aquacultural Suppliers of Recreational Fish (ASRF) producers in the Western US are typically small businesses, on average grossing only $330,000 annually in recreational fish sales. That there are no more than 173 of these small businesses may
lead policymakers to overlook this industry as an insignificant component of their economy. However, these 173 producers support over 20,000 privately-stocked fisheries and nearly 7 million annual angler days. Results show that for every dollar spent on ASRF products, $36 dollars of activity and are created and that for every million dollars of ASRF sales, nearly 500 jobs are supported in the region. The aggregate contribution of this industry that sells $53.2 million worth of fish is estimated to be nearly $2 billion annually.
The challenge for Western policymakers is to weigh the costs and benefits of policies which may put a damper on ASRF production. Current legislation facing the ASRF industry involves increased regulations with regards to permitting, disease mitigation, endangered species and stocking policies. However, it is important to recognize that these regulations may have adverse effects on the regional economy. Accounting for these regional economic effects will foster enhanced efficiency and welfare not only for the ASRF industry, but for their customers, recreational anglers, and the general economy of the Western US.
There are several potential shortcomings to the analysis presented here that should be noted. First, the estimates of economic contribution reported in this study are based on primary data collected via mail survey. While every effort was made to represent the major backward and forward linkages of the ASRF industry in accordance with best practice and standard economic theory, there are a variety of potential sources of error associated with these estimates, including sampling bias (via self-selection), statistical variability, and sensitivity to outliers.
Second, the input-output models used in this paper are known to have several
shortcomings. These include, but are not limited to, assumptions of constant returns to scale, no input substitutability in fish production and other industries, constant prices, etc. Several of the most common issues with input-output analysis are discussed and justified in Leonteif (1955) and Miller and Blair (2009). Most of these limitations are due to the practical realities of modeling economy-wide economic impacts, where researchers wish to make with- vs. without- comparisons, but data only exists on the with- scenario. These issues, which are prevalent in nearly all economic impact and economic contribution analyses, will tend to result in over-estimation of the economic contribution or impact of a particular sector.
Third, the Western Region is treated as the region of analysis in this study, which may thwart efforts to extrapolate these results, including multipliers, to regions or sub-regions not presented in the text. This sort of extrapolation is not advisable given differences in regional economic structure and characteristics of ASRF producers. Fourth, we make no claim as to economic impact of the ASRF and supporting industries as defined above in the introductory section, as we have little to no information about the potential for substitution production activities in the case of the various industries
involved, as well as the recreational substitution patters of anglers in the Western US. Rather, we simply estimate the total expenditures related to the ASRF industry, and trace their flow through the regional economy. Nevertheless, we believe that both our data collection and economic contribution methodologies are sound, and place the economic contributions of the ASRF industry in reasonable context.
Finally, although this study accounts for the total economic contribution of the ASRF industry, it should be noted that this is not the only indicator of economic importance. Economic value, often referred to as “consumer surplus,” is the difference between an individual‟s maximum willingness to pay and what he or she actually needs to pay for some good. In the case of privately stocked fishing, anglers may derive many millions of dollars worth of satisfaction over and above what they actually paid at the ASRF customer site. This is different from the economic contribution of the ASRF industry, which merely tracks the amount of output dollars and jobs that come as a result of the presence of that industry. This economic value is a direct measure of the welfare induced by the presence of the ASRF industry, and future analysis should endeavor to account for this value in order to elucidate the true economic benefits of the ASRF industry to the Western US. Nevertheless, the estimates provided in the present analysis should prove useful today given the current economic climate and pressure on fish stocking from various environmental groups.
Chapter 1 References
American Sportfishing Association [ASA] (2008) Sportfishing in America: An Economic Engine and Conservation Powerhouse. Final Report. Wildlife and Sportfish Restoration Programs, the Association of Fish and Wildlife Agencies and the U.S. Fish and Wildlife Service. <www.asafishing.org/images/statistics/resources/SIA_2008.pdf>, accessed February, 2011.
Armstrong, T.W. & R. A. Knapp (2004) Response by Trout Populations in Alpine Lakes to an Experimental Halt to Stocking. Canadian Journal of Fisheries and Aquatic Science 61, 2025-2037
Bohnsack, B.L., R.B. Ditton, J.R. Stoll, R.J. Chen, R. Novak, & L.S. Smutko (2002) The Economic Impacts of the Recreatoinal Bluefin Tuna Fishery in Hatteras, North Carolina. North American Journal of Fisheries Management 22, 165-76.
Bond, C.A., D.L. Hoag & G. Kipperberg (2011) Agricultural Producers and the Environment: A Stated Preference Analysis of Colorado Corn Producers. Canadian Journal of Agricultural Economics 59, 127-144
California Aquaculture Association (2010) “Fish and Game ISOR about Stocking” http://www.caaquaculture.org/2010/08/19/fish-and-game-isor-about-stocking/ California Department of Fish and Game [CDFG] (2010) 2010 Sport Fishing Entitlements. <http://www.dfg.ca.gov/licensing/fishing/fishdescrip.html>, accessed February, 2011.
Caudill, J. (2005) The Economic Effects of Rainbow Trout Stocking by Fish and Wildlife Service Hatcheries in FY 2004. U.S. Fish and Wildlife Service, Division of Economics <www.fws.gov/species/rainbowtrout/DrJimCaudill-report.doc>, accessed February, 2011.
Center for Biological Diversity (2010) California Endangered Species Act Protection Sought to Save Mountain Yellow-legged Frog from Exotic Trout, Habitat Destruction, and Disease. Press Release.
<http://www.biologicaldiversity.org/news/press_releases/2010/mountain-yellow-legged-frog-01-25-2010.html>, accessed February, 2011.
Chen, R.J., K.M. Hunt, & R.B. Ditton (2003) Estimating the Economic Impacts of a Trophy Largemouth Bass Fishery: Issues and Applications. North American Journal of Fisheries Management 23, 835-44.
Colorado Division of Wildlife [CDOW] (2010) Fishing. <http://wildlife.state.co.us/fishing/>, accessed February, 2011.
Deisenroth, D.B. & C.A. Bond (2010) The Economic Contribution of the Private, Recreation-Based Aquaculture Industry in the Western United States. Final Report. Western Regional Aquaculture Center.
Dillman, D. A. (2000) Mail and Internet Surveys: The Tailored Design Method 2nd ed. John Wiley & Sons, New York, NY, USA.
Halverson, A. (2010) An Entirely Synthetic Fish: How Rainbow Trout Beguiled America and Overran the World Yale University Press, New Haven, CT, USA.
Hughes, D.W. (1999) The Contribution of the Pet Turtle Industry to the Louisiana Economy. Aquaculture Economics and Management 3(3), 205-214.
Knapp, R.A., D.M. Boiano, & V.T. Vredenberg (2007) Removal of Nonnative Fish Results in Population Expansion of a Declining Amphibian (Mountain Yellow-Legged Frog, Rana muscosa). Biological Conservation 135, 11-20
Leonteif, W. (1955) “Some Basic Problems of Empirical Input-Output Analysis,”
Chapter 1 in Input Output Analysis: An Appraisal, Princeton University Press, Princeton, NJ
Loomis, J.B. (2006) Use of Survey Data to Estimate Economic Value and Regional Economic Effects of Fishery Improvements. North American Journal of Fisheries Management 26, 301-307
Lubben, B.D., N.L. Bills, J.B. Johnson & J.L. Novak (2006) The 2007 Farm Bill: US Producer Preferences for Agricultural, Food, and Public Policy. Publication Number 2006-01. National Public Policy Education Committee.
MIG, Inc., (1997) IMPLAN System (2007 data and software), 1725 Tower Drive west, Suite 140, Stillwater, MN 55082, <www.implan.com>, accessed February, 2011. Miller, R.E. & P.D. Blair (2009) Input-Output Analysis: Foundations and Extensions Cambridge University Press, Cambridge, MA, USA.
Pacific Rivers Council [PRC] (2010) Advocating for Fish Stocking Reform.
<http://pacificrivers.org/conservation-priorities/native-aquatic-species/fish-stocking>, accessed February, 2011.
Reddy, V.R., P.P. Reddy, & U.H. Kumar. (2004) Ecological and Economic Aspects of Shrimp Farming in Andhra Pradesh. Indian Journal of Agricultural Economics 59(3) 435-47.
Stanley, D.L. (2003) The Impact of Mariculture on a Small Regional Economy. World Development 31(1) 191-210.
United States Department of Agriculture [USDA] (2006) 2005 Census of Aquaculture. <http://www.agcensus.usda.gov/Publications/2002/Aquaculture/index.asp>, accessed February, 2011.
Váradi, L. (2001) Review of Trends in the Development of European Inland Aquaculture Linkages with Fisheries. Fisheries Management and Ecology 8, 453-62
Chapter 1 Appendices
Appendix 1A: Producer Survey Cover Letter
Department of Agricultural and Resource Economics Fort Collins, Colorado 80523-1172 (970) 491-6325 FAX: (970) 491-2067 http://dare.colostate.edu/
Dear Aquacultural Producer,
In 2006, with producer support, the Western Regional Aquaculture Center sponsored a project to assess the economic contribution of the Aquacultural Suppliers of Recreational Fishing (ASRF), an industry that has not previously had its role and economic impact on the region assessed in detail. Completion of this project requires assistance from all ASRF producers during the information gathering process. It is imperative that the survey results reliably represent the broadest possible activity of ASRF producers, so your input is valuable. This project will be administered by the Department of Agricultural and Resource Economics at Colorado State University in conjunction with participation of faculty members throughout the Western United States. The participants include faculty from the University of Arizona, University of California, Davis, University of Idaho, and New Mexico State University.
The survey will examine the range of activities undertaken by ASRF producers and determine major issues facing the industry. In this survey, we ask first about the general size of your operations, and then we ask about a variety of sales outlets and locations. These questions are followed by questions regarding costs incurred within your operation and the values and
purchases of a variety of assets. A clear, research-based understanding of the contribution of the ASRF industry will permit the best possible demonstration of your economic value to the Western region. All information gathered in this survey will be managed according to CSU‟s strict confidentiality requirements during and after the completion of this project.
While your participation in this survey research is of great importance to us, we would like to ensure you that your participation is voluntary. Your responses will be held in strict confidence and reported only in aggregated form. There are no known risks to your participation in this survey. It is not possible to identify all potential risks in research procedures, but we have taken reasonable safeguards to minimize any known and potential, but unknown, risks.
To complete the survey, please use 2007 data for your financial, marketing, and business size information. Those producers completing the survey are eligible to receive copies of the
completed survey results, with appropriate disclosure and confidentiality dimensions in place. If this survey does not actually apply to you, simply write a brief explanation on the survey and return it in the enclosed pre-paid envelope.
For more information about this project, please contact Dr. Craig Bond at 970-491-6951, or by email at Craig.Bond@colostate.edu
Appendix 1B: Producer Survey
The Economic Contribution
of the Aquacultural Suppliers
of Recreational Fish
Section A: General Operational Questions
Aquaculture producers vary substantially in scale and scope and may use a great variety of technologies. In order to better understand the variety of aquaculture producers in the west, we need to ask questions about your operation.
1. Please indicate your production and sales levels for salmonids (trout, salmon, etc.) and for your warm/cool water species (in terms of sales dollars for 2007). (If you do not produce or sell warm/cool water fish, please leave these sections blank. If you do not produce or sell Salmonids, please leave these sections blank.)
Salmonids
Production Levels:________ (Lbs/Year) Sales $_____________ Brokered Levels: _________(Lbs/Year) Sales $_____________
Warm/Cool Water Species
Production Levels:________ (Lbs/Year) Sales $_____________ Brokered Levels: _________(Lbs/Year) Sales $_____________
2. Which methods of production did this operation use for Salmonids and Warm/Cool Water Species in 2007? This does not apply to brokered fish. Please enter total water area or volume for each method used, and check the box in the species column corresponding to the species that use this technology. You may indicate one or both species for each technology.
Methods of Production
Technology Average Flow Rate: GPM if applicable Salmonids, Warm/Cool Water Species, or both (check boxesas apply) Size Unit
Salmonid
Warm/ Cool Water
Still Ponds XXXXXX Surface Acres
Flow Through Ponds XX XXXXXXXX
Flow Through Raceways XX XXXXXXXX
Flow Through Tanks XX XXXXXXXX
Cages XXXXXX Total Volume Cu. Ft.
Net Pens XXXXXX Total Volume Cu. Ft.
Closed Re-Circulation
Tanks XXXXXX Gallons
Other________________ Specify Unit___
3. How many species of Salmonid and Warm/Cool Water fish did you produce/sell in 2007? Total # of Salmonids: _________ Total # of Warm/Cool Water Fish Species: _________
Section B: Sales Information
This section applies both to brokers and to producers. Please tell us about the sales of your Salmonids and your Warm/Cool Water Species. If you do not produce or broker warm/cool water fish, please leave these sections blank. If you do not produce or broker Salmonids, please leave these sections blank.
Salmonids
Size Category Amount
Sales (Dollars)
Trophy size (Over 16”) Pounds Live
Weight $
Catchables (9-16 inches) Pounds Live
Weight $
Sub-Catchables (less than 9 inches) Count $
Forage Minnows Count $
Eggs Count $
Other (Please Specify __________________)
Other (Specify) _________ $
Warm/Cool Water Species
Size Category Amount
(Circle pounds OR count)
Sales (Dollars)
Trophy size (Indicate Size_________________) Pounds
Count $
Catchables (Indicate Size__________________) Pounds
Count $
Sub-Catchables (Indicate Size______________) Pounds
Count $
Forage Minnows Pounds
Count $
Eggs Pounds
Count $
Other (Please Specify __________________)
Other (Specify) _________ $
What percent of your production reported by species in item 1 was sold to each of the following SALES OUTLETS from January 1 through December 31, 2007? Note: The values in each ROW should sum to 100.
To Whom Do You Sell Your Salmonids?
Percent of value of Salmonids sold as:
Brokers/
Consultants Food Fish
Recreational Outlets (Public) Recreational Outlets (Private) Other (specify) _______ Total
Trophy size (Over 16”) % % % % % 100%
Catchables (9-16 inches) % % % % % 100%
Sub-Catchables (less than 9
inches) % % % % % 100%
Forage Minnows % % % % % 100%
Eggs % % % % % 100%
Other (Please Specify
__________________) % % % % % 100%
To Whom Do You Sell Your Warm/Cool Water Fish?
Percent of value of warm/cool water fish sold as:
Brokers/
Consultants Food Fish
Recreational Outlets (Public) Recreational Outlets (Private) Other (specify) __ Total Trophy size (Indicate
Size___) % % % % % 100%
Catchables (Indicate Size___) % % % % % 100%
Sub-Catchables (Indicate
Size___) % % % % % 100%
Forage Minnows % % % % % 100%
Eggs % % % % % 100%
Other (Please Specify
______) % % % % % 100%