Effects of Four Catchment Modifications on Urban Runoff
J.P. Davis1
Graduate Research Assistant, EIT, Member of ASCE; Urban Infrastructure Laboratory, Department of Civil Engineering, Colorado State University, Fort Collins, Colorado 80523-1372; (970)471-2838; email Pauline@engr.colostate.edu
C.A. Rohrer2
Graduate Research Assistant, PE, Member of ASCE; Urban Infrastructure Laboratory, Department of Civil Engineering, Colorado State University, Fort Collins, Colorado 80523-1372; (970)471-2838; email Christine.Rohrer@colostate.edu
L.A. Roesner3
Professor, PhD, PE, Fellow of ASCE; Urban Infrastructure Laboratory, Department of Civil Engineering, Colorado State University, Fort Collins, Colorado 80523-1372; (970)471-7430; email Larry.Roesner@colostate.edu
Abstract. Urbanization often produces detrimental impacts on receiving stream ecology due to an increased volume and velocity of storm runoff. The hydrologic effects of urbanization, including: increases in bankfull events, increased flooding, increased peak flows, decreased baseflow, stream enlargement, stream incision, severe stream bank erosion, sedimentation, changes in morphology, increased instream sediment load, increased sediment transport, aesthetic degradation, degradation of designated uses, and loss of fish populations.
The purpose of this study is to determine how different physical
characteristics of a watershed affect the peak discharges of runoff events produced by fifty years of continuously modeled precipitation. The Runoff and Statistical Blocks of the EPA Stormwater Management Model (SWMM4.4h) and rainfall from three climatically different cities were used to generate flow frequency curves that illustrate changes in subcatchment imperviousness, slope, runoff length, and Horton infiltration parameters. Historical rainfall hyetograph information for Fort Collins, Colorado; Atlanta, Georgia; and Seattle, Washington were used to determine the effects of different rainfall patterns in three subcatchments ranging from 6 to 10 Hectares.
Results indicate urbanization has the greatest impact on the peak discharge of catchment runoff and caused all flow frequency curves in all three cities modeled to shift upward. While changes in slope, runoff length, and infiltration produced no alteration in runoff magnitude and frequency for some storms (seen through the convergence of the flow frequency curves), the impact of urbanization on the frequency and magnitude of runoff events was apparent in all scenarios run. As the level of urbanization changed, some response was always visible, no matter how the three other variables were altered.
1.
Introduction
Increases in catchment urbanization create detrimental impacts to the receiving stream ecosystems through alterations in the river’s natural flow regime (Poff et al, 1997). Alterations to the five critical components of the natural flow regime—magnitude, frequency, duration, timing, and rate of change—through human impacts decrease native species’ variation and
promote the propagation of non-native generalist species. Landuse change, especially urbanization, alters the magnitude and frequencies of high and low flows, causing physiological stress to species adapted to the altered natural conditions (Poff et al., 1997). The EPA-SWMM 4.4 model was used in this investigation to determine the general affects urbanization produces on the magnitude and frequency of discharge from three catchments with three regional patterns of rainfall.
The Runoff and Statistics blocks of SWMM were used to determine the affects of catchment urbanization, slope, width, and soil composition on the peak discharge of watershed runoff. Fifty years of historical rainfall data from three cities – Atlanta, Fort Collins, and Seattle – were incorporated to account for climate variations; these data originated from the National Oceanic and Atmospheric Administration (NOAA) website. This was done to determine how alterations in the model catchment affect the runoff flow frequency curves. This is important because the flow frequency curves generated
illustrate general trends of how different regions and physical characteristics of a watershed affect peak runoff discharge. It is also valuable because less money and effort can be directed toward obtaining data that does not significantly affect the output of the SWMM model.
2.
Methods
The effects of catchment modifications on the resulting flow frequency curves were investigated using a single catchment and precipitation data from three different cities. The model catchment was composed of three
subcatchments and subjected to recorded rainfall patterns from Atlanta, Georgia; Fort Collins, Colorado; and Seattle, Washington.
The general process of this investigation included the following steps. (1) Select catchment parameters were changed in the Runoff input file and read into the Runoff Block of the EPA SWMM model. (2) The interface file output from the Runoff block was then input into the Statistics block of the model. (3) Data output from the Statistics block were used to calculate the return periods and peak discharges of all runoff events. (4) Runoff exceedances and flow frequency curves were produced for the catchment. (5) The flow
frequency curves were then analyzed to determine what physical changes in the watershed produced what curve features.
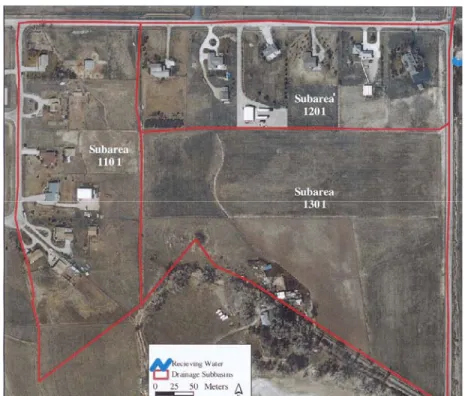
2.1 Model Catchment
The model catchment used was composed of three subcatchments of 6.47, 5.67, and 9.96 Hectares. This catchment was modeled from an existing subwatershed located in the Fossil Creek watershed south of Fort Collins, Colorado. Currently, the land use in the area consists of 12.1 Hectares of low-density residential development and 10.1 Hectares of pasture land (Rohrer, 2004). An illustration of this catchment and its subcatchments appears in Figure 1.
Although located in Fort Collins, Colorado, the catchment describe above was used in the Atlanta and Seattle simulations as well. The original
areas of the model watershed, its Manning’s roughness, and depression storage were held constant throughout the study. The SWMM model allows two values each for Manning’s roughness and depression storage: one for the pervious areas and one for the impervious areas. The Manning’s value for the pervious areas in this model was 0.25 and the value for the impervious areas was 0.016. Values for depression storage were 7.62-mm for the pervious areas and 2.54-mm for the impervious. Channels, pipes and flood control devices were not considered in this study.
Figure 1. Model Catchment 2.2 Catchment Modifications
Four types of catchment modifications were evaluated: imperviousness, slope, width, and infiltration. When one of these parameters was altered, the others were retained at their original values. The one exception to this was the percent imperviousness of the catchment. Catchment imperviousness was changed from the original values to 5%, 20%, and 40% to represent the effects of urbanization. These changes in imperviousness were applied to the slope, width, and infiltration scenarios.
Modifications in catchment imperviousness were used to simulate urbanization of the watershed. Catchment imperviousness is also known as percent imperviousness and denoted as WW (3) in the SWMM 4.4 Runoff input file. Values of 10, 20, 30, 40, 50, 60, 70, 80, and 90 percent
imperviousness were modeled and their affects demonstrated through flow frequency curves. The original percent imperviousness for the subcatchments 1101, 1201, and 1301 were 13.1, 14.0, and 5.0 respectively.
Catchment slope is a measurement of the increase or decrease in ground elevation within the catchment. Slopes considered were 0.01, 0.04, 0.08, 0.12, 0.16, 0.20, 0.24, 0.28, and 0.32-m/m. When one of the other four parameters was altered the slopes of the subcatchments were retained at their original values of 0.015 for subcatchment 1101, 0.013 for subcatchment 1201, and 0.019 for subcatchment 1301.
The width of the subcatchments refers to the length of the
subcatchment side perpendicular to the direction of flow of the runoff (Figure 2).
Figure 2. Subcatchment Width
In SWMM all subcatchments are modeled as rectangles (Huber, 1998). Subcatchment areas were held constant during this part of the simulation and the results are documented based on a width to length ratio of the
subcatchment. Width/length ratios considered for each subcatchment were 0.1, 0.5, 1, 1.5, 2, 2.5, 3, 3.5, and 4. The widths entered into the SWMM model were determined from the equation below. This equation was derived from the area of a rectangle and the width to length ratio.
rA w= Where, w = width, m A = subcatchment area, m2 r = width/length ratio
Catchment infiltration was modeled using the Horton infiltration method of the EPA-SWMM Runoff Block. The general form of Horton’s Equation appears below (James, 2000). The EPA-SWMM model in its infiltration calculations used an integral form of this expression.
kt c o c f f e f f = + − − ) ( Where:
f = infiltration capacity into the soil, mm/sec
fc = minimum or ultimate value of f (at t = ∞), mm/sec
fo = maximum or initial value of f (at t = 0), mm/sec
t = time from beginning of storm, sec k = decay coefficient, sec-1
All three subcatchments were modeled with homogenous soil content for each simulation. The soils considered were alphalpha loamy sand, carnegie sandy loam, dothan loamy sand, fuquay pebbly loamy sand, leefield loamy sand, and tooup sand. The infiltration capacity variables of each soil are listed in Table 1. These values were converted from data summarized by Bedient and Huber (1992.)
Table 1: Infiltration Capacity Values for Soils
SOIL TYPE fc fo k
(mm/hr) (mm/hr) (hr-1)
Alphalpha loamy sand 35.6 482.6 0.010636
Carnegie sandy loam 45.0 375.2 0.005456
Dothan loamy sand 66.8 88.1 0.000389
Fuquay pebbly loamy sand 61.5 158.5 0.001306
Leefield loamy sand 43.9 288.0 0.002139
Tooup sand 45.7 584.5 0.009086
3. Results and Discussion
3.1 Change in Percent Imperviousness
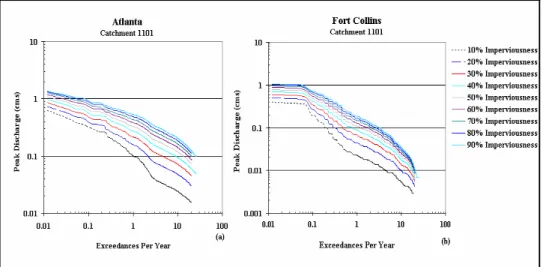
An increase in the percent imperviousness of the catchment resulted in four main changes in the flow frequency curve: (1) an upward shift, (2) a “smoothing out” of the curve, (3) a decrease in the space between the curves, and (4) a decrease in the curve slope. These trends are illustrated in Figures 3a and 3b for the Atlanta and Fort Collins subcatchment 1101. Although only subcatchment 1101 is shown all subcatchments for these two cities depict similar results. This is true for changes in slope, width, and infiltration values unless otherwise stated.
Figure 3. Changes in Percent Imperviousness
The upward shift in the flow frequency curve resulted from an increase in peak discharge from the catchment. This runoff increase was attributed to an increase in hydraulically connected imperviousness surfaces in the
catchment. The increase in the hydraulically connected imperviousness surfaces of the catchment increased the peak discharge of runoff by reducing infiltration and storage and providing a channel of a smaller Manning’s roughness (0.016 opposed to 0.25) to convey the flow.
The roughness (small bumps) of the flow frequency curve is due mainly to the rainfall pattern. This is supported through the comparison of Figures 4, 6, and 9. In all these figures the general shape of each city’s curves were retained. Fort Collins’ curves were always rougher in appearance than Atlanta’s, and Atlanta’s were always rougher in appearance than Seattle’s.
An increase in percent imperviousness resulted in a decrease in the curve separation. This decrease in curve separation indicates the effect of urbanization on the peak discharge decreases as urbanization increases. A decrease in the slope of the flow frequency curve resulted from the peak discharges of the smaller, more frequent storms becoming more similar to the peak discharges of the larger, less frequent storms. This was due to the loss of pervious surface to capture runoff.
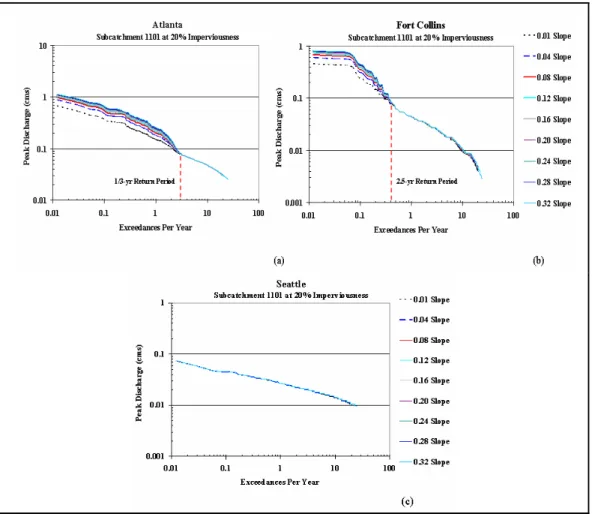
3.2 Changes in Catchment Slope
Variation in catchment slope resulted in four main findings. First, points of convergence were observed at 3 exceedances per year for Atlanta (Figure 4a) and 0.4 exceedances per year (2.5-yr return period) for Fort Collins (Figure 4b). The larger runoff events have the most divergence while the smaller, more frequent events converge and overlap; this indicates changes in slope are more important when dealing with large runoff events opposed to small events. This appears to hold for all percent imperiousness cases tested (5%, 20%, and 40%).
Figure 4. Change in Catchment Slope, 20% Imperviousness
The second finding was that as the catchments urbanized (from 5% to 40%), the curve separation decreased as the catchment slope increased (Figure 5). This indicates that an increase in percent imperviousness reduces the effects of catchment slope on modeled runoff. Increases in percent
imperviousness also resulted in a second point of divergence for catchments 1101 and 1301 for Fort Collins. This begins to appear in the 20%
imperviousness case with the divergence of the 0.01 slope curve at around 5 exceedances per year and becomes more apparent at 40% catchment
imperviousness. Finally, the flow frequency curves for this scenario did not “smooth out” like the percent imperviousness results but retained their shapes when the catchment percent imperviousness was held constant. This reinforces the prediction that the decrease in curve roughness is due to an increase in hydraulically connected impervious surfaces.
Unlike the Atlanta and Fort Collin’s cases, Seattle’s curves were the least affected by all four catchment modifications tested. In this scenario, Seattle’s curves shift up but overlap; this indicates that changes in
subcatchment slope have little to no affect on the rate of runoff produced by Seattle’s rainfall.
Figure 5. Decrease in Response to Slope Change with an Increase in Percent Imperviousness for Fort Collins
3.3 Changes in Subcatchment Width
Variation in subcatchment width resulted in three main observations, many similar to those found in the slope scenario. First, a point of
convergence was observed at 2.5 exceedances per year for Atlanta (Figure 6a) and 0.4 exceedances per year (2.5-yr return period) for Fort Collins. This means that runoff produced by smaller, more frequent storms are not sensitive to changes in subcatchment width. Changes in subcatchment widths for Seattle produced nine overlapping curves and no point of convergence, indicating changes in subcatchment width are not sensitive when Atlanta rainfall is considered.
Figure 6. Changes in Subcatchment Width, 20% Imperviousness
Second, for all cases except Seattle, an increase in subcatchment width resulted in a larger peak discharge. This was because an increase in width results in a decrease in runoff length. This decrease in runoff length decreases
the amount of runoff infiltrated into the ground or stored in depressions. The rate at which this peak discharge increases decreases as the width of the subcatchment increases.
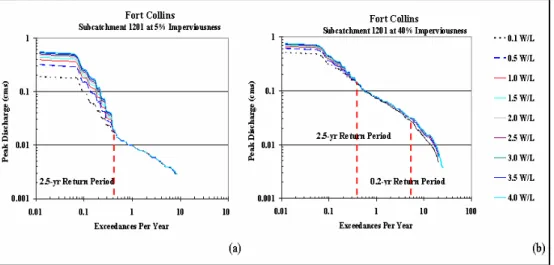
Third, as the percent imperviousness increased, the flow frequency curves became closer (Figure 7) and shift up; this means that the width of the subcatchment becomes less important as the percent imperviousness, or urbanization, of the catchment increases. For Fort Collins, a point of
divergence was observed at 20% imperviousness at about 5 exceedances per year (Figure 7b); as in the variation in catchment slope scenario, this point of divergence became more apparent as the percent imperviousness increased (to 40%).
Figure 7. Changes in Subcatchment Width with Change in Imperviousness 3.4 Changes in Subcatchment Infiltration
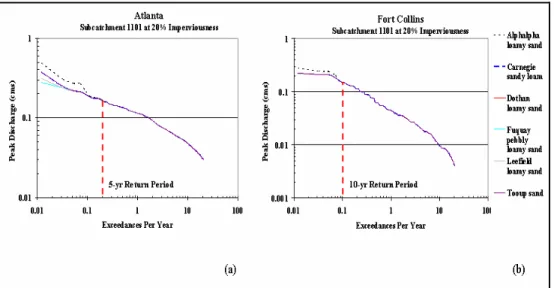
Variation in soil infiltration resulted in three main findings. First, in all cases except Seattle, a point of convergence was observed; this occurred at about 0.2 exceedances per year (5-yr return period) for Atlanta (Figure 8a) and at about 0.1 exceedances per year (10-yr return period) for Fort Collins (Figure 8b). This means variation in catchment soil only affected the larger, less frequent runoff events.
Second, of all the soils tested the alphalpha loamy sand produced the highest peak discharges. This was surprising, given its high initial infiltration capacity (482.6-mm/hr) but was due to its quick rate of saturation. This is illustrated by considering the area under its infiltration curve (Figure 9). The area under the infiltration curve for a given time period represents the water depth infiltrated by the soil during that time (Viessman, 1995). Compared to the other infiltration curve areas, alphalpha’s becomes one of the smallest for time intervals greater than 6 minutes (0.1-hr).
Figure 8: Changes in Infiltration for Atlanta and Fort Collins, 20% Imperviousness
Figure 9. Infiltration Capacity of Modeled Soils
An increase in percent imperviousness again resulted in a decrease in separation between the flow frequency curves. This means that as urbanization increases, the affects of infiltration decrease due to the presence of pavement (Figure 10).
Figure 10: Changes in Infiltration and Imperviousness for Fort Collins
4. Conclusions
Results from the modification of subcatchment imperviousness, slope, width, and infiltration indicate that changes in catchment imperviousness result in the greatest response in runoff. An increase in catchment percent imperviousness was seen to affect the runoff of small, more frequent runoff events while variation in the other three parameters (slope, width, and infiltration) affected mainly the larger, less frequent runoff events. In three of the four
modifications, a point of convergence was found after which variation in the tested parameter (slope, width, and infiltration) no longer affected the runoff from the catchment. These points of convergence were 3 exceedances per year for Atlanta and 0.4 exceedances per year for Fort Collins in the slope scenario, 2.5 exceedances per year for Atlanta and 0.4 exceedances per year for Fort Collins in the width scenario, and 0.2 exceedances per year for Atlanta and 0.1 exceedances per year for Fort Collins in the infiltration scenario. In all
scenarios considered, however, a change in imperviousness resulted in a decrease in the affects of the tested parameters. This indicates that
urbanization has the greatest impact on catchment runoff for all frequencies and sizes of storms for most rainfall patterns.
References
Bedient, P. and Huber, W. (1992). Hydrology and Floodplain Analysis. New York: Addison-Wesley Publishing Company.
Huber, W.C. and R.E. Dickinson (1998). Storm Water Management Model User’s Manual. Version 4.4, EPA/600/3?88/001a (NTIS PB88?236641/AS),
Environmental Protection Agency, Athans, GA.
James, W. and James C. (1998). Hydrology: User’s Guide to SWMM 4.4 RUNOFF and supporting models. Ontario: CHI.
Poff, N., Allan, J., Bain, M., Karr, J., Prestegaard, K., Richter, B., Sparks, R., Stromberg, J (1997). “The Natural Flow Regime: A Paradigm of River Conservation and Restoration. BioScience, Vol. 47, No. 11 (Dec., 1997), 769-784.
Rohrer, C.A., L.A. Roesner, and B.P. Bledsoe (2004). The Effect of Stormwater Controls on Sediment Transport in Urban Streams. In: Critical Transitions in Water and Environmental Resources Management. World Water and
Environmental Resources Conference – 2004, Salt Lake City, Utah, G. Sehlke, D.F. Hayes and D.K. Stevens (Editors). American Society of Civil Engineers, Salt Lake City, Utah, pp. 1-13.
Viessman, W. and Lewis, G. (1995). Introduction to Hydrology. New York: Addison-Wesley Publishing Company.