Faculty of Technology and Society Computer Engineering
Bachelor Thesis
A machine learning approach to enhance the privacy of
customers
En maskininärningsmetod för ökad kundintegritet.
Jesper Anderberg
Nazdar Fathullah
Exam: Bachelor of Computer Science in Engineering in Computer Science 180 hp Area: Computer Science
Date for examination: 2019-05-28
Superviser: Blerim Emruli Examinator: Radu-Casian Mi-hailescu
Abstract
During a phone call between a customer and a representative for a company, various amount of information is exchanged. Everything from a customer’s name, identification number, and home address, to weather conversations and more generic subjects. Companies knowl-edge about their customers are a vital part of their business. Therefore, a need to analyze the conversation in the form of transcripts might be necessary to develop and improve the overall customer service within a company. However, with new legislation like GDPR, special considerations must be taken into account when storing personal information. In this paper we will examine, by using two machine learning algorithms, the possibilities of classifying data from a transcribed phone call, to leave out sensitive information. The machine learning model is built by following an iterative system development method. By using the Naive Bayes and Support Vector Machine algorithms, classification of sensitive data, such a persons name and location, is conducted. Evaluation methods like 10-fold cross-validation, learning curve, classification report, and ROC curve are used to evalu-ating the system. The results show that the algorithm achieved a higher accuracy when the dataset contains more data samples, compared to a dataset with less number of data samples. Furthermore, by pre-processing the data, the accuracy of the machine learning models increased.
Sammanfattning
Under ett telefonsamtal mellan en kund och en representant för ett företag utbyts en mängd information. Allt från en kunds namn, identifikationsnummer, hemadress till väderkonver-sationer och mer vardagliga ämnen. Kunskap om sin kundbas är en viktig del av ett företags verksamhet. Det finns därför ett behov av att analysera samtalet mellan kund och företag, för att utveckla och förbättra den övergripande kundservicen och kundkännedomen. Med nya lagstiftningar som GDPR måste dock särskild hänsyn tas vid lagring av personlig in-formation.
I detta arbete, undersöker vi möjligheterna att klassificera data från ett transkriberat röst-samtal med hjälp av två maskininlärnings algoritmer, för att utelämna känslig information. En maskininlärningsmodell implementeras med hjälp av en iterativ systemutvecklingsme-tod. Genom att tillämpa Naive Bayes och Support Vector Machine algoritmer klassificeras känslig data såsom en persons namn och plats. Utvärderingsmetoderna 10-fold cross-validation, learning curve, classification rapport, och ROC kurva används för att utvärdera systemet. Resultaten visar hur algoritmen når en hög noggrannhet när datasetet innehåller fler datapunkter jämfört med ett dataset med färre antal datapunkter. Slutligen, genom att pre-processera datan ökar algoritmernas noggrannhet.
Acknowledgements
We would like to thank our supervisor Blerim Emruli for his support, knowledge, and positive feedback throughout the thesis. Furthermore, we would like to thank our teacher Magnus Krampell for always taking the time to answer questions and give new perspective on our ideas. Last but not least, we would like to express our gratitude to Brandon Jones and Henrik Dalin at IBM Malmö for their support and contributions during the process of this thesis.
Glossary
Speech to text: Is a process that takes the content of an audio file and transcribes it into written text.
GDPR: General Data Protection Regulation is an EU-law that aims at giving users more power over their data and at the same time force companies to be more transparent of how they handle user data.
Big data: Large data sets that can be analyzed computationally to reveal trends, pat-terns, and associations, especially relating to human behaviour and interactions.
Contents
1 Introduction 1 1.1 Background . . . 1 1.2 Research purpose . . . 1 1.3 Research questions . . . 2 1.4 Limitations . . . 2 1.5 System requirements . . . 2 2 Technical Background 3 2.1 Machine learning . . . 32.1.1 Training and test data . . . 3
2.1.2 Over and underfitting . . . 3
2.2 Machine learning algorithms . . . 4
2.2.1 Support Vector Machine - SVM . . . 4
2.2.2 Naive Bayes Classification Algorithm . . . 5
2.3 Natural Language Processing - NLP . . . 5
2.3.1 Tokenization . . . 6
2.3.2 Term Frequency–Inverse Document Frequency (TF-IDF) . . . 6
2.3.3 N-gram . . . 6 2.4 Validation . . . 6 2.4.1 10-fold cross-validation . . . 6 2.4.2 Learning curve . . . 7 2.4.3 AUC-ROC curve . . . 8 3 Related work 9 3.1 Privacy Issues and Data Protection in Big Data: A Case Study Analysis under GDPR . . . 9
3.2 Automated Big Security Text pruning and Classification . . . 9
3.3 Text Categorization with Support Vector Machines: Learning with Many Relevant Features . . . 10
3.4 Sentiment analysis of IMDb movie reviews . . . 10
3.5 Application of Text Mining for classification of Community Complaints and Proposals . . . 11
4 Method 12 4.1 Nunamaker and Chen . . . 12
4.1.1 Construct a conceptual framework . . . 12
4.1.2 Develop a system architecture . . . 13
4.1.3 Analyze and design the system . . . 13
4.1.4 Build the system . . . 13
4.1.5 Observe and evaluate the system . . . 13
5 Results 14 5.1 Construct a conceptual framework . . . 14
5.1.1 Problem tree . . . 14
5.1.3 Machine learning model . . . 15
5.1.4 Evaluation . . . 15
5.1.5 Literature study . . . 16
5.2 Develop a system architecture . . . 17
5.2.1 Dataset . . . 18
5.2.2 Machine learning model . . . 18
5.2.3 Evaluate model . . . 18
5.3 Analyze and design the system . . . 18
5.3.1 Machine learning work flow . . . 18
5.3.2 Collect data . . . 19
5.3.3 Analyze data . . . 19
5.3.4 Pre-processing data . . . 19
5.3.5 Split the data . . . 20
5.3.6 Train the model . . . 20
5.3.7 Evaluate model . . . 20
5.4 Build the system . . . 20
5.4.1 Collect data . . . 20
5.4.2 Analyze data . . . 21
5.4.3 Pre-processing data . . . 22
5.4.4 Split data . . . 23
5.4.5 Train model . . . 24
5.5 Observe and evaluate the system . . . 24
5.5.1 Cross-validation . . . 24 5.5.2 Learning curve . . . 24 5.5.3 Classification report . . . 25 5.5.4 AUC-ROC curve . . . 26 5.5.5 Pre-processing accuracy . . . 26 6 Discussion 28 6.1 Method discussion . . . 28 6.2 Related work . . . 28 6.3 Analysis of result . . . 29 7 Conclusion 30 7.1 Future work . . . 30 References 31 Appendix 34
1
Introduction
This chapter presents the background of the problem area, the purpose of the thesis, research questions, limitations, and system requirements.
1.1 Background
With the amount of unstructured data steadily increasing, classifying methods is a contin-ually emerging area of research [1]. Significant progress has been made in the area over the past decade, due to the development and improvement of machine learning, deep learning, and neural networks [2].
By using various classification methods, it is possible to examine vast quantities of data to predict certain behavior and characteristics. It is especially valuable for companies when trying to understand how their customers relate to their products or services[3].
However, as recent polls show [4], more and more people are aware that an increasing amount of their private data is being collected, but few know how it is used [3].
Consequently, new regulations like GDPR (General Data Protection Regulation) promul-gated by the EU, requires more consideration taken by companies when handling user data. EU has set up rules for what is called an identifiable natural person. Meaning, someone who can be identified, directly or indirectly, in particular by reference to an identifier such as a name, an identification number, location, etc. Companies are obligated to comply with regulations like GDPR to prevent their stored data from being used to identify persons. However, it has been shown that even though companies comply with GDPR and the col-lected data cannot individuate someone, combining it with other external data, it is still possible to identify a person [5].
In the wake of scandals like 1177-Vårdguiden in Sweden [6][7], private information from millions of customer calls to the 1177 medical help center was made publicly available. Therefore, it is necessary to find new methods of classifying sensitive data to prevent data mining of private information [3].
In this thesis, we propose a method of categorizing sensitive user data from a transcribed phone call in ways that will enhance a customers privacy, and at the same time give com-panies enough data to be able to evaluate the needs of their customers.
1.2 Research purpose
Much research has been done in the area of text classification, but it is mostly limited to analyzing large number of unstructured documents. As a part of an assignment by IBM, the purpose of this thesis is to examine the possibilities of categorizing data in a transcribed phone call in order to leave out sensitive information. By creating a dataset with two classes, labeled as either sensitive or non-sensitive, the dataset will act as a foundation of which the machine learning models will be trained on.
1.3 Research questions
The research aim of this thesis is to categorize data from a transcribed phone call by implementing a machine learning model. The developed machine learning model and classification method will provide information that can be used to answer the following research questions:
RQ1: How can data be categorized to distinguish sensitive data from non-sensitive data from a transcribed phone call?
RQ1.2: How will the use of data pre-processing affect the accuracy of the machine learning model?
RQ1.3: What is the risk that sensitive data gets classified as non-sensitive data?
1.4 Limitations
L1: The system will not include functions that will transcribe the phone call.
L2: The machine learning model will only be trained using the English language.
L3: We will limit ourselves to identify two types of identifiers as specified by GDPR. These are the name of individuals and geographic locations mentioned in the conversation, e.g. cities or countries.
L4: The dataset will not exceed 500 samples per class.
1.5 System requirements
The system requirements are provided by us and IBM to get an overview of the problem. The requirements are presented below:
SR1: The classification will occur on a transcribed phone call
SR2: The accuracy of Naive Bayes model should exceed 80%.
2
Technical Background
2.1 Machine learning
Machine learning is the concept of learning from given examples and experiences [8]. In-stead of writing complex programs for specific problems, providing data to an algorithm, computers can make logical predictions based on the given data. For an algorithm to make such predictions, there is a necessity of providing the algorithm with both training data and test data. The algorithm is then used to train a machine learning model.
2.1.1 Training and test data
One of the challenges of building a machine learning model is to provide it with correct data. The data consist of two types of data sets: training and testing.
Training data is used to train the model into predicting the correct outcome.
Test data is acting as a verifying tool at the end of the development process. The model will give an estimated percentage of how well the machine learning model recognizes a random test sampling. Furthermore, the data that is provided should be aligned with the problem that needs to be solved [9]. Figure 1 shows a visualization of the development process, from the preparation of data to the creation of a finished model.
Figure 1: The workflow of a machine learning process [10].
2.1.2 Over and underfitting
The goal with a machine learning model is to be able to generalize from training data, and apply predictions to new data in the same problem domain. Overfitting and underfitting is the main reason for a poor performance of a machine learning algorithm [11]. Overfitting refers to a model that, instead of learning from the training data, recognizes the pattern of the training data. This is usually caused by having a large dataset that is too complex to fit the model. The characteristic of an overfitted model is that the training score is relatively high, while the validation score is relatively low [12]. Underfitting, on the other hand, refers to a model that can not generalize to the training data, nor new data. This is usually caused by a too small dataset. The characteristic of an underfitted model is that the training score decreases, while the validation score is relatively high [12].
2.2 Machine learning algorithms
There are numerous machine learning algorithms to choose from, depending on the prob-lem. In this chapter, two machine learning algorithms are presented that are commonly used for text classification.
2.2.1 Support Vector Machine - SVM
Support Vector Machine is a supervised machine learning algorithm that can be used for text classification. The objective of the algorithm is to determine the best decision boundary between vectors that belong to different categories of data. Vectors are lists of numbers which represent a set of coordinates in some space [13]. When SVM determines the decision boundary, it decides where to draw the best lines, which divides the space into two subspaces. These subspaces are also referred to as categories.
In Figure 2 below, the circles represent training data which represents the pricing of a product. The triangles represent training data which does not describe the pricing of a product.
Figure 2: Representations of training texts [13].
Figure 3 below shows the best decision boundary to separate data containing pricing of a product and not containing the pricing of a product. The hyperplane divides the data into different categories.
Figure 3: The suggested decision boundary [13].
2.2.2 Naive Bayes Classification Algorithm
Naive Bayes is a simple and powerful machine learning algorithms, most commonly used for text classification. The algorithm is based on Bayes’ Theorem which describes the probability of an event happening based on prior knowledge that a second event has oc-curred[14].
The Naive Bayes algorithm takes the probability of each attribute belonging to a class to make a prediction. To make that prediction, as shown in section 1, the first step is to cal-culate the probability of A happening if B is true. Furthermore, P (B|A) is the likelihood of B happening if A is true. P (B) and P (A) are the probability of observing independently of one and another. By using Naive Bayes theorem, it is possible to get an estimated value of a word belonging to a specific class [15].
P (A|B) = P (B|A)P (A)
P (B) (1)
2.3 Natural Language Processing - NLP
Computers do a great job at analyzing structured data, like financial records and database tables [16]. However, the human language ambiguity is a pervasive phenomenon [17]. Hu-mans communicate in an unstructured manner, which is more complex for computers to understand. Therefore, to make use of a transcribed conversation, there needs to be a way for computers to understand the actual meaning of the words in a sentence.
While speech recognition addresses the analysis of an acoustic signal, natural language pro-cessing research is more concerned with the actual semantic representation of the words, once recognized [18].
2.3.1 Tokenization
Tokenization is a process of taking a text and breaking it up into individual words, called tokens. Tokens are used as input for other tasks. Below is an example that demonstrates the process.
The input is: [Friends, Romans, Countrymen, lend me your ears];
The output after tokenization will be: [’Friends’, ’Romans’, ’Countrymen’, ’lend’, ’me’, ’your’, ’ears’] [19].
2.3.2 Term Frequency–Inverse Document Frequency (TF-IDF)
TF-IDF is a numerical statistic uses to reflect how important a word is for the document. Term frequency is the ratio of the number of times a word appears in a document compared to the total number of words in the document [20], equation 2 below shows the calculation. tfi,j = ni,j P kni,j (2)
Inverse document frequency is used to calculate the weight of unique words in all documents. Rarely occurring words have a high IDF score [20]. The calculation of IDF can occur by using equation 3 below.
idf (w) = log(N dfi
) (3)
To calculate TF-IDF score the combining of the two equations above is required [20]. Equation 4 below shows this combining.
wi,j = tfi,j∗ log(
N dfi
) (4)
tfi,j =number of occurrences of i in j
dfi =number of documents containing i
N =total number of documents
2.3.3 N-gram
N-gram is a sequence of n-words in a row from a given sequence. It is important for modeling a text before using it[21].
E.g. the sentence "I am Smith" is a 3-grams, after converting it to 2-grams it will be "I am" and "am Smith".
2.4 Validation
2.4.1 10-fold cross-validation
10-fold cross-validation is a method which divides the dataset randomly into 10 folds as shown in Figure 4. Nine parts of the data are used for training the model and one part
used for the testing. By repeating the process 10-times the learning process is executed 10-times on the different parts of the training data, and each part is used only one time for the testing [22].
Figure 4: 10-fold cross-validation procedure [23].
2.4.2 Learning curve
A learning curve is a graph that compares the performance of a model for training and testing of data over a different number of training objects [24]. Learning curve displays the training and validation score of an estimator for variable numbers of training data. Furthermore, the learning curve is used to find a threshold, where it is no longer beneficial to add more data. If both the training score and validation score gives a low accuracy score value when increasing the size of the training set, it will not be beneficial to add more training data [25].
Classification report
Classification report is used to display the precision, recall, and F1-score for the model[26]. Before explaining these terms, the symbols below are explained.
• TN: the prediction is negative and the actual value is negative. • FN: the prediction is negative while the actual value is positive. • FP: the prediction is positive while the actual value is negative. • TP: the prediction is positive and the actual value is positive.
Precision is the ratio of the total number of correctly classified true positives divided by the total number of true positives and false positives [27], see equation 5 below.
P recision = T P
T P + F P (5)
Recall is the ratio of the total number of correctly classified true positives divided by the total number of true positives and false negatives [27], see equation 6 below.
Recall = T P
F1-score is the balance between precision and recall [27], see equation 7 below.
F 1 − score = 2 ∗ P recision ∗ Recall
P recision + Recall (7) Accuracy is a classification ratio of all correctly classified data in the whole test set. It can be calculated by the equation 8 below.
Accuracy = T P + T N
T P + T N + F P + F N (8)
2.4.3 AUC-ROC curve
AUC-ROC (Area Under The Curve - Receiver Operating Characteristics) is a measurement technique used for binary classification to determine of how well a classifier can distinguish between classes at various threshold settings [28]. The higher the AUC rate is, the better the model is predicting the different classes. To plot a ROC curve, the calculations of TPR (True positive rate) and FPR (False positive rate) are used[28], see equations 9 and 10.
T P R = T P
T P + F N (9)
F P R = F P
3
Related work
3.1 Privacy Issues and Data Protection in Big Data: A Case Study Analysis under GDPR
While big data has become an asset for many companies and organizations to expand their markets, access to sensitive data has increased. Nils Gruschka et al. [3] present a case study of two somewhat different research projects dealing with sensitive data while trying to comply with the data regulatory laws.
The purpose of the article is to identify and analyze how data can be treated under the GDPR. The report also examines how data mining is affected in the context of private information.
In the first case, the authors collected biometric samples from 200 people. According to Clause 1 or Article 9 of GDPR, biometric data is considered a "special category of personal data." Therefore, specific actions were taken to comply with the law, to ensure the privacy of the participants.
In the second case, an anonymization process to divide the attributes of a data set was carried out. The reason for this was to categorize individual characteristics in a way that it would not be possible to identify a person.
In the related work section, they mainly refer to old well-known methods of privacy-preserving data mining. The result of the study shows that in the first case, where the participants only gave consent, they faced no problems during the data mining phase. In the second case, the anonymization of many data sets is a requirement. Here, Nils Gruschka et al. could show that the data analysis was much more challenging and in many cases limited.
Comments
This case study is relevant to us because the authors describe methods of handling sensitive user data and at the same time complying with GDPR.
3.2 Automated Big Security Text pruning and Classification
Alzhrani. K et al. [29] developed a machine learning algorithm with a classification system to evaluate the sensitivity level of documents from the WikiLeaks organization.
They discuss methods of analyzing text documents, and the advantages of breaking them down in different levels of security categories. In this paper, the authors classified each paragraph of the document into varying levels of security.
The related work mainly refers to an article that has developed a system of similar charac-ter. Other related work has the same approach but is using artificial sensitive documents from which no real conclusions could be made.
The result shows that, by applying machine learning on big sets of unstructured data, they can predict future security classes. Text pruning, which is a way of reducing un-necessary words and information in a text, is proposed to increase the accuracy of the topic classification, even though never implemented they argue that it can have significant advantages.
Comments
This paper is valuable to our research since it describes a method of breaking down a large number of unstructured text documents, into different types of security levels. While the authors limited themselves to classifying documents by the paragraphs, we are interested in classifying every sentence. Furthermore, the result show that by using text pruning, the accuracy of the classification algorithm can increase.
3.3 Text Categorization with Support Vector Machines: Learning with Many Relevant Features
Thorsten Joachims [30] explains the use of Support Vector Machines (SVM) for learning text classification. The purpose of the article is to analyze the properties of a learning method with text data and to identify why SVM is suitable for text classification.
According to the paper, the author assesses that the algorithm is a useful method for classification because of its ability to: generalize in feature spaces, avoiding catastrophic failures, and its high durability. The author does not present any related paper which matches the goal of the study.
The results support both theoretical and empirical evidence that SVM is a useful algorithm for text classification.
Comments
This paper contributes to this thesis by showing a method of text classification. Moreover, inferences can help decide which algorithm we can use in this thesis.
3.4 Sentiment analysis of IMDb movie reviews
Alejandro Pelaez et al. [31] present a study of sentiment analysis to classify the movies in an IMDb dataset. The purpose of the study is to examine if it is possible to classify the reviews into positive and negative classes. The supervised classification methods that are used in this study are, Support Vector Machine, Multinomal Bayes, Logistic regression, and Random forests.
According to the study, the authors use NLP to clean up the data before performing the algorithms. By removing noise words from the data, the accuracy of the algorithms can increase. The NLP techniques used are: removal of punctuation’s, removal of capital letters, and vectorization by using TF-IDF. The authors use Cross-validation to evaluate their system. The authors do not mention any related works that can be related to the study.
The result of the research shows an accuracy of about 96% without using TF-IDF and pre-processing, while the accuracy after using them are 98%.
Comments
This paper is useful to this thesis since it uses NLP techniques to clean up the dataset before it will be used. These techniques can also use in the thesis to get an acceptable accuracy. Furthermore, the method used in this study to evaluate the system can be also used in this thesis to evaluate the final result.
3.5 Application of Text Mining for classification of Community Com-plaints and Proposals
I. B. N. Sanditya Hardaya et al. [32] present a method of classifying complaints and propos-als by citizens of Jakarta. A e-participant tool was developed by the Jakarta government with the goal of increasing the involvement of citizens in the planning the Jakarta commu-nity. In 2013 and 2014 the number of complains entered into the e-participant system were over 40000. With the use of SVM, these complaints were classified into different categories like: flooding, transportation, housing and land uses, and education. The study describes ways of pre-processing large documents of text together with TF-IDF vectorization. The result of the thesis shows that the accuracy of 91.37% was a few percentages better with the use of pre-processing than without.
Comments
This study is relevant to us since it describes steps of pre-processing text data as well as the use of TF-IDF. The report also gives us guidance on what results to expect when pre-processing data.
4
Method
The system is developed using the Nunamaker and Chen system development method [33]. A literature study is conducted to increase knowledge in areas related to the classification of data. The literature study is also a part of the Nunamaker and Chen processes of creating a conceptual framework, which is further described in section 5.1. Nunamaker and Chen methodology is used for the implementation and evaluation of the system.
4.1 Nunamaker and Chen
The system implementation is developed using the Nunamaker and Chen system develop-ment method.
The methodology architecture shown in Figure 5 describes the five stages of the building process, from the early stage of research to the final evaluation of the system. The Nuna-maker and Chen method has a clear structure, with an iterative process that makes it suitable for system development[33].
Figure 5: Nunamaker and Chen system development research process [33].
4.1.1 Construct a conceptual framework
Part of the first stage in the process is to find information and increase knowledge related to the research questions RQ1-RQ3 in section 1.3 [33]. Information is collected, and rel-evant literature is studied, as presented in section 5.1.5, to get a clear overview of the problem domain. A helpful approach in identifying and determining what problems need to be solved is the construction of a problem tree.
4.1.2 Develop a system architecture
The second stage of the development process is to create a system architecture. It requires a study about the system requirements and what functionalities are needed. To get a clear view of the relationships between the functionalities, creating a diagram, as shown in Figure 6, is useful for visualization purpose. The result of this process is presented in section 5.2.
Figure 6: The system architecture.
4.1.3 Analyze and design the system
In the third stage of the process, the design of the system is taken into consideration. A blueprint of the design is constructed and built upon both the requirements from IBM which mentioned in section 1.5, as well as from the knowledge we gathered from the literature study. The result of this process is presented in section 5.3.
4.1.4 Build the system
The fourth stage of the process describes how the system should be built using the system architecture as mentioned in section 4.1.2. Thus the system is built to solve the problems shown in Figure 7, the dataset and the classification algorithm are the main parts of the system. The implementation of the prototype is developed based on the requirements mentioned in section 1.5. The result of this process is presented in section 5.4.
4.1.5 Observe and evaluate the system
This stage of the process describes how the system is evaluated based on the testing of the system. The whole system is tested to confirm that it works well without complications. To improve the classification accuracy, NLP is used. To evaluate if the result is reasonable, cross-validation is applied. Furthermore, a classification report is created to confirm the result. Test cases are made to show that the system fulfills the requirements mentioned in section 1.5. The result of this process is presented in section 5.5.
5
Results
In this chapter, we will present the result of our implementation and the process of the method.
5.1 Construct a conceptual framework
5.1.1 Problem tree
A problem tree was initially created to get a better perspective over the problem area. As described in Figure 7 the tree consists of three branches: dataset, machine learning model, and evaluation.
Figure 7: Problem tree for the prototype.
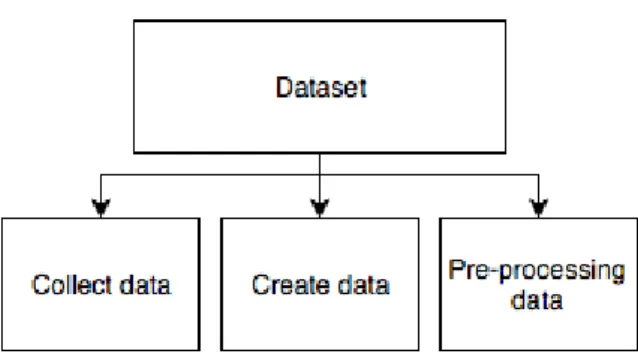
5.1.2 Dataset
Figure 8: Problem tree of the dataset branch.
The dataset has three sub-branches: collect data, create data, and pre-processing data. Collect data is the process of retrieving publicly available datasets. Furthermore, creating data is the process of creating own data samples for a specific purpose, which is not publicly available. Pre-processing data is used to help the algorithm understand the data samples better by making the data more consistent.
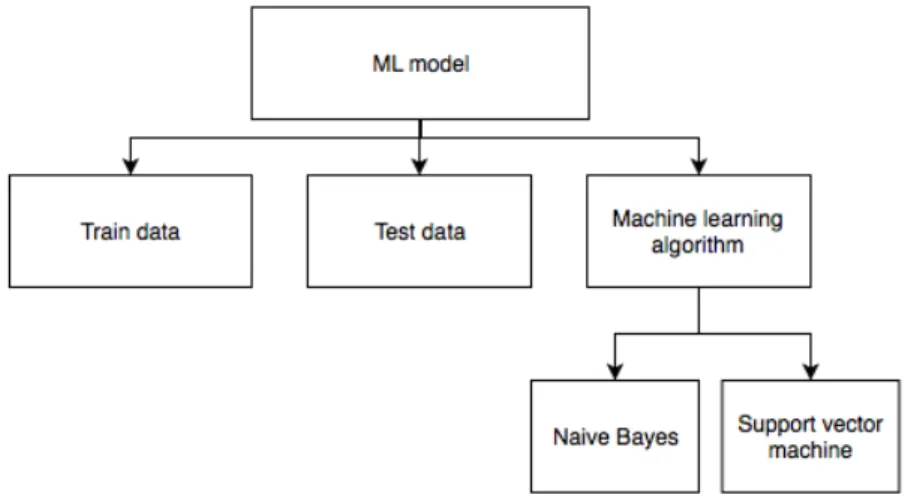
5.1.3 Machine learning model
Figure 9: Problem tree of the machine learning model branch.
The machine learning model branch consists of three sub-branches: training data, test data, and machine learning algorithm. Training data is a certain percentage of the dataset, which is used to train the model. The test data is a part of the dataset, which is initially set aside for testing and evaluating the performance of the model. The test data is only used when the model is completely trained. The machine learning algorithm branch has two sub-branches: Naive Bayes and Support Vector Machine (SVM). The two algorithms have different characteristics when it comes to classifying data. While Naive Bayes uses the probability of an output belongs to a particular class. SVM, on the other hand, tries to find a hyperplane that maximizes the margin between two classes. The reason behind choosing these algorithms came after reading related works. These algorithms have been proven by others to perform well when classifying text data. The algorithms are described more in detail in section 2.2.
5.1.4 Evaluation
Figure 10: Problem tree of the evaluation branch.
The evaluation branch consists of four sub-branches: cross-validation, learning curve, clas-sification report, and ROC curve. Cross-validation, clasclas-sification report, and ROC curve
are all used to validate the performance of the model. A learning curve is used throughout the training phase to verify that adding more data can improve the model.
5.1.5 Literature study
As a means to justify the research question in section 1.3, an approach is to conduct a literature study. The purpose of the literature study is also used to determine if the requirements of the system mentioned in section 1.5 are possible to accomplish in the set time frame. Furthermore, in the context of classifying unstructured data, new ideas and approaches can be captured by studying relevant disciplinarians and the research of previous work. The research areas that are reviewed are Jupyter notebook, Scikit-learn library, pre-processing methods, and nltk-library.
Easily accessed and reliable sources of collecting information are IEEE Explore, ACM digital library, and Google Scholar. By sorting them into categories and relevance, the sources are a useful tool in moving the research process forward.
Jupyter notebook
Jupyter notebook is an opensource web application that lets a user write python code in an easily shared and monitored environment[34]. It is simple to visualize and compile the code line by line to get a better understanding of how the program runs.
Scikit-learn
The machine learning model is developed using the Scikit-learn library for Python pro-gramming language. The library is built upon SciPy (Scientific Python) and includes among others the following libraries:
• Numpy: Multidimensional array package.
• Matplotlib: A comprehensive library used to plot 2D and 3D diagrams.
• Pandas: Data structure and analysis.
Pandas and Numpy
Pandas is a python package that makes analyzing easier on imported datasets. Panda is based on Numpy, which is a library with added support for multidimensional arrays. A simple visualization of a data frame created with pandas can be seen in Figure 11.
Figure 11: A Panda data frame showing what sentiment class a specific text is labeled as.
Natural Language Tool Kit-NLTK
NLTK is a Python package that provides a set of natural language algorithms. This pack-age is open source and easy to use. It contains many useful pre-processing packpack-ages like tokenization, punctuation removal, stop words removal, and word count. NLTK helps the computer to understand, analyze, and pre-process the text samples [35].
5.2 Develop a system architecture
In this section, the system architecture is described. The system consists of three parts: dataset, machine learning model, and evaluating the system. Figure 12 shows an overview of the different parts of the system.
5.2.1 Dataset
The dataset is created by taking publicly available datasets and combining it with self-made data samples. The publicly available dataset is taken from various transcribed TED talk lectures [36]. The self-made data samples are taken from conversational videos found on the internet. Furthermore, the text samples are labeled as either 0 or 1 to create a binary classification dataset. The label 0 represents a sentence that is classified as non-sensitive, while 1 represents a text sentence that is classified as sensitive. Data pre-processing is used to transform raw data into a more understandable format. Raw data is often inconsistent and contains symbols or words that will likely cause unwanted errors. This process is presented in section 5.3. Special preparation is required for text data before building the machine learning model. Feature extraction like N-gram is used together with TF-IDF to encode the words to integer numbers to increase the accuracy of the machine learning algorithm. TF-IDF and N-gram are described more in detail in section 2.3.2 and 2.3.3.
5.2.2 Machine learning model
Splitting the data involves separating the samples into two groups, training, and testing. This process is described more in detail in section 5.3.5. The algorithms used are Naive Bayes and SVM. They are both described more in detail in section 2.2.
5.2.3 Evaluate model
Evaluating the machine learning model is an important step to verify how well the model performs. The evaluation of the model consists of four steps:
• Cross Validation
• Learning Curve
• Classification report
• ROC curve
This step is further explained in section 5.3.7
5.3 Analyze and design the system
This section will describe the preparations before implementing the system. This includes a workflow diagram of all the necessary steps in the development process.
5.3.1 Machine learning work flow
Creating a working flowchart can be an efficient way of showing all the necessary steps taken in the development process. Figure 13 shows the process of developing our machine learning model.
Figure 13: Work flowchart of developing a machine learning model.
5.3.2 Collect data
Collecting the data is the most important and time-consuming part of the system. An excel file with different data samples is suitable for this process. By searching after suitable datasets and examining which way is correct to create a dataset, the data is collected and added to an excel file.
5.3.3 Analyze data
The first step of analyzing the dataset is to make sure that the dataset is well balanced. Two classes are used for that purpose. In our case 0 and 1. 0 represents text samples which are labeled as non-sensitive, while 1 represents text samples labeled as sensitive. If the samples from one class outnumber the samples from the other class, the prediction will most likely be in favor of the over-represented class. An unbalanced dataset is referred to as a dataset with high variance. Consequently, the model performs well on training data but poorly on test data.
5.3.4 Pre-processing data
Pre-processing is an essential part of text classification. Transforming text into something understandable to an algorithm is crucial to avoid misleading predictions by the model. The first step of pre-processing text data is to clean the data. Cleaning the data consists of:
• Converting text to lower case.
• Removing punctuation and unwanted symbols and characters.
• Tokenization.
• Removing stop words.
Text documents often have a variate of capitalization to show the beginning and end of a sentence, or to emphasize a proper noun. By converting all letters to lower case, the text data is more simple for the algorithm to understand [37].
Secondly, by removing punctuation’s, all words are put in on equal footing and allow pro-cessing to proceed uniformly.
sometimes can come in either HTML format or JSON-format, it is a necessity to remove frequently occurring symbols like: > < { } #.
Tokenization is used to divide sentences into words, as described in section 2.3.1.
Stop words are defined as commonly used words in text documents, such as ("the," "is," "and," "in"). These words occur with a high frequency, which generally makes them irrel-evant when classifying text data [38]. Stop words can be filtered out to make room for less frequently used words, that have greater relevance to the classification task.
5.3.5 Split the data
The purpose of splitting the dataset into training and test sets is to overcome problems like over-fitting, where the model is memorizing the pattern of the dataset. Therefore, by separating the training data from the test data for evaluation purpose, it is possible to test the model on never before seen data samples. A standard way of splitting the data is with a 75/25 ratio meaning 75% of the data is used to train the model, while the remaining part, 25%, is used to test the model.
5.3.6 Train the model
Training the model involves providing the machine learning algorithm with data. As mentioned in section 5.2.2, we are using two different algorithms to train the model. Naive Bayes and SVM.
5.3.7 Evaluate model
10-fold cross validation is used as an evaluation technique. By dividing the dataset ran-domly into 10 folds, as described in section 2.4.1, it is possible to avoid overfitting the model.
The accuracy of a machine learning model will generally depend on the size of the dataset [12]. Therefore, an efficient approach is to explore the behavior of the model as a function of the number of training samples [12]. Hence, a learning curve can help make sure the model can support more training data and at the same time, avoid overfitting.
As described in section 2.4.2, a classification report is useful for a better understanding of the performance of the model. Precision, recall, and f1-score are all taken into con-sideration when evaluating the accuracy of the model. Lastly, a ROC curve is created to summarize the performance of the model.
5.4 Build the system
In this section, the process of building the system is explained. The section includes analysis of the dataset, pre-processing, and training the model. The workflow chart, Figure 13, has worked as a road map throughout the whole building process.
5.4.1 Collect data
As mentioned in section 5.2.1, we started by collecting text data samples from publicly available datasets. These were found through Kaggle and UCI machine learning repository.
By combining our findings, with data we created our self by transcribing conversation from audio files found on the internet, we ended up with a dataset consisting of 917 unique samples. These samples were entered into a tabbed excel document with two columns: sentiment and text. The sentiment column consists of two classes represented by either a 0 or a 1. 0 for non-sensitive text samples and 1 for sensitive text samples. In the text column, we put the corresponding text sample. By doing so, we assign every text sample a specific sentiment value. The dataset is then added to a Jupyter Notebook project using Pandas to create a data frame as shown below in Figure 14. The model is implemented using Python programming language.
Figure 14: A Pandas data frame showing the structure of our dataset.
5.4.2 Analyze data
The next step was to analyze the dataset. The purpose of this step is to make sure the dataset well balanced as mentioned in section 5.3.3. As seen in Figure 15, the dataset is balanced, meaning there are almost as many sensitive class samples (458) as there are non-sensitive class samples (459).
5.4.3 Pre-processing data
The first step in pre-processing the data is making sure all letters are converted into lower case. Figure 16 shows the text samples before and after removing all capital letters.
Figure 16: The data frame before and after converting all letters to lower case.
Furthermore, we made sure that all punctuation’s were removed and stripped all un-wanted symbols from the dataset as described in section 5.3.4. The result of this step is show below in Figure 17.
Figure 17: The data frame showing before and after removing punctuation’s.
After removing all punctuation and unwanted symbols from the dataset, we used the NLTK-library to tokenize the data. In this step, we divided the sentence into single words. Figure 18 shows what the dataset looks like after tokenization.
Figure 18: The data frame before and after tokenization.
described in section 5.3.4, stop words are commonly used words that have little significant value to the actual semantic representation of the sentence. The NLTK-library provides an already pre-defined vocabulary of these words. It is also possible to add specific words that we feel are over-represented in our dataset. The diagrams in Figure 19a show the most frequently used words in our dataset before removing stop words. Figure 19b shows the most frequently used words after removing stop words.
(a) Frequently used words before removing stop words.
(b) Frequently used words after removing stop words.
Figure 19
A visualization of the data frame without stop words is shown in Figure 20
Figure 20: The data frame after removal of stop words.
5.4.4 Split data
After pre-processing the dataset, we split the data as described in section 5.3.5. We used a 75/25 ration meaning 75% of the data is used to train the model, and the remaining part, 25%, is used to test the model. The diagram in Figure 21 shows the number of samples per class after splitting the data.
Figure 21
5.4.5 Train model
In this step, we trained the model, using Naive Bayes and SVM, with the data samples from the training set. The results are shown in section 5.5.
5.5 Observe and evaluate the system
This section describes and presents the tests that were conducted on the system to reflect the requirements specified in section 1.5. Test cases and test reports are illustrated in the Appendix; the other parts of the tests are shown in the sections below.
5.5.1 Cross-validation
To better understand the performance of the algorithms, cross-validation is repeated 10-times across different subsets. The mean value of the subset is calculated and are shown below.
Calculation the average of Cross-validation by using Naive Bayes:
(0.88 + 0.88 + 0.79 + 0.84 + 0.90 + 0.83 + 0.89 + 0.80 + 0.85 + 0.87)/10 = 85.72%
Calculation the average of Cross-validation by using SVM:
(0.90 + 0.89 + 0.81 + 0.86 + 0.85 + 0.86 + 0.90 + 0.84 + 0.86 + 0.92)/10 = 87.47%
As shown above, the average of 10 fold Cross-validation for Naive Bayes was 85.72%, while the average with using SVM was 87.47%.
5.5.2 Learning curve
It is essential to comprehend how the model responds to an increasing amount of training data. Therefore, we plotted a learning curve to visualize the behavior of the model. It also helps us to confirm that adding more data samples will avoid over-fitting the model. Figure 22 shows the learning curve for both the Naive Bayes model and the SVM-model. The
horizontal axis represents the amount of training data and the vertical axis the accuracy score of the model.
(a) Learning curve for Naive Bayes at ap-proximately 600 training samples.
(b) Learning curve for SVM at approxi-mately 600 training samples.
Figure 22
As shown in Figure 23 below, we used a larger training set, approximately 800 samples, to train the model to see if there is room for improvement of the accuracy.
(a) Learning curve for Naive Bayes at ap-proximately 800 training samples.
(b) Learning curve for SVM at approxi-mately 800 training samples.
Figure 23
5.5.3 Classification report
Classification report was made to check the quality of the classification algorithm pre-dictions. The report below was generated by using the Naive Bayes algorithm and SVM algorithm on the dataset mentioned above in section 5.2.1. It shows the main classification metrics precision, recall, and f1-score on all classes.
Figure 24: Classification report by using Naive Bayes.
Figure 25: Classification report by using Support Vector Machine.
5.5.4 AUC-ROC curve
AUC-ROC curve is plotted to show the performance of the classifier, and summarize the prediction results, see Figure 26 below. The plot shows the ratio of correctly and incorrectly predicted classes compared with the actual classes in the test data.
Figure 26: The result of ROC curve displaying both the Naive Bayes algorithm and the Support Vector Machine algorithm.
5.5.5 Pre-processing accuracy
The models are evaluated both before and after pre-processing. The test accuracy of the model is presented in Figure 27.
6
Discussion
6.1 Method discussion
As mentioned in section 4.1, the reason for choosing Nunamaker and Chen methodology is because of its iterative nature [33]. Developing machine learning models is primarily based on the ability to collect, train, and evaluate in an iterative environment, as Figure 13 in section 5.3.1 describes. The accuracy of the model tends to increase, if a analysis of the result after every training iteration is taken into consideration.
6.2 Related work
The paper that is most relevant to our thesis regarding the advantages of pre-processing data is Application of Text Mining for classification of Community Complaints and Pro-posals [32]. The result of the thesis shows an increasing accuracy of 1, 46% using pre-processing. In Sentiment analysis of IMDb movie reviews [31], the authors used the meth-ods pre-processing together with TF-IDF. This combination showed an increasing accuracy of approximately 2%. The result of [32][31] aligns fairly well with the results of our thesis, of which we saw an increase of the accuracy of 0, 87% and 0, 44% respectively, as shown in section 5.5.5. A potential explanation to why we got a slightly lower increase in accuracy after pre-processing is that the authors of Application of Text Mining for classification of Community Complaints and Proposals used synonym recognition together with a much larger dataset.
In Automated Big Security Text pruning and Classification [29], the authors use text prun-ing, to increase the accuracy of the classification algorithm. Even though never imple-mented, they show results that can suggest text pruning could improve the accuracy of a model. In our thesis text, pruning is used with the implementation of stop words and TF-IDF. Together with the use of the pre-processing steps described in section 5.4.3, we argue and can verify that text pruning makes an impact on the overall accuracy of our machine learning model.
In Text Categorization with Support Vector Machines: Learning with Many Relevant Fea-tures [30], the author assesses the ability to use Support Vector Machine for text classifica-tion, and why it is a suitable method for that purpose. The result of the study show that Support Vector Machine is a useful algorithm for text classification. It is closely related to our result in this thesis, which also demonstrates that Support Vector Machine is a suitable algorithm for text classification.
In Privacy Issues and Data Protection in Big Data: A Case Study Analysis under GDPR [3], the authors discuss methods of handling sensitive data which has been useful to this thesis, to understand the under-laying purpose of why and how specific personal informa-tion must be handled in order to comply with GDPR.
6.3 Analysis of result
This thesis aimed to examine ways of categorizing data from a transcribed phone call to leave out sensitive information. As stated in section 1.4, we focused on personal identifiers like names and locations. The result shows that even though the dataset was comparatively small (917 samples), we got a relatively high accuracy on both the Naive Bayes model, as well as the Support Vector Machine model. As Figures 22 and 23 shows, our models tends to overfit. However, this is an expected result from a learning curve plotting a model’s performance, when trained on a complex dataset, together with a small number of data samples [12]. Moreover, as the test report in Appendix, Figure 30 stipulates, our model performs reasonably well even when facing problems with overfitting.
TF-IDF was used as an addition to stop words to filter out words that occur with a high frequency. This step was helpful since we were unsure of how much variance the dataset would have and to avoid that too much weight was taken up by words that appear very frequently[12].
A worst-case scenario for a ROC-curve would be if the model performs close to the random prediction line, which would be the same as a coin toss. However, as the AUC-ROC curves in section 5.5.4 Figure 26 shows, our models can distinguish well between sensitive and non-sensitive data. The result of the pre-processing conducted in this thesis shows that it is beneficial to use methods of pre-processing to increase the accuracy of a machine learning model. Comparing with other study’s in the same area, as mentioned in section 6.2, our methods of pre-processing fared reasonably well.
7
Conclusion
Machine learning algorithms like Naive Bayes or Support Vector Machine is suitable for classifying the sensitivity of the data. However, it is still difficult to classify all data correctly, much due to the complexity of the spoken language. Since a machine learning model is only as good as the data it is trained on, collecting data and especially the right data is a crucial step. Despite this, and the small size of our dataset, we have shown that Support Vector Machine gave a test accuracy of 89,13%, which is slightly better than Naive Bayes, which gave a test accuracy of 86,95%.
The research questions that we have answered in this thesis are:
RQ1: How can data be categorized to distinguish sensitive data from non-sensitive data from a transcribed phone call?
RQ2: How will the use of data pre-processing affect the accuracy of the machine learning model?
RQ3: What is the risk that sensitive data gets classified as non-sensitive data?
By showing, in section 5.1 - 5.4, the implementation of a machine learning model that can distinguish between sensitive and non-sensitive data we have answered RQ1. Pre-processing data will increase the accuracy of the machine learning algorithm. In section 5.5.5, RQ2 is answered by showing an increase in the overall accuracy after pre-processing the data. Lastly, by creating a classification report and a AUC-ROC curve in section 5.5.3 - 5.5.4, RQ3 is answered. However, even though the numbers suggest that there is only about 10-15 % chance the model classifies sensitive data as non-sensitive, that number should be taken with a pinch of salt. Since the human language is ambiguity, and the same word can shift meaning if put in a different context, consideration must be taken when classifying sensitive information. Therefore, an important step before implementing a machine learning model is to understand the purpose of the model. Especially for coop-erates trying to comply with GDPR, it might be relevant to discuss whether is it beneficial to have a higher threshold when it comes to sensitive data. Meaning, it is more impor-tant that sensitive data gets classified as sensitive than non-sensitive data is classified as non-sensitive.
7.1 Future work
In this thesis, we implemented two machine learning algorithms, Naive Bayes and Support Vector Machine, to classify sensitive and non-sensitive information from a transcribed phone call. Further work in this area can involve different techniques of extracting words from a dataset. Furthermore, adding more sample to the dataset to avoid overfitting would be an adequate approach. Moreover, pre-processing methods, like synonym recognition, entity recognition, and part-of-speech tagging to see if there are room for improvement, would be interesting to evaluate. Lastly, implement the model in a system for real-time calls could turn this idea of classifying sensitive information, into an actual product.
References
[1] Rajalakshmi, Narayanan Madeshan, and Ug Scholar. “An Exclusive Study on Un-structured Data Mining with Big Data”. In: 10 (Jan. 2015). [Online; accessed 19-march-2019], pp. 3875–3886.
[2] Anil K. Jain, Karthik Nandakumar, and Arun Ross. “50 years of biometric research: Accomplishments, challenges, and opportunities”. In: Pattern Recognition Letters 79 (2016). [Online; accessed 09-march-2019], pp. 80 –105. issn: 0167-8655. doi: https: //doi.org/10.1016/j.patrec.2015.12.013. url: http://www.sciencedirect. com/science/article/pii/S0167865515004365.
[3] Nils Gruschka et al. Privacy Issues and Data Protection in Big Data: A Case Study Analysis under GDPR. [Online; accessed 16-march-2019]. Nov. 2018.
[4] Svenska folket och robotar : Insight Intelligence. http://www.insightintelligence. se / svenska - folket - och - robotar / svenska - folket - och - robotar - rapport. [Online; accessed 13-march-2019]. 2019.
[5] P. Samarati. “Protecting respondents identities in microdata release”. In: IEEE Trans-actions on Knowledge and Data Engineering 13.6 (2001). [Online; accessed 11-march-2019], pp. 1010–1027. issn: 1041-4347. doi: 10.1109/69.971193.
[6] Alexandra Carlsson Tenitskaja. Miljontals samtal till 1177 Vårdguiden låg ute på nätet. [Online; accessed 16-march-2019]. 2019. url: https://www.dn.se/ekonomi/ miljontals-samtal-till-1177-lag-ute-pa-natet/.
[7] SVT Nyheter. Region Stockholm inleder extern granskning efter 1177-skandalen. [On-line; accessed 16-march-2019]. 2019. url: https://www.svt.se/nyheter/lokalt/ stockholm/extern-granskning-av-1177.
[8] Vihar Kurama and Vihar Kurama. Introduction To Machine Learning. [Online; ac-cessed 08-march-2019]. 2017. url: https://towardsdatascience.com/introduction-to-machine-learning-db7c668822c4.
[9] Datasets and Machine Learning. [Online; accessed 10-march-2019]. url: https:// skymind.ai/wiki/datasets-ml.
[10] 953383504824263. Building a Deployable ML Classifier in Python. 2018. url: https: / / towardsdatascience . com / building a deployable ml classifier in -python-46ba55e1d720?gi=e6e31f6b5aec.
[11] Overfitting and Underfitting With Machine Learning Algorithms. [Online; accessed 03-may-2019]. 2019. url: https://machinelearningmastery.com/overfitting-and-underfitting-with-machine-learning-algorithms/.
[12] Jacob T. Vanderplas. Python data science handbook: tools and techniques for devel-opers. [Online; accessed 15-march-2019]. OReilly, 2016, pp. 363–379.
[13] MonkeyLearn. Support Vector Machines. https://monkeylearn.com/text-classification-support-vector-machines-svm/. [Online; accessed 13-march-2019]. 2019.
[14] Rohith Gandhi. Naive Bayes algorithm. https://towardsdatascience.com/naive-bayes-classifier-81d512f50a7c. [Online; accessed 17-march-2019]. May 2018.
[15] Jason Brownlee. How To Implement Naive Bayes From Scratch in Python. https: / / machinelearningmastery . com / naive - bayes - classifier - scratch - python/. [Online; accessed 18-mar-2019]. 2014.
[16] George seif. Natural language processing. https://towardsdatascience.com/an-easy- introduction- to- natural- language- processing- b1e2801291c1. [Online; accessed 01-mar-2019]. Oct. 2018.
[17] Steven T. Piantadosi, Harry Tily, and Edward Gibson. “The communicative function of ambiguity in language”. In: Cognition 122.3 (2012). [Online; accessed 18-march-2019], pp. 280 –291. issn: 0010-0277. doi: https://doi.org/10.1016/j.cognition. 2011 . 10 . 004. url: http : / / www . sciencedirect . com / science / article / pii / S0010027711002496.
[18] Wendy G. Lehnert and Martin H. Ringle. “Strategies for natural language process-ing”. In: [Online; accessed 18-march-2019]. Hillsdale: Erlbaum, 1982, p. 8. isbn: 0-89859-191-0.
[19] Stanford NLP Group. Tokenization. https://nlp.stanford.edu/IR-book/html/ htmledition/tokenization-1.html. [Online; accessed 15-march-2019]. Apr. 2009. [20] Mayank Tripathi. How to process textual data using TF-IDF in Python. https :
//medium.freecodecamp.org/how- to- process- textual- data- using- tf- idf-in-python-cd2bbc0a94a3. [Online; accessed 03-may-2019]. June 2018.
[21] SKETCH ENGiNE. What is an n-gram. https://www.sketchengine.eu/user-guide/user-manual/n-grams/. [Online; accessed 03-may-2019].
[22] OpenML. 10fold Crossvalidation. https : / / www . openml . org / a / estimation -procedures/1. [Online; accessed 21-april-2019].
[23] ResearchGate. 10-fold Crossvalidation. https://www.researchgate.net/figure/ 10 - fold - cross - validation - procedure _ fig3 _ 239386696. [Online; accessed 21-april-2019].
[24] Ritchie Ng. Learning Curve. https : / / www . ritchieng . com / machinelearning -learning-curve/. [Online; accessed 28-april-2019].
[25] Scikit learn. Validation curves: plotting scores to evaluate models. https://scikit-learn . org / stable / modules / https://scikit-learning _ curve . html. [Online; accessed 28-april-2019].
[26] Yellowbrick. Classification Report. https://www.scikit-yb.org/en/latest/api/ classifier/classification_report.html. [Online; accessed 28-april-2019]. 2016. [27] GeeksforGeeks. Confusion Matrix in Machine Learning. https://www.geeksforgeeks.
org/confusion-matrix-machine-learning/. [Online; accessed 28-april-2019]. [28] Jocelyn D’Souza and Jocelyn D’Souza. Let’s learn about AUC ROC Curve! [Online;
accessed 20-may-2019]. 2018. url: https://medium.com/greyatom/lets-learn-about-auc-roc-curve-4a94b4d88152.
[29] K. Alzhrani et al. “Automated big security text pruning and classification”. In: 2016 IEEE International Conference on Big Data (Big Data). [Online; accessed 07-march-2019]. 2016, pp. 3629–3637. doi: 10.1109/BigData.2016.7841028.
[30] Thorsten Joachims. “Text categorization with support vector machines: Learning with many relevant features”. In: European conference on machine learning. [Online; accessed 17-march-2019]. Springer. 1998, pp. 137–142.
[31] Talal Ahmed Alejandro Pelaez and Mohsen Ghassemi. “Sentiment analysis of IMDb moviereviews”. In: (2015). [Online; accessed 15-april-2019], pp. 1 –7. url: https: //pdfs.semanticscholar.org/c521/80a8fe1acc99b4bf3cf3e11d3c8a38e2c7ff. pdf.
[32] I. B. N. S. Hardaya, A. Dhini, and I. Surjandari. “Application of text mining for classification of community complaints and proposals”. In: 2017 3rd International Conference on Science in Information Technology (ICSITech). [Online; accessed 20-april-2019]. 2017, pp. 144–149. doi: 10.1109/ICSITech.2017.8257100.
[33] J. F. Nunamaker and M. Chen. “Systems development in information systems re-search”. In: Twenty-Third Annual Hawaii International Conference on System Sci-ences. Vol. 3. [Online; accessed 15-march-2019]. 1990, 631–640 vol.3.
[34] Real Python. Jupyter Notebook: An Introduction – Real Python. [Online; accessed 12-april-2019]. 2019. url: https://realpython.com/jupyter-notebook-introduction/. [35] Avinash Navlani. Text Analytics for Beginners using NLTK. https://www.datacamp.
com/community/tutorials/text- analytics- beginners- nltk. [Online; accessed 08-may-2019]. Sept. 2018.
[36] Rounak Banik. TED Talks. [Online; accessed 23-march-2019]. 2017. url: https : //www.kaggle.com/rounakbanik/ted-talks.
[37] Pre-Processing in Natural Language Machine Learning. [Online; accessed 26april2019]. 2017. url: https : / / towardsdatascience . com / pre processing in -natural-language-machine-learning-898a84b8bd47.
[38] Python Programming Tutorials. [Online; accessed 28-april-2019]. url: https : / / pythonprogramming.net/stop-words-nltk-tutorial/.
Appendix
Figure 28: Test cases.
![Figure 1: The workflow of a machine learning process [10].](https://thumb-eu.123doks.com/thumbv2/5dokorg/3948803.72380/11.892.254.648.637.813/figure-workflow-machine-learning-process.webp)
![Figure 2: Representations of training texts [13].](https://thumb-eu.123doks.com/thumbv2/5dokorg/3948803.72380/12.892.344.539.556.780/figure-representations-of-training-texts.webp)
![Figure 3: The suggested decision boundary [13].](https://thumb-eu.123doks.com/thumbv2/5dokorg/3948803.72380/13.892.326.566.209.500/figure-the-suggested-decision-boundary.webp)
![Figure 4: 10-fold cross-validation procedure [23]. 2.4.2 Learning curve](https://thumb-eu.123doks.com/thumbv2/5dokorg/3948803.72380/15.892.289.609.286.509/figure-fold-cross-validation-procedure-learning-curve.webp)
![Figure 5: Nunamaker and Chen system development research process [33]. 4.1.1 Construct a conceptual framework](https://thumb-eu.123doks.com/thumbv2/5dokorg/3948803.72380/20.892.371.498.544.910/figure-nunamaker-development-research-process-construct-conceptual-framework.webp)