Rapport 13 - 2011
Proficiency Testing
Drinking Water Microbiology
2011:1, March
by Tommy Šlapokas, Christina Lantz and Malin Lindqvist
36 ↓ 0 4 8 12 16 20 0 15 30 45 60 75 90 105 120 135 150 Escherichia coli (M F) No. of results
No. of colonies per 100 m l
Proficiency Testing
Drinking Water
Microbiology
– 2011:1, March –
Tommy Šlapokas1
Christina Lantz2
Malin Lindqvist2
1 Compilation and writing 2 Laboratory work
1st edition
Microbiology Division National Food Administration
Box 622
SE-751 26 UPPSALA SWEDEN Uppsala 2011
Contents
Introduction ... 3
Design ... 3
- Analyses and mixtures ... 3
- Quality check of the samples ... 5
Laboratory results ... 6
- General information regarding the results ... 6
- Outcome of the mixtures ... 7
Mixture A ... 7
Mixture B ... 13
Mixture C ... 18
Outcome of the methods ... 23
- General information regarding methods ... 23
- Results for coliform bacteria and E. coli with different method variants ... 23
- Results for Clostridium perfringens with different method variants ... 27
The outcome of deviating results – judgement ... 30
Figure 2 — Box plot References ... 31
References ... 35
Annex A — all analytical results ... 36
Annex B — photo example of colony appearance on some media ... 40
Introduction
In all analytical activity it is of utmost importance that the work maintains a well documented high standard. Therefore, most laboratories have a system for quality assurance. How well this works has to be evaluated by an independent part. Such an external quality check of laboratory competence is also commonly required by accreditation bodies. One way is by taking part in proficiency tests (PT).
In a PT round test items are analysed by a number of laboratories. They are supposed to follow instructions, perform analyses using their routine methods and report their results to the organiser. The organiser evaluates the results and finally compiles them in a report.
Objectives of microbiological PT schemes at the National Food Administration 1. Laboratories should receive an external evaluation of parts of their analytical
competence, including usage of methods, documentation and orderliness.
2. The accreditation bodies in respective countries should have a tool at inspections regarding new accreditation and maintenance of accreditation.
3. The laboratories and the organiser should receive increased knowledge regarding how well methods work, with respect to various types of organisms, at laboratories that on a routinely basis perform corresponding analyses.
Design
Analyses and mixtures
This particular proficiency test was performed during week 11 in March 2011, and is registered as no. 774/2011 at the National Food Administration, Uppsala.
Samples were sent to 109 laboratories out of which 35 Swedish, 36 Finnish, 25 from the other Nordic countries and 13 from the rest of the world. Three of the laboratories did not report results.
Assessed parameters
Coliform bacteria and Escherichia coli with MF (membrane filtration)
Coliform bacteria and Escherichia coli with rapid kit methods (MPN results) Presumptive Clostridium perfringens with MF, colonies before confirmation Clostridium perfringens with MF
Micro fungi (yeast and mould) with MF
Culturable microorganisms (total count) after incubation for 3 days at 22±2 °C Not assessed parameters (background for interpretations and discussions)
Suspected coliform bacteria and Suspected thermotolerant coliform bacteria with MF, typical colonies (before confirmation) at 35/36/37 °C and 44/44,5 °C, respectively, on relevant media.
The proficiency test comprised three simulated water samples. Each laboratory was assigned to perform the analyses according to its ordinary methods routinely used on drinking water samples. The test material is first and foremost adjusted to those EN ISO methods for analyses of drinking water, stated in the drinking water directive of the European Union (1). Accepted alternative methods in EU are also possible to use, in general, as well as other similar methods.
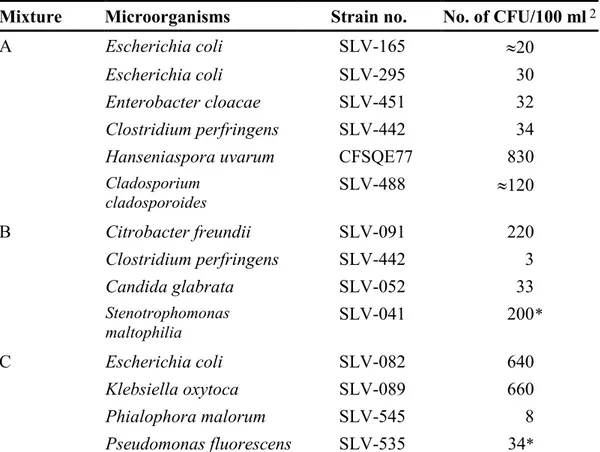
Three freeze-dried test materials were produced from different microorganism mixtures. The material was manufactured and freeze-dried in portions of 0.5 ml in small vials, according to the description by Peterz and Steneryd (2). Each laboratory received one vial of each mixture. The simulated water samples, 800 ml each, were prepared by dissolving the content of the vials in sterile dilution or rinsing agent. The composition in respective mixture is clear from table 1.
Table 1 Microbial mixtures 1
Mixture Microorganisms Strain no. No. of CFU/100 ml2
A Escherichia coli SLV-165 ≈20
Escherichia coli SLV-295 30
Enterobacter cloacae SLV-451 32
Clostridium perfringens SLV-442 34
Hanseniaspora uvarum CFSQE77 830
Cladosporium cladosporoides SLV-488 ≈120 B Citrobacter freundii SLV-091 220 Clostridium perfringens SLV-442 3 Candida glabrata SLV-052 33 Stenotrophomonas maltophilia SLV-041 200 * C Escherichia coli SLV-082 640 Klebsiella oxytoca SLV-089 660 Phialophora malorum SLV-545 8 Pseudomonas fluorescens SLV-535 34*
1 For linkage between the randomised sample number and respective mixture, please see annex A
2 Based on results from duplicate analyses, performed at the National Food Administration, of 10
vials per mixture (table 2), The results from m-Endo Agar LES have been used for E. coli SLV-082, SLV-165 & E. coli SLV-295, E. cloacae, K. oxytoca and C. freundii; those from TSC Agar for C. perfringens; those from RBCC Agar for H. uvarum, C. cladosporoides, C. glabrata and
Ph. malorum; those from YeA for S. maltophilia and P. fluorescens — no. is stated as cfu
("colony forming units") per 100 ml, if other is not stated
Quality check of the samples
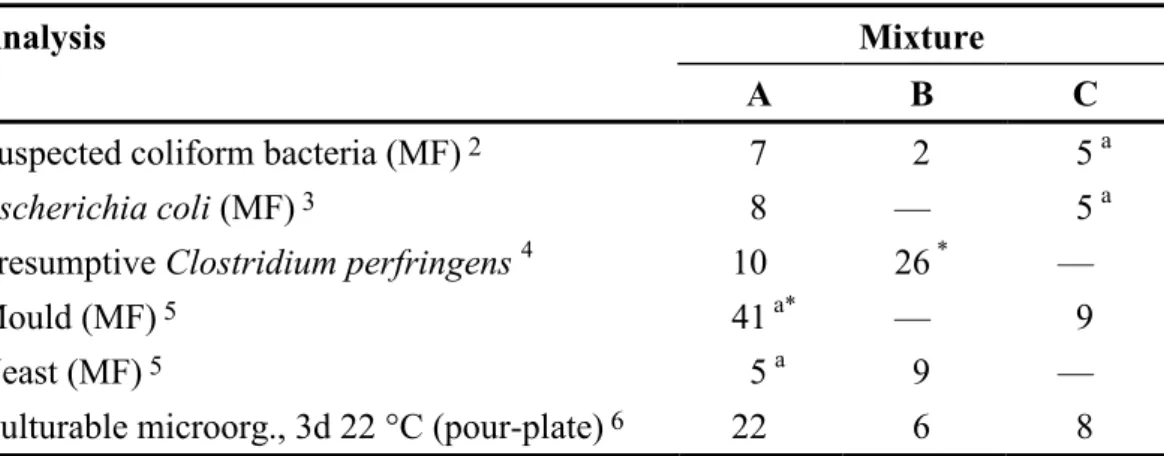
Homogenous samples and uniform volumes in all vials are prerequisites in order for comparison of all freeze dried samples from one mixture to be feasible. The volume has been checked in 15 vials from each mixture. The differences between vials in the mixtures were 3-5 mg. The highest accepted variation is 15 mg (3%). Table 2 presents the results from duplicate analyses of 10 vials from each mixture as coefficients of variation (CV). The results relate to that unit by volume at which the colonies were counted. According to the criteria used, the CV´s were acceptable for all mixtures in order to be regarded as homogenous. The highest accepted CV is normally 25%. The CV for moulds in mixture A and C. perfringens in mixture B was high (> 25%). The reason is low mean values (≤ 4 cfu/unit by volume) that make high CV acceptable. The result of culturable microorganisms in mixture A is mainly obtained from mould and yeast colonies, which might explain the relatively high CV. To read more about the calculations, see the scheme protocol (3)
Table 2 Coefficients of variation (%; square root transformed results 1) for various
microbial groups, in analyses performed in connection to the proficiency test
Analysis Mixture
A B C
Suspected coliform bacteria (MF) 2 7 2 5 a
Escherichia coli (MF) 3 8 — 5 a
Presumptive Clostridium perfringens 4 10 26 * —
Mould (MF) 5 41 a* — 9
Yeast (MF) 5 5 a 9 —
Culturable microorg., 3d 22 °C (pour-plate) 6 22 6 8
1 n=10 mean values á 2 analyses of 100 ml for MF and 1 ml for pour-plate, if other is not stated;
mixtures A, B and C analysed 7, 8 and 11 weeks ahead of the testing week, respectively.
2 m-Endo Agar LES according to SS 028167 [analyses were also made on m-Lactose TTC Agar
with Tergitol according to SS-EN ISO 9308-1:2000, but those results are not accounted for here]
3 m-FC Agar, 44 °C, according to SS 028167 [analyses were also made at 44 °C on Lactose TTC
Agar with Tergitol acc. to SS-EN ISO 9308-1:2000, but those results are not accounted for here]
4 Spores + Vegetative cells; Tryptose Sulphite Cycloserine Agar (TSC) 44 °C according to ISO/CD
6461-2:2002
5 Rose Bengal Agar containing both chlortetracycline and chloramphenicol (RBCC) according to
SS 028179
6 Yeast extract Agar (YeA; yeast extract agar with tryptone) according to SS-EN ISO 6222:1999
a Read for the volume 10 ml
— No reading
Laboratory results
General information regarding the results
The histograms (figure 1) show the actual distribution of the results. False positives are not presented in the histograms. The total number of these, and other results with annotations, are compiled in table 3. False results and outliers are generally not included in the calculations. All reported laboratory results are compiled in annex A and photo examples of colony appearance are given in annex B. Z-values for the all evaluated results are given in annex C.
In most histograms are “tails” in either or both directions, representing values that do not belong to the distribution present. Better normal distributions are obtained by performing square root transformations of the results, and are, therefore, used for the calculations. The significance of these “tails” is in that way decreased. Very deviating values are identified as outliers also after square root transformation (black bars). They are present in most analyses. False negative results are presented as white bars.
Outliers are identified with the aid of Grubbs’ test according to a modification by Kelly (4). A level of 1% is used as risk to incorrectly assess a result as being an outlier. Although the method itself is objective, it is a prerequisite that the results are normally distributed in order to obtain correct outliers at the 1% level. A result of zero that is identified as a low outlier is regarded as a false negative result. In special situations, e.g. when many zero results are reported and in some borderline cases, a few subjective adjustments are made in order to set just limits, based on the knowledge of the content of the mixtures. Calculations are more elaborately described in the scheme protocol (3).
The coefficient of variation (CV) is used to measure the dispersion of the laboratory results. If the dispersion is < 10% it is regarded as very small, 10-20% as small, 20-30% as medium, 30-40% as large and > 40% as very large.
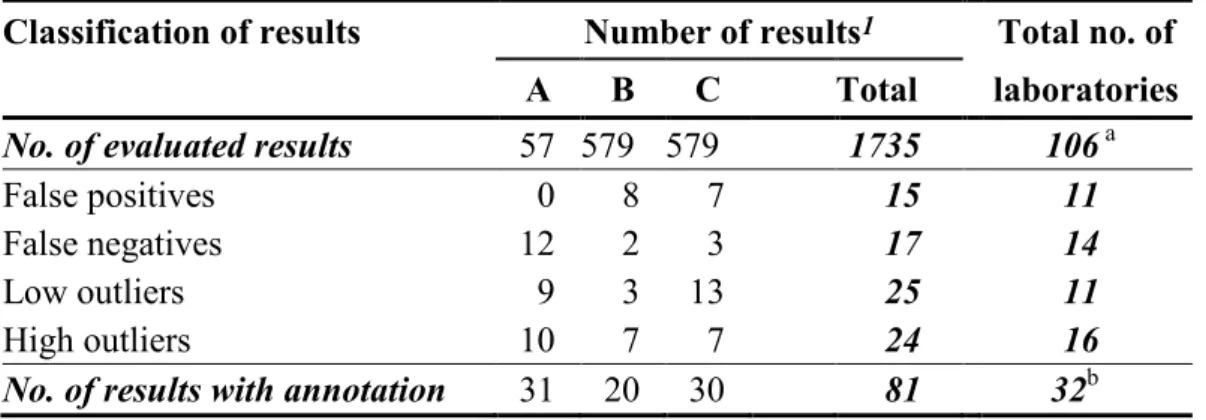
Table 3 Number of analytical results with annotation in evaluated analyses
Classification of results Number of results1 Total no. of
A B C Total laboratories
No. of evaluated results 57 579 579 1735 106 a
False positives 0 8 7 15 11
False negatives 12 2 3 17 14
Low outliers 9 3 13 25 11
High outliers 10 7 7 24 16
No. of results with annotation 31 20 30 81 32b
1 Results obtained in the analyses designated suspected have not been included
a Number of laboratories that reported analytical results
Outcome of the mixtures Mixture A
General information about the mixture
The mixture contained four bacterial strains and two fungi (table 1 and table 4): the coliform bacteria E. coli (2 strains) and E. cloacae, C. perfringens, the mould C. Table 4. The outcome of each analysis in mixture A; F+ and F- represent the share (%) of false positive respectively false negative results. Outl < and Outl > represent the shares (%) of low and high outliers respectively. Shaded analyses are in general not numerically assessed - median is there stated instead of mean.
Analysis Organisms CFU/
vol1 CV
2
(%) F+ F- Outl < Outl > Susp. coliform bacteria (MF) E. coli
E. coli MUG−
E. cloacae
74 —
Coliform bacteria (MF) E. coli
E. coli MUG−
E. aerogenes
68 18 - 0 1 2 Susp. thermotol. colif. bact. (MF) E. coli
E. coli
MUG-[E. cloacae]
40 —
E. coli (MF) E. coli
{E. coli MUG−} 41 24 - 1 1 1
Coliform bact. (rapid method) E. coli
E. coli
MUG-E. cloacae
78 13 - 0 3 3
E. coli (rapid method) E. coli 19 18 - 0 0 0
Presumptive C. perfringens (MF) C. perfringens 42 17 - 2 0 2
C. perfringens (MF) C. perfringens 38 21 - 6 0 0
Mould (MF) C.
cladosporoides 116 28 - 7 0 2
Yeast (MF) H. uvarum 854 9 - 0 2 0
Culturable microorganisms
(total count) 22±2 °C, 3 days H. uvarum (E. cloacae) (E. coli)
12 15 - 3 2 2
1 "Colony Forming Units" per unit of volume – 1 ml for total count microorg., otherwise 100 ml
2 "Coefficient of Variation" – calculated from square root transformed results
- numerical value impossible to obtain
— organism absent or numerical value has not been calculated
∼ unreliable value since the results vary with different interpretations, method differences or such
( ) the organism contributes with very few colonies [ ] the organism is false positive in a presumptive analysis
cladosporoides and the yeast H. uvarum. The yeast together with some individual
colonies of the coliform bacteria and the mould may appear in the analysis of culturable microorganisms after 3 days at 22±2 °C.
The numbers of false positive and false negative results as well as low and high outliers are reported in annex A and their relative shares in table 4.
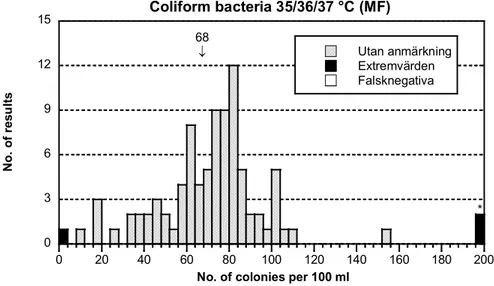
Coliform bacteria, MF
- The results were well distributed (figure 1A). The dispersion was small. However, a somewhat higher number of low results than expected occur.
- 1 low and 2 high outliers were reported.
- Two strains of E. coli and one of E. cloacae were present. The colonies were typical and easy to detect on m-Endo Agar LES. The colonies were relatively easy to distinguish even on m-Lactose TTC (LTTC) Agar, although the whole agar plate turned yellow.
68 ↓ 0 3 6 9 12 15 0 20 40 60 80 100 120 140 160 180 200 Coliform bacteria 35/36/37 °C (MF) Utan anmärkning Extremvärden Falsknegativa N o. o f r es ul ts
No. of colonies per 100 ml
* *
Figure 1A. Mixture A, Histogram of all analytical results. False negatives are
presented as white bars. Outliers, false negatives excluded, are represented by black bars. The range of the x-axis has not been adjusted to very deviating high values. These values are marked with an asterisk (*) and presented as outliers at the right end of x. The mean value of the analysis is stated above the bars. Calculations have been made from square root transformed results, outliers and false negatives excluded.
Suspected thermotolerant coliform bacteria, MF
Colonies regarded as suspected thermotolerant coliform bacteria were reported in 48 cases. The colonies were made up by the two strains of E. coli, which grows on m-FC Agar and LTTC Agar at 44/44.5 °C. Occasionally, small colonies of E.
also for E. coli (MF), indicating that those results are reported form plates incubated at 44/44.5 °C.
E. coli, MF
- The results were relatively well distributed (figure 1B) but with a somewhat higher number of low results than expected. The dispersion was medium.
- 1 false negative result and 1 low and 1 high outlier were reported.
- Colonies incubated on m-FC Agar or LTTC Agar at 44/44.5 °C were easy to detect and quite uniform. They represented the two strains of E. coli.
- When E. coli is determined by confirmation form plates incubated at 35-37 °C the results are a bit more variable than at 44/44.5 °C, because also colonies of E.
cloacae grow at the lower temperature.
- When a chromogenic medium based on detection of β-glucuronidase activity is used (e.g. Chromocult Coliform Agar®) the MUG negative strain of E. coli will
not be detected. This should imply lower E. coli result.
41 ↓ 0 3 6 9 12 15 0 20 40 60 80 100 120 140 160 180 200 Escherichia coli (MF) N o. o f r es ul ts
No. of colonies per 100 ml
*
Figure 1B Mixture A, see figure 1A for explanations Coliform bacteria, rapid method
- The results were well distributed (figure 1C). The dispersion was small.
- 2 low and 2 high outliers were reported. No “tail” with low values was present, causing a somewhat higher mean content than with the MF method.
- All three coliform bacteria were detected.
78 ↓ 0 3 6 9 12 15 0 20 40 60 80 100 120 140 160 180 200
Coliform bacteria (rapid, MPN)
N o. o f r es ul ts MPN-index per 100 ml *
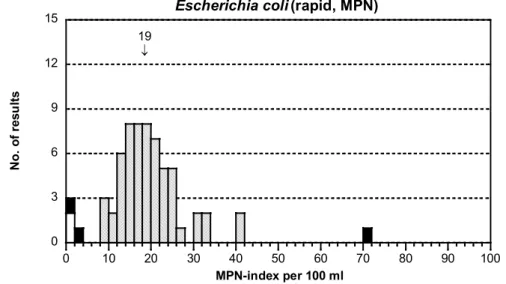
Figure 1C Mixture A, see figure 1A for explanations E. coli, rapid method
- The results were well distributed (figure 1D). The dispersion was small.
- The mean was lower than with the MF method. The reason is that the MUG negative strain of E. coli was not detected by methods based on activity of the enzyme β-glucuronidase, such as Colilert®-18/24 Quanti-Tray® that was clearly
the most used method.
19 ↓ 0 3 6 9 12 15 0 10 20 30 40 50 60 70 80 90 100
Escherichia coli (rapid, MPN)
N o. o f r es ul ts MPN-index per 100 ml
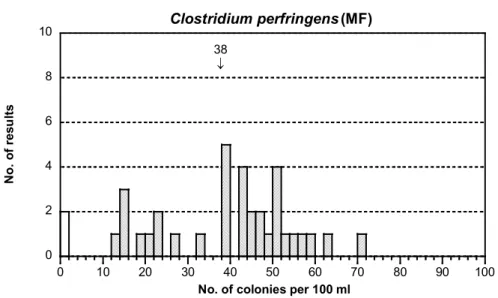
Figure 1D Mixture A, see figure 1A for explanations Presumptive and confirmed Clostridium perfringens
- The distributions looked quite well in both cases (figures 1E and F). The dispersion was small and medium in the respective analysis. There were 10 more
presumptive results compared to confirmed. In many cases were either presumptive or confirmed results reported, sometimes both.
- 1 false negative result and 1 high outlier were reported in the presumptive analysis and 2 false negative results in the confirmed analysis.
- No overrepresentation of low results was apparent this time as often before (5). However as before, the results (without outliers) with m-CP agar had a lower mean than those with TSC Agar also in this round(see table 10 and 11).
- The means for presumptive and confirmed results were approximately equal.
42 ↓ 0 2 4 6 8 10 0 10 20 30 40 50 60 70 80 90 100
Presumptive Clostridium perfringens (MF)
N o. o f r es ul ts
No. of colonies per 100 ml
*
Figure 1E Mixture A, see figure 1A for explanations
38 ↓ 0 2 4 6 8 10 0 10 20 30 40 50 60 70 80 90 100 Clostridium perfringens (MF) N o. o f r es ul ts
No. of colonies per 100 ml
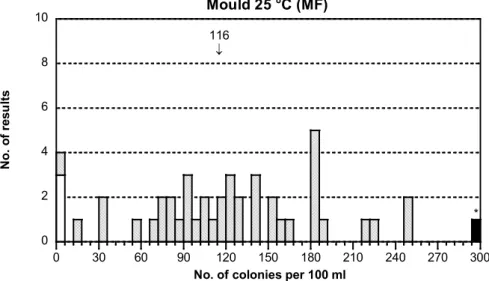
Mould and yeast
- The distribution of mould results was very scattered. The dispersion was, however, only of medium order (figure 1G). The distribution of yeast was much better, with only a small dispersion (figure 1H).
- The yeast H. uvarum appears with about 10 times more colonies than the mould
C. cladosporoides. Counting of yeasts can be done from the volumes 10 and/or 1
ml. The few mould colonies should preferentially be counted from the volume 10 ml. With only 1 ml the mould results will be very low and, accordingly, the dispersion large. This is one explanation to the scattered results of mould.
116 ↓ 0 2 4 6 8 10 0 30 60 90 120 150 180 210 240 270 300 Mould 25 °C (MF) N o. o f r es ul ts
No. of colonies per 100 ml
*
Figure 1G Mixture A, see figure 1A for explanations
854 ↓ 0 2 4 6 8 10 0 150 300 450 600 750 900 1050 1200 1350 1500 Yeast 25 °C (MF) N o. o f r es ul ts
No. of colonies per 100 ml
- The yeast seems to exert some hampering effect on the mould colonies in certain volumes (e.g. 5-20 ml). Some colonies are then seen only as greenish spots in yeast colonies. This might be another explanation to the scattered mould results. Culturable microorganisms
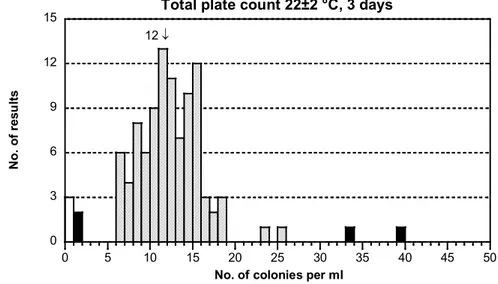
- The results were well distributed (figure 1I). The dispersion was small. - 3 false negatives and 2 low and 2 high outliers were reported.
- Almost all detected colonies should be from the yeast H. uvarum. Some individual colonies of the mould as well as of E. coli and E. cloacae might also appear. 12 ↓ 0 3 6 9 12 15 0 5 10 15 20 25 30 35 40 45 50
Total plate count 22±2 °C, 3 days
N o. o f r es ul ts
No. of colonies per ml
Figure 1I Mixture A, see figure 1A for explanations Mixture B
General information about the mixture
The mixture contained three bacterial strains and one yeast (table 1 and table 5): the coliform bacterium C. freundii, C. perfringens, the yeast C. glabrata and the bacterium S. maltophilia, which dominates in the analysis of culturable micro-organisms. Also C. freundii and the yeast may emerge in that analysis.
The numbers of false positive and false negative results as well as low and high outliers are reported in annex A and their relative shares in table 5.
Table 5. The outcome of each analysis in mixture B; see table 4 for explanations.
Analysis Organisms CFU/
vol1 CV
2
(%) F+ F- Outl < Outl > Susp. coliform bacteria (MF) C. freundii 161 —
Coliform bacteria (MF) C. freundii 155 18 - 2 0 1 Susp. thermotol. colif. bact. (MF) — 0 —
E. coli (MF) — 0 - 3 - - -
Coliform bact. (rapid method) C. freundii 141 16 - 0 2 0
E. coli (rapid method) — 0 - 5 - - -
Presumptive C. perfringens (MF) C. perfringens 3 43 - 0 0 2
C. perfringens (MF) C. perfringens 3 53 - 0 0 0
Mould (MF) — 0 - 4 - - -
Yeast (MF) C. glabrata 33 12 - 0 0 7
Culturable microorganisms
(total count) 22±2 °C, 3 days S. maltophilia (C. freundii) (C. glabrata)
147 9 - 0 2 2
Coliform bacteria, MF
- The results were, in principle, well distributed, but with a small over-representation of low results. The dispersion was small (figure 1J).
- 2 false negatives and 1 low outlier were reported.
- One coliform bacterium, C. freundii, was included in the mixture. It’s colonies are relatively small and rounded on both m-Endo Agar LES and LTTC Agar at
155 ↓ 0 3 6 9 12 15 0 50 100 150 200 250 300 350 400 450 500 Coliform bacteria 35/36/37 °C (MF) N o. o f r es ul ts
No. of colonies per 100 ml
*
37 °C. They show a typical metallic sheen on m-Endo Agar LES but are less typical on LTTC Agar, as they are transparent there with yellow middle.
Coliform bacteria, rapid method
- The distribution of results is similar to that of the MF method. The dispersion was small also here (figure 1K).
- 1 low outlier was reported.
- C. freundii is a coliform bacterium that possesses the enzyme β-galactosidase, and is therefore detected by methods based on that enzyme.
141 ↓ 0 3 6 9 12 15 0 50 100 150 200 250 300 350 400 450 500
Coliform bacteria (rapid, MPN)
N o. o f r es ul ts MPN-index per 100 ml
Figure 1K Mixture B, see figure 1A for explanations Suspected thermotolerant coliform bacteria, MF
No thermotolerant coliform bacteria were included. At a too low temperature (< 43.5 °C) small colonies of C. freundii may appear on m-FC Agar. Four false positive results were recorded.
E. coli, rapid method included
- No E. coli was present in the mixture and a correct result should be zero. Yet, 3 false positive results were recorded in each of the MF and the rapid method. Presumptive and confirmed Clostridium perfringens
- With the low content of C. perfringens (3 cfu/100 ml) the distributions were good (figures 1L and M). The relative dispersion was very large in both analyses due to the low content. There were 10 more presumptive results compared to confirmed. Either presumptive or confirmed results were reported by a laboratory in many cases, but sometimes both.
- 1 high outlier was reported for the presumptive analysis. Moreover, there were a number of zero results reported, which is normal with such a low concentration.
↓ 3 0 3 6 9 12 15 0 5 10 15 20 25 30 35 40 45 50
Presumtpive Clostridium perfringens (MF)
N o. o f r es ul ts
No. of colonies per 100 ml
*
Zero results
Figure 1L Mixture B, see figure 1A for explanations
↓ 3 0 3 6 9 12 15 0 5 10 15 20 25 30 35 40 45 50 Clostridium perfringens (MF) N o. o f r es ul ts
No. of colonies per 100 ml Zero results
Figure 1M Mixture B, see figure 1A for explanations Mould and yeast
- No moulds were present in the mixture.
- The yeast results were well distributed. The dispersion was small (figure 1N). - 3 high outliers were reported.
- C. glabrata grows with typical yeast colonies on relevant media. They will also emerge in the analysis of culturable microorganisms 22 °C, 3 days.
33 ↓ 0 2 4 6 8 10 0 10 20 30 40 50 60 70 80 90 100 Yeast 25 °C (MF) N o. o f r es ul ts
No. of colonies per 100 ml
*
Figure 1N Mixture B, see figure 1A for explanations Culturable microorganisms
- The results were well distributed (figure 1O). The dispersion was very small. - 2 low and 2 high outliers were reported.
- The colonies were almost totally made up of S. maltophilia.
↓ 147 0 4 8 12 16 20 0 50 100 150 200 250 300 350 400 450 500
Total plate count 22±2 °C, 3 days
N o. o f r es ul ts
No. of colonies per ml
*
Mixture C
General information about the mixture
The mixture contained three bacterial strains and one mould (table 1 and table 6): the coliform bacteria E. coli and K. oxytoca, the mould Ph. malorum and the bacterium P. fluorescens that grows as culturable microorganism at 22 °C.
The numbers of false positive and false negative results as well as low and high outliers are reported in annex A and their relative share in table 6.
Table 6 The outcome of each analysis in mixture C; see table 4 for explanations.
Analysis Organisms CFU/
vol1 CV
2
(%) F+ F- Outl < Outl > Susp. coliform bacteria (MF) E. coli
K. oxytoca
1105 —
Coliform bacteria (MF) E. coli
K. oxytoca 1080 9 - 1 5 4
Susp. thermotol. colif. bact. (MF) E. coli 480 —
E. coli (MF) E. coli
{K. oxytoca} 600 19 - 1 2 0
Coliform bact. (rapid method) E. coli
K. oxytoca 1344 11 - 0 3 0
E. coli (rapid method) E. coli 632 10 - 2 3 2
Presumptive C. perfringens (MF) — 0 — 4 - - -
C. perfringens (MF) — 0 — 6 - - -
Mould (MF) Ph. malorum 4 60 - 0 0 2
Yeast (MF) — 0 — 7 - - -
Culturable microorganisms
(total count) 22±2 °C, 3 days P. fluorescens E. coli K. oxytoca
25 19 - 0 2 1
Coliform bacteria, MF
- The distribution was generally good but an unusually high number of both low and high outliers were present. The dispersion was very small (figure 1P).
- 1 false negative result and 5 low and 4 high outliers were reported.
- Both the strains of E. coli and K. oxytoca grow with typical colonies on both m-Endo Agar LES and LTTC Agar.
1080 ↓ 0 4 8 12 16 20 0 250 500 750 1000 1250 1500 1750 2000 2250 2500 Coliform bacteria 35/36/37 °C (MF) N o. o f r es ul ts
No. of colonies per 100 ml
*
Figure 1P Mixture C, see figure 1A for explanations E. coli, MF
- The result distribution was a bit skewed to the higher end. The dispersion was small (figure 1Q) but somewhat higher than for the coliform bacteria.
- 1 false negative result and 2 low outliers were reported. - At 44/44.5 °C only the E. coli strain will grow on agar media.
- At 35-37 °C both the strains of E. coli and K. oxytoca grow with typical colonies on m-Endo Agar LES and LTTC Agar. There E. coli has to be discerned by confirmation. When indole production is tested in broth with tryptophane, the E.
coli confirms positive, but also the strain of K. oxytoca may grow there and
show positive indole reaction. Test of gas production or, nowadays, test of β-
600 ↓ 0 4 8 12 16 20 0 250 500 750 1000 1250 1500 1750 2000 2250 2500 Escherichia coli (MF) N o. o f r es ul ts
No. of colonies per 100 ml
glucuronidase activity (e.g. with MUG) is sometimes used in addition to confirm
E. coli unambiguously. In both these tests K. oxytoca is negative while E. coli is
positive.
- The unexpected high counts may possibly be explained by the fact that colonies of K. oxytoca are interpreted as E. coli. Compare with the results for the rapid method below.
Coliform bacteria, rapid method
- The results were well distributed, with exception of some high results. The dispersion was despite that small (figure 1R).
- 2 low outliers were reported.
- Both E. coli and K. oxytoca will be regarded as coliform bacteria by methods based on activity of the enzyme β-galactosidase, such as Colilert®-18/24
Quanti-Tray®. 1344 ↓ 0 3 6 9 12 15 0 250 500 750 1000 1250 1500 1750 2000 2250 2500
Coliform bacteria (rapid, MPN)
N o. o f r es ul ts MPN-index per 100 ml
Figure 1R Mixture C, see figure 1A for explanations E. coli, rapid method
- The results were well distributed (figure 1S). The dispersion was small. - 1 false negative result and 2 low and 1 high outlier were reported.
- The E. coli strain in the mixture is β-glucuronidase positive, and is thus detected as E. coli by Colilert®-18/24 Quanti-Tray®.The strain of K. oxytoca, which is indole positive like E. coli, is however β-glucuronidase negative. It will not be detected as E. coli with e.g. that method.
632 ↓ 0 4 8 12 16 20 0 250 500 750 1000 1250 1500 1750 2000 2250 2500 Escherichia coli (rapid, MPN)
N o. o f r es ul ts MPN-index per 100 ml
Figure 1S Mixture C, see figure 1A for explanations Presumptive and confirmed Clostridium perfringens
There were no C. perfringens or other bacteria that could be mixed up with that species in the mixture. No false positive results were reported.
Mould and yeast
- There was no yeast in the mixture. Yet, 3 false positive results were present. - One mould was included and the distribution of the results were normal with
exception of some zero results (figure 1T). The average was low and the relative
7 ↓ 0 3 6 9 12 15 0 5 10 15 20 25 30 35 40 45 50 Mould 25 °C (MF) N o. o f r es ul ts
No. of colonies per 100 ml
*
Zero results
dispersion therefore very large. The average was 4 cfu with zero results included and 7 cfu without.
- The 10 zero result is an overrepresentation despite the low average. The reason is not clear. The colonies could possibly be mistaken for yeast colonies because their sporulation is late. However, only 3 of the laboratories with zero results have reported any yeast colonies instead. In one of these cases, the result is even unreasonably high.
Culturable microorganisms
- The results were well distributed (figure 1U). The dispersion was small. - 2 low and 1 high outlier were reported.
- The colonies are mainly made up by P. fluorescens. However, the coliform bacteria comprise approximately 40%.
25 ↓ 0 4 8 12 16 20 0 10 20 30 40 50 60 70 80 90 100
Total plate count 22±2 °C, 3 days
N o. o f r es ul ts
No. of colonies per ml
*
Outcome of the methods
General information regarding methods
From this testing round onwards it is mandatory to give method information, by using the web form, for methods for which you want to report analytical results and that will be evaluated. Earlier this has been voluntary. The effect is that method information is reported for 100% of the numerical results in this round. Because of this, no table is given showing the proportion method information reported. The numbers of results for the various methods are clear from the descriptive part of annex A.
Method information can be recorded at any time after logging on and not necessarily in connection to current test rounds. Stated information stays in the database and need not be re-entered by the laboratory for the same method, as long as the information is valid. If method alternatives should be missing in the method forms, messages can be sent by e-mail or by use of the comment field at the bottom of the method forms. These comments are, however, only evaluated in connection to result processing and writing of the final report.
Although method information this time is available for all numerical results, they are not always easy to interpret. For some laboratories the medium stated differs from what should be the appropriate one according to the standard method stated. Results from such laboratories are not included in the compilations in the report. In other cases the interpretation must be made that one method is used for (suspected) thermotolerant coliform bacteria and another one is used for E. coli, where in both cases the incubation temperature has been 44/44.5 °C.
Method information from laboratories with outliers or false results for a particular analysis will not be included in the compilations. However, it is possible that some methods could result in more such deviating results than others. This might then be mentioned in the text, but for an as fair comparison as possible to be made between methods, false results and outliers are skipped. Method items with 3 or fewer results will normally not be discussed in the comparisons.
Results for coliform bacteria and E. coli (MF) with different method variants In Norway, Finland and Sweden, the national membrane filtration methods (MF) for coliform bacteria may be used at statutory sampling, as alternatives to the reference method EN ISO 9308-1:2000 based on Lactose TTC Agar with Tergitol 7 (”LTTC Agar”). These national methods, which are based on m-Endo Agar LES (”LES endo agar”) and m-FC Agar, have usually to be used more or less modified. In Sweden and Finland, m-FC Agar must not be used for statutory sampling in drinking water, rather, E. coli should be determined by the confirmation from LES Endo Agar plates incubated at 36±2 °C. The E. coli confirmation in Sweden is made up by a negative oxidase test for coliform bacteria, and in addition, a positive indole test at 44 °C, and from the autumn 2010 also a positive β-glucuronidase
activity test. This latter test is a complement to the indole tests in order to eliminate among others, indole positive and in broth thermotolerant K. oxytoca strains (7). In Finland, an additional gas test at 44 °C or β-glucuronidase activity test is recommended as complement to the indole test. In such cases, E. coli should be indole positive as well as gas or β-glucuronidase positive.
Table 7 Numbers of answers and results, outliers excluded, with different method
standards in MF analysis of coliform bacteria (A) and E. coli (B) incubated at 36±2 °C
Method standard Total Mixture
no. of A B C answ. n Mv 1 n Mv 1 n Mv 1 A. Coliform bacteria 95 83 68 81 156 76 1082 XX-EN ISO 9308-1:2000 a 33 24 65 24 137 21 1026 SS 028167 b 27 25 76 24 164 24 1180 SFS 3016 c 28 27 68 26 170 24 1057 NS 4788 d 3 3 52 3 161 3 1055 Other 4 4 39 4 129 4 967 B. Escherichia coli 53 47 40 47 0 47 601 XX-EN ISO 9308-1:2000 a 15 11 48 12 0 11 565 SS 028167 Modif. b, e 17 17 42 16 0 17 579 SFS 3016/4088 Modif.e, f, g 18 16 38 16 0 16 669 NS 4792 h 1 1 37 1 0 1 510 Other 2 2 9 2 0 2 506
1 Mean values based o square root transformation cfu per 100 ml
a ISO/CEN Standard: Water quality — Detection and enumeration of Escherichia coli and
coliform bacteria — Part 1: Membrane filtration method, September 2000 (XX stands for the national translations, if any)
b Swedish Standard: Coliform Bacteria, Thermotolerant Coliform Bacteria and Escherichia coli in
Water — Determination with Membrane Filtration Method (MF), 2nd ed. 1996-03-13
c Finnish Standard: Membrane filter technique for the enumeration of total coliform bacteria in
water, 2001-05-21
d Norwegian Standard: Coliform Bacteria — Membrane filter method, 1st ed. May 1990
e E. coli are coliform bacteria from m-Endo Agar LES that are indole positive at 44 °C and from
the autumn 2010 also are β-glucuronidase positive
f Finnish Standard: Membrane filter technique for the enumeration of thermotolerant (faecal)
coliform bacteria in water, 2001-05-21
g E. coli are coliform bacteria from m-Endo Agar LES that are indole positive, alternatively gas &
indole positive or β-glucuronidase & indole positive at 44 °C
h Norwegian Standard: Thermotolerant coliform bacteria and presumptive E. coli — Membrane
Apart from the reference method XX-EN ISO 9308-1:2000 (XX stands for the national versions), the older national standards used in Finland, Norway and Sweden are presented individually in table 7 and 8. There are also the terms SS 028167 Modif. and SFS 3016/4088 Modif., as regards E. coli. They involve modifications such as e.g. those that were stated above, with respect to Sweden and Finland, respectively. Individual results obtained with other methods or where the method is not known is not discussed here.
Regarding coliform bacteria, there is no general difference of significance, in the mixtures, A and C according to the table 7A. Different strains of E. coli and other coliform bacteria were present there. According to the photos in annex B the colony appearance is typical and quite easily interpreted. For the mixture B the reference method XX-EN ISO 9308-1 seems to give somewhat lower results. Table 8 Numbers of answers and results, with different method standards in
analysis of suspected thermotolerant coliform bacteria (A; all results) and E. coli (B; outliers excluded ) with membrane filtration and incubation at 44/44.5 °C
Method standard Total Mixture
no. of A B C
answ. n Mv 1 n Mv 1 n Mv 1 A. Susp. thermotol. colif. bact. 56 43 37 40 0 43 479
XX-EN ISO 9308-1:2000 a 11 9 39 7 0 9 567 SS 028167 b 15 10 36 10 0 10 518 SFS 4088 c 21 17 35 17 0 17 417 NS 4792 d 7 6 36 6 0 6 559 Other 2 1 100 0 – 1 100 B. Escherichia coli 11 11 41 11 0 11 605 XX-EN ISO 9308-1:2000 a 2 2 39 2 0 2 664 SS 028167 b 1 1 41 1 0 1 456 SFS 4088 c 4 4 37 4 0 4 552 NS 4792 d 2 2 38 2 0 2 493 Other 2 2 53 2 0 2 880
1 Mean values based o square root transformation
a ISO/CEN Standard: Water quality — Detection and enumeration of Escherichia coli and
coliform bacteria — Part 1: Membrane filtration method, September 2000 (XX stands for the national translations, if any)
b Swedish Standard: Coliform Bacteria, Thermotolerant Coliform Bacteria and Escherichia coli in
Water — Determination with Membrane Filtration Method (MF), 2nd ed. 1996-03-13
c Finnish Standard: Membrane filter technique for the enumeration of total coliform bacteria in
water, 2001-05-21
Probably this is caused by the fact that the coliform bacteria are made up of a strain of C. freundii that gives colonies with a faint yellow colour on the LTTC medium (annex B). With a lot of colonies present, the whole agar plate turns yellow making the yellow colouration of the medium by the individual colonies difficult to discern. Furthermore, the strain of S. maltophilia will appear as disturbing background flora with greenish colonies. The colonies are typical for coliforms on LES endo Agar.
Table 7B accounts for the outcome of E. coli that is confirmed after primary incubation at 36±2 °C. Mixture B did not contain any E. coli. Mixture A contained two strains of E. coli, of which one is β-glucuronidase negative. The reference method seems to give somewhat higher values there. In mixture C with another E.
coli strain the reference method does not give the highest average result, but the.
modified Finnish method instead. Different methods, thus show varying recovery with different strains.
Table 8 accounts for the outcome of suspected thermotolerant coliform bacteria and confirmed E. coli from media incubated at 44/44.5 °C. For the analysis of suspected thermotolerant coliform bacteria the national methods are used in a greater extent then EN ISO 9308-1:2000. A slight difference exists between the methods in mixture C according to table 8A. The Finnish standard has there yielded lower results despite that all the results were obtained after incubation at 44 °C. There are too few results in table 8B to make any interpretations regarding
E. coli.
According to table 9 there might be slight differences in the outcome based on different primary media independent of which method standard served as base. Table 9 Number of results, outliers excluded, with different method variants in the
analysis of coliform bacteria (A) and E. coli (B) with membrane filtration
A. Coliform bacteria MF Total Mixture
no. of A B C
answ. n Mv 1 n Mv 1 n Mv 1
Medium 95 83 68 81 156 76 1082
m-Endo Agar/Broth LES 64 56 71 54 166 52 1116
”LTTC Agar” 2 26 24 65 24 137 21 1026 Chromocult Agar 1 1 11 1 158 1 1000 Other 3 2 39 2 115 2 844 Incubation temperature 95 83 68 81 156 76 1082 35 °C 25 23 72 22 157 22 1180 36 °C 18 16 60 15 161 14 1088 37 °C 50 42 68 42 151 38 1018 Other 2 2 71 2 189 2 1203
Table 9 continued
B. Escherichia coli MF Total Mixture
no. of A B C
answ. n Mv 1 n Mv 1 n Mv 1
Medium 35/36/37 °C 3 53 47 40 47 0 47 601
m-Endo Agar/Broth LES 37 34 40 33 0 34 618
”LTTC Agar” 2 13 11 48 12 0 11 565 Chromocult Agar 1 1 9 1 0 1 600 Other 1 1 9 1 0 1 420 Medium 44/44.5 °C 4 11 11 41 11 0 11 605 m-FC Agar/Broth 8 8 40 8 0 8 532 ”LTTC Agar 2 2 2 39 2 0 2 664 Other 1 1 47 1 0 1 1200 Incubation temperature 90 83 41 83 0 83 600 From 35/36/37 °C 53 48 40 48 0 48 596 From 44/44.5 °C 15 15 41 15 0 15 614 From both 36 or 44 °C 21 19 45 19 0 19 613 Other 1 1 42 1 0 1 400
1 Mean values calculated based on square root transformation
2 m-Lactose TTC (2,3,5-triphenyltetrazolium chloride) Agar + Tergitol 7 (heptadecylsulphate) according to EN ISO 9308-1:2000
3 Results regarding confirmed E. coli; from method information for coliform bacteria
4 Results regarding confirmed E. coli; from method information for thermotolerant coliform bacteria – this is the reason why fewer results are present here for than for E. coli in total at 44/44.5 °C
Lactose TTC Agar yields the lowest results for coliform bacteria in mixture B (table 9A). This outcome is, of course, a result of the fact that this medium is the one given in the reference method XX-EN ISO 9308-1. Equally low results was obtained for that method when the methods were compared. No effect of the incubation temperatures was visible.
For E. coli, there was no clear tendency in relation to the media (table 9B). This time there is even no indication of lower recovery for E. coli when the media are incubated at 44/44.5 °C compared to at 36 ± 2 °C.
Results for Clostridium perfringens with different method variants
The analysis of Clostridium perfringens is performed in different ways in different countries and laboratories. This is probably due to the fact that no international standard is stated as reference method in the European drinking water directive (1).
The parameters to be analysed are spores and vegetative cells of C. perfringens. At the time when that was decided, there was no international standard for water analyses. Therefore, one method was explicitly stated in the drinking water directive, namely usage of m-CP Agar at 44 °C. It includes a confirmatory step with ammonia vapour that makes C. perfringens colonies turning red.
Since many countries were unfamiliar with that method and as there was an ongoing standardisation work, there were desires to use the method processed in the standardisation work. At that time, the method was available as a Committee Draft (CD). An approval of using the most current standard draft was given by the group concerned under the EU commission. The current version at the time was ISO/CD 6461-2:2002-12-20. Since then, no new drafts have been published. Certain changes or additional paragraphs to the draft mentioned have been decided upon later at ISO standardisation meetings. These decisions may also be used and should have been conveyed by the representatives of the national standardisation bodies. This information has also been conveyed to participating laboratories by means of PT round instructions from the National Food Administration.
Another method that has been used is the older method for analysis of sulphite reducing clostridia, EN ISO 26461-2:1993. It may have been used as it is, with or without heating of the sample, or after a modification which makes it comparable to Table 10 Total number of method information answers and outcome of the results
(outliers excluded) with different methods in analysis of Clostridium perfringens in mixture A and B
Method/"Standard" Total Mixture
no. of A (pres. 1) A (conf. 1) B (pres. 1) answ. n Mv 2 n Mv 2 n Mv 2 With stated method, total 57 44 42 34 38 45 3
EN ISO 26461-2:1993 3 8 6 51 5 48 6 4 ISO/CD 6461-2:2002 4 27 25 43 9 44 26 4 EU directive (m-CP Agar) 5 13 8 33 13 33 8 1 DS 2256 6 2 1 42 2 25 1 3 Other 1 1 52 0 – 1 2 Unknown 6 3 38 5 36 3 4
1 pres. = presumptive C. perfringens; conf. = confirmed C. perfringens
2 Mean values calculated based on square root transformation
3 Water quality — Detection and enumeration of sulphite-reducing anaerobes (clostridia), Part 2:
Method by membrane filtration (ISO 6461/2:1986)
4 Water quality — Detection and enumeration of Clostridium perfringens, Part 2: Method by MF
5 Council Directive 98/83/EC of 3 November 1998 (see reference 1)
ISO/CD 6461-2:2002. Such a modification is e.g. the introduction of confirmation steps.
It is in many cases unclear exactly how the methods have been used. It is clear from table 10 that the mean values for the laboratories that reported presumptive results are lower in mixture A as well as in mixture B when m-CP Agar was used, in comparison to the two other methods used with more than 3 results. This is in agreement with the results reported in spring 2008 (5). In this round also the confirmed results follow the same trend, though they are shown only for mixture A. The confirmed results in mixture B are equally low as the presumptive ones making the absolute differences between methods very small.
When using m-CP Agar, there are no special presumptive results really, but they ought to be identical with the confirmed results. This seems to be true for mixture A, although results have not always been given by the same laboratory for both categories. In mixture B the average for 13 laboratories stating the use of m-CP Agar was 2 cfu/100 ml for (confirmed) C. perfringens. The total average for all methods was there 3 cfu/100 ml.
From table 10 it is clear that laboratories that have used EN ISO 26461-21993 in any way have obtained the highest average, at least in mixture A.
Table 11 Total numbers of method information answers and outcome of the results
(outliers excluded) with different substrates and different incubation temperatures in analysis of Clostridium perfringens in mixture A and B
Method variant Total Mixture
no. of A (pres. 1) A (conf. 1) B (pres. 1) answ. n Mv 2 n Mv 2 n Mv 2
Substrate 57 44 42 34 38 45 3
“PAB/TSC Agar” 44 °C 3 37 32 44 16 45 33 4
“SFP Agar” 4 2 1 49 1 49 1 9
m-CP Agar 5 15 9 34 15 32 9 1
Iron Sulphate Agar 6 2 1 42 2 25 1 3
Other 1 1 46 0 – 1 3
Unknown 0 0 – 0 – 0 -
1 pres. = presumptive C. perfringens; conf. = confirmed C. perfringens
2 Mean values calculated based on square root transformation
3 Perfringens Agar base / Tryptose Sulphite Cycloserine Agar; was here used with D-cycloserine.
4 SFP Agar contains Polymyxine & Kanamycine.
5 m-CP Agar contains D-cycloserine & Polymyxine.
In total 25 out of 57 laboratories have given results for both presumptive and confirmed C. perfringens. Thus, it is only partly the same laboratories that have reported both presumptive and confirmed results. This explains the apparently lower results for confirmed compared to presumptive C. perfringens in mixture A.
The results obtained with different media and to some extent other conditions, regardless of which method was stated by the laboratories, are made clear in table 11. As above, considerably lower results can be observed with respect to m-CP Agar, in particular in mixture A.
All accepted analytical results were obtained after anaerobic incubation, most of them after incubation at 44 °C.
The outcome of deviating results – judgement
The reported results from all laboratories are accounted for in annex A. A summary of the results from each laboratory in annex A – apart from false results – is given by a box plot in figure 2. The lesser range from smallest to largest value, and the more centred around the standard value zero, the greater is the similarity among the laboratory results and those averages obtained by pooling all accepted laboratory
results.
The laboratories are not grouped or ranked based on their results. The judgement that is made aims to clearly give information regarding the number of false results and outliers. These are presented in the tables below the box plots. Besides, false results and outliers are shaded and put in boldface in annex A. There are also limits for lowest and highest value accepted in each analysis stated in the summarizing rows at the bottom of annex A.
Annex C with z-values are not commented or evaluated specifically here. They are the base for the box plots. They are mainly given to simplify the follow-up process for those laboratories that want to use z-values.
In cases where it is obvious, it is also stated if a laboratory has mixed up the analytical results. If whole mixtures have been mixed up, it is shown by crossing out the sample numbers in question in annex A.
Laboratories that have not reported their results have to compare their results themselves with the corresponding ones from other laboratories in annex A.
For description of how the analytical results have been treated and for recommendations on how follow-up of the results may be done, please see the scheme protocol (3). It is found as a PDF document on the website of our schemes www.slv.se/absint.
Figure 2 Box plots and number of deviating values for each participating laboratory.
The square root transformed results of a laboratory is converted into standardised values (z-value) to be able to compare the different analyses.
- Standardised values are calculated from the formula z = (x – mv) / s
- Standardised values > +4 and < −4 have in the plots received the values +4 and −4, respectively.
- False results do not generate z values and are not included in ‘No. of results’.
False positive results cannot be illustrated in the box plots. The no. of false positives and false negatives are clear from the table beneath the plots.
- The outliers are included in the plots after recalculation to standardised values
with the same s values as the rest of the results. The nos. is clear from the table.
- The horizontal line in each box indicates the median of the laboratory.
- The two box area parts embrace 25% of the results above and below the median,
respectively. The lines reaching out from the box and/or the circles embrace the remaining 50% of the results, false results excluded.
- A circle is created when a result is highly deviating* from the rest.
- The background is decorated with lines and shaded fields to indicate ranges in
order to simplify localisation of the laboratory results.
_________________
* < [smallest value of the box - 1.5 × (largest value of the box - smallest value of the box)] or > [largest value of the box + 1.5 × (largest value of the box - smallest value of the box)]
z-val ue Lab no. 1124 1131 1132 1149 1237 1254 1290 1545 1594 1611 1753 1868 1970 2050 2386 2670 2704 2745 3042 3055 No. of results 2 17 11 2 9 15 10 21 15 20 24 24 21 24 15 7 18 9 27 -False positive - 1 - - - - 1 - - - -False negative 1 - 1 1 - - 1 - - 1 - - - 2 - - - -Low outliers - - 1 - 3 - 2 - - - 3 - - 1 -High outliers - - - 2 - - 1 - - - 2 - - 1 -False negative ? - - - - -RSZ -4 -2 0 2 4
z-val ue Lab no. 3076 3135 3159 3162 3305 3339 3475 3511 3533 3588 3730 3868 4015 4064 4180 4278 4288 4319 4339 4343 No. of results 3 10 18 24 17 14 18 9 6 15 3 27 24 9 8 5 3 9 24 24 False positive - 1 - - 1 1 - - - -False negative - 1 - - - 1 - - - -Low outliers - - - 2 - - - -High outliers - 4 - - - 1 - - 2 - - - 1 - - - -False negative ? - - - - -RSZ -1,04 8,3 -0,27 -0,65 -1,25 3,3 -0,73 -0,62 4,44 -0,28 0,91 1,54 -0,6 -2,15 -1,46 40,7 -1,19 -1,17 0,13 -1,63 SD 0,85 3,66 0,95 0,67 0,91 1,3 0,71 1,12 5,02 0,37 0,41 0,57 1,02 1,02 0,54 43,6 0,69 0,61 0,84 0,96 z-val ue Lab no. 4356 4459 4539 4633 4713 4723 4889 4980 5018 5094 5120 5188 5201 5220 5447 5553 5701 5950 6180 6253 No. of results 21 15 12 15 21 18 17 18 27 13 27 9 9 9 21 9 24 27 21 9 False positive - - - 1 - - - -False negative - - - 1 - - - -Low outliers - - - -High outliers 1 - - - 1 - - 1 - - - -False negative ? - - - - -RSZ 7,88 0,33 0,51 0,01 0,87 -0,03 2,99 -1,16 -0,19 42,1 1,25 -0,23 -3,2 -3,45 -0,7 -0,3 1,17 1,44 2,24 0,75 -4 -2 0 2 4 -4 -2 0 2 4
z-val ue Lab no. 6456 6731 7096 7191 7235 7248 7302 7395 7428 7442 7497 7596 7626 7688 7728 7876 7896 7930 7962 7968 No. of results 13 9 11 - - 24 24 15 18 15 15 21 27 18 9 24 21 18 20 27 False positive - - 1 - - - -False negative 2 - - - 1 -Low outliers - 5 - - - -High outliers - - - 2 - - - - 1 - - - -False negative ? - - - - -RSZ 0,89 -12,7 -0,92 - - 1,9 0,78 4,98 1,45 0,19 2,04 0,43 2,98 0,25 1,54 1,25 -1,64 0,03 -2,4 0,13 SD 0,55 3,98 1,36 - - 0,76 0,74 4,4 0,77 0,59 0,85 0,41 2,78 1,08 0,95 0,95 0,72 0,6 0,95 0,69 z-val ue Lab no. 8068 8255 8260 8329 8365 8380 8435 8569 8598 8626 8628 8663 8742 8751 8766 8862 8898 8955 9002 9359 No. of results 21 21 14 18 15 12 15 9 3 9 16 15 3 9 24 24 24 18 8 26 False positive - - 1 - 4 - - - 2 - - - -False negative - - - - 2 - - - 1 1 Low outliers 1 - - - 5 - - - 1 - - - -High outliers - - - - 2 1 - - - -False negative ? - - - - --4 -2 0 2 4 -4 -2 0 2 4
z-val ue Lab no. 9436 9451 9465 9569 9655 9736 9897 9899 9903 No. of results 27 15 15 27 8 24 15 18 18 False positive - - - - 1 - - - -False negative - - - -Low outliers - - - - 1 - - - -High outliers - - 1 - - - -False negative ? - - - - -RSZ -3,84 -0,6 1,89 0,18 -4,2 -0,25 0 1,17 -0,52 -4 -2 0 2 4
References
1. Anonymous 1998. Council Directive 98/83/EC of 3 November 1998 on the quality of water intended for human consumption. Official Journal of the European Communities. 5.12.98, L 330/32-54 (there are national translations). 2. Peterz, M., Steneryd, A.-C. 1993. Freeze-dried mixed cultures as reference
samples in quantitative and qualitative microbiological examinations of food. J. Appl. Bacteriol. 74:143-148.
3. Anonymous 2007. Proficiency Testing Schemes, Protocol, Microbiology, Drinking water & Food. National Food Administration, Uppsala, 26 p.
4. Kelly, K. 1990. Outlier detection in collaborative studies. J. Assoc. Off. Chem. 73:58-64.
5. Šlapokas, T., Gunnarsson, C., Jentzen, A. 2008. Proficiency Testing, Drinking water microbiology, 2008:1 March. National Food Administration report no. 13-2008, Uppsala, 37 s.
6. Šlapokas, T., Lantz, C., Olsson M. 2010. Proficiency Testing, Drinking water microbiology, 2010:1 (March). National Food Administration report no. 9-2010, Uppsala, 40 p.
7. Niemi, R. M., Mentu, J., Siitonen, A., Niemelä, S. I. 2003 Confirmation of
Escherichia coli and its distinction from Klebsiella species by gas and indole