Master
's thesis • 30 credits
Agricultural programme – Economics and Management
Does Environmental Party Representation
Matter for Investments in Green
Infrastructure?
-
a Regression Discontinuity Approach
Swedish University of Agricultural Sciences Faculty of Natural Resources and Agricultural Sciences Department of Economics
Does Environmental Party Representation Matter for
Investments in Green Infrastructure? – a Regression
Discontinuity Approach
Angelica Jörnling
Supervisor: Robert Hart, University, Swedish University of Agricultural, Department of Economics
Justice Tei Mensah, Swedish University of Agricultural, Department of Economics
Jens Rommel, Swedish University of Agricultural Sciences, Department of Economics Supervisor: Examiner: Credits: Level: Course title: Course code: Programme/Education:
Course coordinating department: Place of publication: Year of publication: Name of Series: Part number: ISSN: Online publication: Key words: 30 credits A2E
Master thesis in Economics EX0907
Agricultural programme
– Economics and Management 270,0 hp Department of Econnomics
Uppsala 2019
Degree project/SLU, Department of Economics 1226
1401-4084
http://stud.epsilon.slu.se
environmental party, green infrastructure, sharp regression discontinuity design, Sweden
Abstract
For the 2014 election the Environmental Party, which is a small single issue party, revealed an election manifesto for the forthcoming electoral period, where they promised to establish more charging spots for electric vehicles and to make electric vehicles more accessible. The aim of the study is to examine to what extent investments in green infrastructure are affected by Environmental Party representation on a local level. A sharp regression discontinuity design is applied where the governing coalition in local councils’ changes discontinuously at 50% of the seat shares, to estimate the causal effect of Environmental Party representation on investments in green infrastructure. The results show that there is a positive causal effect of Environmental Party representation on investments in green infrastructure. However, one key assumption of the regression discontinuity design is probably violated, indicating that the governing coalitions are not as good as randomly assigned. Thus, the causal interpretation of the results must be treated cautiously. Moreover, in order to distinguish if it is Environmental Party representation that drives investments in green infrastructure on a local level, other factors such as bargaining power should be taken into account.
iv
Sammanfattning
Inför valet 2014 lanserade Miljöpartiet ett valmanifest för den kommande mandatperioden där de lovade att etablera fler laddpunkter för elbilar och att öka tillgängligheten av elbilar i Sverige. Uppsatsen syftar till att undersöka i vilken utsträckning investeringar i grön infrastruktur påverkas av om Miljöpartiet ingår i den styrande koalitionen i Sveriges kommuner. I studien används en metod kallad sharp regression discontinuity design för att estimera den kausala effekten av att miljöpartiet ingår i den styrande koalitionen på investeringar i grön infrastruktur, där makten i kommunfullmäktige ändras diskontinuerligt vid 50 % av andelen platser. Resultaten visar att det sannolikt finns en positiv kausal effekt av att Miljöpartiet ingår i den styrande koalitionen på investeringar i grön infrastruktur, närmare bestämt investeringar i laddpunkter. Resultaten bör emellertid tolkas med viss försiktighet på grund av att ett av metodens nyckelantaganden, att de styrande koalitionerna ska vara slumpmässiga, inte är uppfyllt. För att kunna avgöra om Miljöpartiets representation i styrande koalitioner driver investeringar i grön infrastruktur är det nödvändigt att även inkludera andra faktorer, såsom vilken förhandlingskraft Miljöpartiet har inom koalitionen.
Table of Contents
1 INTRODUCTION ... 1
2 LITERATURE REVIEW ... 3
3 METHOD ... 6
3.1 Theoretical Framework ... 6
3.2 Sharp Regression Discontinuity Design ... 7
3.3 Identification and Estimation ... 8
4 DATA ... 9
5 RESULTS AND ANALYSIS ... 11
5.1 Regression results ... 11 5.2 Graphical Analysis ... 13 6 DISCUSSION ... 15 6.1 Results ... 15 6.2 Limitations ... 16 7 CONCLUSION ... 18 REFERENCES ... 19
vi
List of figures
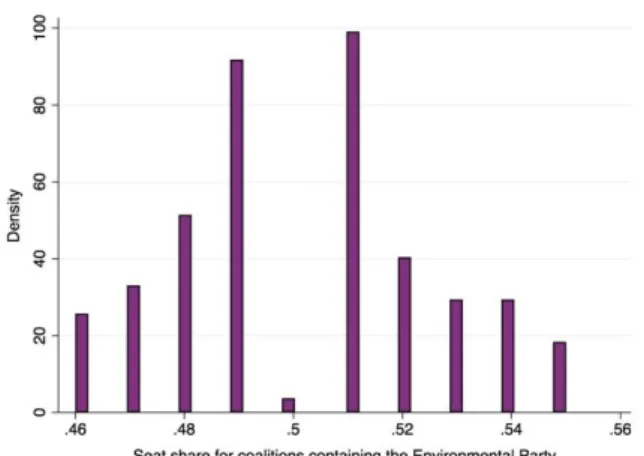
Figure 1. The effect of Environmental Party representation on charging spots (whole sample) …... 14 Figure 2. The effect of Environmental Party representation on charging spots (narrow window) ….... 14 Figure 3. The effect of Environmental Party representation on electric vehicles (whole sample) …… 14 Figure 4. The effect of Environmental Party representation on electric vehicles (narrow window) ….. 14 Figure 5. Density for the seat share for coalitions containing the Environmental Party ………. 16
List of tables
Table 1. Governing coalitions in Sweden’s local governments between 2014 and 2018. …………..… 9 Table 2. Summary statistics ... 10 Table 3. The estimated causal effect ...………... 12
1 Introduction
The object of this study is to estimate the causal effect of Environmental Party representation on investments in green infrastructure. Swedish municipality councils have a constitutional right of self-government and have a large freedom to organize its activities, one of which is the responsibility to organize local infrastructure (Sveriges kommuner och landsting, 2019). One way to organize local infrastructure, and stimulate investments in green infrastructure, is to promote the establishment of charging spots. The municipality can drive the establishment of charging infrastructure by making sure that charging spots are established to a sufficient extent in streets and parking areas, and in connection with exploitations and land acquisitions (Sveriges kommuner och landsting, 2017). Investments in charging spots are often financed through corporation between municipalities and private investors, i.e. where private investors finance the equipment and electrical supply while the municipality provides land. This means that the development of charging spots can be affected by the policy of the municipality government, even if the charging spots are installed by private investors.
The political system in Sweden is based on proportional representation, both at a national and at a local level, meaning that the seats of the council are proportionately distributed based on each party’s vote share. In Sweden, it is unusual that one party holds a majority in the council, and in order to obtain majority parties often form coalitions. One of the established parties is the Swedish Environmental Party, mainly focusing on environmental policy. For the 2014 election the Environmental Party revealed an election manifesto for the forthcoming electoral period. In the manifesto they promised to establish more charging spots for electric vehicles and to make electric vehicles more accessible (Miljöpartiet, 2014). Therefore, it is interesting to examine to what extent investments in green infrastructure, in this case investments in charging spots for electric vehicles, are affected by Environmental Party representation on a municipal level. Due to the Environmental Party’s election manifesto it is also of interest to examine if Environmental Party representation at a local level affect the number of registered electric vehicles. The research question is: Does Environmental Party representation in majority coalitions lead to more investments in green infrastructure at a local level? The study will contribute to the academic field of analysing the causal effect of political representation on policy outcomes, with specific regard to policy outcomes connected to investments in green infrastructure, and should therefore be of interest to politicians, political analysts and those concerned in the industry of charging infrastructure and electric vehicles.
To estimate the causal effect of Environmental Party representation on investments in green infrastructure a quasi-experimental setting named sharp regression discontinuity design is implemented. The method is characterized by assigning a treatment to a subject, based on whether the subject fall above or below a fixed threshold on a rating variable (Lee, et al., 2004). Thus, if the subject receives a rating variable equal to or greater than the fixed threshold, the subject is assigned to the treatment, causing a discontinuity at the threshold. One institutional feature of the election system is that the political power changes discontinuously at 50% of the seat shares (Pettersson-Lidbom, 2008), thus the fixed threshold is 50% and seat share is the forcing variable or assignment variable. The regression discontinuity design is based on the assumption that subjects who are just below and above the fixed threshold are on average identical to each other, except for the exposure of the treatment.
Of 290 municipalities in Sweden, 196 had a governing majority coalition after the 2014 election. Applying a sharp regression discontinuity design requires a municipality to have a governing majority coalition, why 94 municipalities with governing minority coalitions have been excluded from the sample. The Swedish municipalities are quite similar to each other,
2
which is an attractive feature when estimating the causal effect of party representation on policy implementation (Pettersson-Lidbom, 2008). The municipalities share a common political framework and serve the same public purpose, meaning that the political parties and the economic outcomes are relatively comparable. A potential weakness with the data set is that the panel data set is relatively small, only covering a period of five years. Another weakness with the data set is the multi-party feature of the Swedish political system, which sometimes leads to a mix of parties in the governing coalition at a local level, i.e. a mix between left- and right-wing parties. The sharp regression discontinuity design requires a bipartisan political system, thus the question of interest is whether the Environmental Party is represented in the governing coalition or not, thereby creating a bipartisan political system. However, this does not take into account the bargaining power of the Environmental Party within the governing coalition.
The results show that there is a positive estimated causal effect of Environmental Party representation in governing coalitions on investments in green infrastructure, and also on the number of registered electric vehicles. Municipalities where the Environmental Party is represented in the governing coalition have on average approximately 0.6% more installed charging spots per population per unit area than municipalities where the Environmental Party is not represented in the governing coalition, thus more investments in green infrastructure. Further, municipalities where the Environmental Party is represented in the governing coalition have approximately 11% more electric vehicles per population per unit area. The results are supported by various specification checks of the estimated model. However, the results need to be interpreted with caution, since one of the key assumptions of the regression discontinuity design probably is violated, because subjects’ value of the forcing variable may be manipulated which means that there is reason to believe that the governing coalitions are probably not as good as randomly assigned (Smith, et al., 2017).
The paper is structured as follows. Section two provides an overview of the literature regarding the causal effect of political representation on policy outcomes. The choice of method and model is discussed and presented in section three. The applied data is presented in section four. In section five the empirical results are presented and analysed with the use of tables and graphs. The results and limitations of the study are then discussed in section six. Section seven include concluding remarks.
2 Literature Review
To study the causal effect of political representation on policy implementation and economic outcomes is relatively new, starting with Lee, et al. (2004). Subsequent research present different opinions about what effect political representation has on policy implementation and economic outcomes. Studies by Ferreira and Gyourko (2009) and Warren (2008) show that party representation on a local and middle ground of state government does not affect policy outcomes in the U.S. However, studies based on Swedish data, by Pettersson-Lidbom (2008) and Folke (2014) instead show that there is a causal effect of political representation on policy implementation and economic outcomes.
According to Lee, et al. (2004) there are two different perspectives on what role elections have on policy formation, and the aim of their study is to assess which of these views is more empirically relevant for the U.S. House of Representatives. Perspective one suggest that voters can affect the policy choices of the political candidates’, hence the competition for votes cause the political candidates to move policies toward the political centre. According to the second perspective voters only elect polices, and elections are only means to decide which candidate’s preferred policy will be implemented. In order to examine which of these fundamentally different views is more empirically relevant for the U.S. House of Representatives, Lee, et al. (2004) estimate the causal effect of political representation on following voting records in the U.S. House of Representatives. In order to perform the study, they examine the extent to which a democrat holding the seat is more liberal than voting records of winners of elections where a republican held the seat. To examine the causal effect of political representation on voting records in the U.S. House of Representatives, they use a regression discontinuity design which isolate exogenous variation in who has the electoral advantage. This will generate “random assignment” of which party holds the seat. One important assumption of the design is that districts where either the Republicans or the Democrats barely won are comparable in all other ways. The assignment variable is the vote share data (1946-1995). This means that when the Democrats’ vote share is equal to or above the 50% threshold, the candidate from the Democratic party gets to vote in the U.S. House of Representatives. The outcome variable is the average of the roll-call voting records of the winners in the elections, where a higher “Americans for Democratic Action” (ADA) score correspond to a more “liberal” voting record. The results show that there is a discontinuity at the threshold, which suggest that voters do not seem to affect politicians’ choices hence the second perspective is more relevant for describing roll call voting patterns of the U.S. House of Representatives. However, if instead, there were no jump at the threshold, the first perspective would have been more relevant. The conclusion of their study is that political representation has no effect on the elected candidate’s voting behaviour, hence candidates with less electoral support do not adopt more moderate positions than stronger candidates, when in the House of Representatives. The study by Lee, et al. (2004) is primarily interesting since it is an early study where a regression discontinuity design is used to examine the causal effect of political representation on elected candidates’ voting patterns in the U.S. House of Representatives, using vote share as the assignment variable and a threshold of 50%. However, the study does not examine whether or to what extent political representation affect policy outcomes.
Unlike Lee, et al. (2004) who study political partisanship on a federal level, Ferreira and Gyourko (2009) examined the effect of political representation on policy outcomes at a local level in the U.S.. They apply a regression discontinuity design on 2000 direct mayoral elections in over 400 U.S. cities between the years 1950 and 2000. As Lee, et al. (2004), the authors compare subjects (e.g. cities) where the Democratic candidate barely won an election with subjects where the Democratic candidate barely lost. The study by Ferreira and Gyourko (2009)
4
is the first study of the impact of political representation at a local level in the U.S.. They examine the causal effect of political representation on the outcome variables: size of city government, composition of local public expenditures, and crime rate. The results show that there are no partisan differences in policy outcomes at a local level, and that it has little or no impact on the political outcomes whether the mayor is a Democrat or Republican.
The study by Warren (2008) also examines the impact of political representation, but at a middle ground of state government in the U.S.. Warren (2008) implement a regression discontinuity design to identify the effect of party representation on some policy outcomes; tax burden and minimum wage. The results show that there is little or no causal effect of political representation on policy outcomes. These two papers, Ferreira and Gyourko (2009) and Warren (2008), are relevant for this study since they both examine the causal effect of political representation on some policy outcomes at a local and middle ground level of government in a bipartisan political system. This study however, include other policy outcomes than the studies by Ferreira and Gyourko (2009) and Warren (2008).
All of the above mentioned articles regard U.S. elections and the U.S. bipartisan electoral system. The article by Pettersson-Lidbom (2008), on the other hand, use a data set for Swedish local elections, and examine the causal effect of political representation on fiscal and economic policies. Since the electoral system in Sweden is based on proportional representation and consists of a number of parties, the author looks at the two political blocks in Sweden, the left- and right-wing, and thereby treating the Swedish electoral system as bipartisan. By doing so, it is possible for the author to implement a regression discontinuity design, because the political control changes discontinuously at 50% of the vote shares. This makes it possible to compare policy outcomes for those municipalities who’s voting record is just below and just above the fixed threshold, assuming they are on average identical to each other, except for the exposure of the treatment (e.g. political control). The data set consists of 288 Swedish municipalities over a 21-year time period. The results show that there is a causal effect of political representation on the outcome variables spending, taxes, and unemployment. To verify the results, the author applies three different specification checks to the Regression discontinuity design. The paper by Pettersson-Lidbom (2008) is relevant to my research since it also studies the Swedish electoral system at a local level. However, at a local level there are often mixed political coalitions, i.e. coalitions that include parties from both the right-wing and the left-wing blocks. This study will use much of the same methodology as the study by Pettersson-Lidbom (2008), but instead of examining right- and left-wing coalitions the determinant of this study will be whether the governing coalition include the Environmental Party or not and use investments in green infrastructure as the policy outcome.
Since Sweden have a proportional representation system with many parties, Pettersson-Lidbom (2008) treats the system as bipartisan to examine the causal effect of party representation on some policy outcomes. Folke (2014) solves the problem regarding the feature of Sweden’s proportional representation system by developing a new methodology, examining the causal effect of party representation on immigration policy, environmental policy, and tax policy. A proportional representation election system often consists of a number of small and big parties, and it is uncertain whether and to what extent individual parties shape policy. Folke (2014) states that there is no suitable method for estimating the effect of party representation on policy outcomes in this type of election system, but however makes an attempt to fill this methodical gap. A common solution to estimate the causal effect is to adopt a regression discontinuity design. However, applying this approach to this setting is not possible, as individual parties rarely hold a majority of either the vote share nor the seat share. This motivated Folke (2014) to develop a new methodological framework, in which identification of the causal effect is
based on being close to a threshold for a shift in the seat allocation between parties, instead of the threshold for a majority change. To estimate the causal effect of political representation on immigration, environmental policy, and tax policy Folke (2014) used a data set of 290 municipalities over a 20-year time period. The environmental policy outcome is based on an environmental ranking of all Swedish municipalities, why it is appropriate to consider the environmental ranking as an approximation rather than an absolute measure of the environmental policy performance. The indicators used in the ranking include measures of sustainable procurement, recycling programs, doing environmental audits, and “green” information to the inhabitants. The results show that changes in political representation have a large and significant effect on immigration and environmental policy. However, Folke (2014) does not find any evidence that changes in political representation affect the municipal tax rate. In contrast to Folke (2014), this study examines policy outcomes connected to infrastructure and environment. The methodology developed by Folke (2014) is quite new and thus not widely used in research. Due to time constraints the simpler methodology by Pettersson-Lidbom (2008) will be used in this study.
To summarize this section, in previous research the regression discontinuity design has been used to examine the causal effect of political representation on some policy outcomes, mainly economic and fiscal policies. However, Folke (2014) examines the effect on environmental policy, but without a factual environmental outcome, rather an approximation outcome. Therefore, this study examines the causal effect of political representation on investments in green infrastructure in Sweden, using an absolute measure of investments in green infrastructure as an outcome variable. This study aims to fill a gap by estimating the causal effect of governing coalitions, where the Environmental Party is represented, on investments in green infrastructure at a local level in Sweden.
6
3 Method
In this section the choice of method will be discussed and argued. Then, the features of the regression discontinuity design are presented, and finally the model and approaches of the design are presented.
3.1 Theoretical Framework
In recent years the regression discontinuity design has become a popular method for identifying causal effects (Mattei & Mealli, 2016). The method was developed by Thistlethwaite and Campbell (1960), and then developed further by Hahn, et al. (2001), regarding identification and estimation. McCrary (2008) presented tests to guarantee validity, and Frölich (2007) included the use of covariates. Previous papers in economics have used thresholds such as geographical, collage applications and elections (Black, 1999; Van Der Klaauw, 2002; Lee, 2008).
Thistlethwaite and Campbell (1960) used the sharp regression discontinuity design to examine the causal effect of scholarships on students’ career ambitions. In the study, the decision on whether to award a student with a scholarship or not was primarily based on a test score, where the students who scored equal or above a fixed threshold were rewarded the scholarship, while students who scored below the fixed threshold were rejected the scholarship. This generated a sharp discontinuity in the treatment as a function of the test score. When applying the regression discontinuity design, the basic assumption was that students’ who scored just below the threshold and students who scored just above the threshold are similar to each other except for the treatment, in this case, being awarded a scholarship or not.
In a sharp regression discontinuity design the probability of receiving the treatment changes discontinuously at the threshold, thus the binary treatment variable changes from zero to one at the threshold (Lee, et al., 2004). Another approach of the regression discontinuity design is the fuzzy regression discontinuity design, where the probability of receiving the treatment can take on any value between zero and one. In the fuzzy design, subjects can be placed in the control group when, according to the sharp design, they should have been placed in the treatment group, or vice versa, according to their assignment score (Cappelleri & Trochim, 2015), such subjects are known as crossovers. Therefore, to obtain an unbiased treatment effect in the fuzzy regression discontinuity design, instrumental variables are needed. The fuzzy design is often used for cases where the subjects are located close to the threshold. For example, students who are not accepted to a specific program due to a test score just below the threshold, may successfully argue that they should be assigned to it based on other factors than their assignment score.
Cappelleri & Trochim (2015) argues that misassignment (e.g. crossovers) should be avoided if possible. The sharp design will allow the outcome variable to be related to the assignment variable, unlike with a fuzzy design, where the outcome variable is related to a certain instrument (Van Der Klaauw, 2002). The sharp regression discontinuity design makes it relatively easy to estimate the treatment effect, and the results can be illustrated with the use of graphical methods. Another advantage over the fuzzy design is that the model of the sharp design does not need to be specified, thus it avoids questions regarding which variables to include and the functional form of the variables (Hahn, et al., 2001). The sharp regression discontinuity design will therefore be implemented in this study. However, there are limitations to the sharp regression discontinuity design, because it can only identify the estimated causal
effect locally, where the chance of receiving the treatment changes discontinuously, from zero to one.
Another reason for using the sharp regression discontinuity design and not i.e. an ordinary least square (OLS) regression is because governing coalitions are not randomly assigned (Pettersson-Lidbom, 2008). Due to voter preferences that are difficult to measure, i.e. that voters may prefer different parties or types of government due to factors such as the social environment (e.g. a recession) at the time of the election, there is a risk of omitted variables when voters cast their votes for parties. Thus, the electoral advantage of a governing coalition is endogenously determined, and the assignment variable, 𝑥𝑖, will be correlated to the error term which makes the estimate of the OLS regression biased. The sharp regression discontinuity design on the other hand isolates this exogenous variation in 𝑥𝑖, and this variation can be used to identify the causal effect of 𝑥𝑖 on 𝑌𝑖𝑡 (Lee, et al., 2004).
3.2 Sharp Regression Discontinuity Design
The sharp regression discontinuity design is a quasi-experimental approach, and the method is implemented in settings where subjects are either assigned to a treatment group or a control group, based on whether the subject is above or below a fixed threshold on a continuously measured scale (Smith, et al., 2017).
𝑇𝑖 = { 1 𝑖𝑓 𝑥𝑖 ≥ 𝑥0 0 𝑖𝑓 𝑥𝑖 < 𝑥0
The variable 𝑥𝑖 is a continuous forcing variable or an assignment variable, 𝑥0 is the threshold while 𝑇𝑖 is a binary treatment variable (Pettersson-Lidbom, 2008). If the observed value of a forcing variable 𝑥𝑖 is equal to or greater than a fixed threshold 𝑥0, the subject is assigned to the treatment group. However, if the observed value 𝑥𝑖 is less than the fixed threshold, the subject is assigned to the control group. Thus, the treatment threshold, 𝑥0, separates the subjects into
two groups: subjects receiving the treatment (𝑇𝑖 = 1) and subjects that do not receive the
treatment (𝑇𝑖 = 0).
A key assumption when applying the regression discontinuity design is that when comparing the outcomes for subjects whose value of the forcing variable are just below and just above the fixed threshold, the subjects are assumed to be similar in all other ways, aside from the assigned treatment (Pettersson-Lidbom, 2008). This means that the treatment status will be randomized in a narrow window of the threshold. Thus, when comparing subjects in a narrow window on either side of the threshold, the difference between the subjects are likely due to the treatment. If for example, investments in green infrastructure are significantly higher for municipality councils above the threshold, it indicates that the variation is due to the discontinuity and not due to any other confounding factors. The assignment variable in this paper is the seat share for governing coalitions that either include the Environmental Party or not. The threshold used is 50% of the seat shares in the municipal council.
There are also two other assumptions specific to the regression discontinuity design that needs to be considered. Firstly, there must be a discontinuity in the probability of the treatment at the threshold (Smith, et al., 2017). Secondly, groups are either assigned to the treatment or not, in a way that is similar to randomization, meaning that the subjects have not exerted control of the value of the forcing variable, and therefore are unmanipulated.
8
3.3 Identification and Estimation
The regression discontinuity method can be applied in several different ways (Pettersson-Lidbom, 2008), two approaches will be discussed below. The first approach, which is also the simplest, is to only compare average outcomes in a narrow window on each side of the threshold, and thus often only a small number of observations (Pettersson-Lidbom, 2008). However, this approach can induce a risk of an imprecise estimate, since the regression discontinuity method could be subject to sampling variability. The first approach therefore requires large sample sizes to reduce the risk of an imprecise estimate of the treatment. In contrast, the second approach is to use all available data and a control function, and if the control function is correctly specified it will yield an unbiased estimate of the treatment effect. However, if the control function is not correctly specified, it can create a risk of bias, because the control function will capture any correlation between the treatment variable and the error term since the assignment variable is the only systematic determinant of the treatment. To summarize, there is a risk of sampling variability when applying the first approach and the second approach induces the risk of bias in the estimate of the treatment.
Since there are 95 municipalities within ±2 percentage of the 50% threshold in the sample, which is a relatively small number of observations close to the threshold, the second approach will be the preferred method in this paper. However, the first approach will be used as a specification check, where data in a narrow window, [48, 52] and [45, 55], of the threshold will be used (Pettersson-Lidbom, 2008). If the control function of the second approach is correctly specified it will yield the same estimates as the first approach, here used as a specification check. To estimate the causal effect of Environmental party representation on investments in green infrastructure, 𝑌𝑖𝑡, at the fixed threshold 𝑥0 (e.g. 50% seat shares) the following model is used:
𝑌𝑖𝑡 = 𝜇𝑖+ 𝜆𝑡+ 𝜋𝑇𝑖𝑡+ 𝑓(𝑆𝑒𝑎𝑡 𝑠ℎ𝑎𝑟𝑒 𝑓𝑜𝑟 𝑐𝑜𝑎𝑙𝑖𝑡𝑖𝑜𝑛𝑠 𝑐𝑜𝑛𝑡𝑎𝑖𝑛𝑔 𝑡ℎ𝑒 𝐸𝑃)𝜑 + 𝜂𝑖𝑡
where 𝑌𝑖𝑡 is the outcome related to investments in green infrastructure for municipality i in time period t (Pettersson-Lidbom, 2008). The regression model also contains county fixed effect 𝜇𝑖,
year fixed effect 𝜆𝑡 and a binary treatment variable 𝑇𝑖𝑡. The treatment variable adopts the value
one if the governing coalition contains the Environmental Party, and zero if the governing coalition does not contain the Environmental Party. The control function 𝑓(𝑆𝑒𝑎𝑡 𝑠ℎ𝑎𝑟𝑒 𝑓𝑜𝑟 𝑐𝑜𝑎𝑙𝑖𝑡𝑖𝑜𝑛 𝑐𝑜𝑛𝑡𝑎𝑖𝑛𝑔 𝑡ℎ𝑒 𝐸𝑃) with various polynomial stages is also a part of the regression model. The treatment effect or causal effect, 𝜋, measures the average difference in investments in green infrastructure between the governing coalitions that contain respectively do not contain the Environmental Party. The fixed effects are included to improve the efficiency of the model, and there is no need for additional control variables, since the control function is sufficient in order to receive an unbiased estimate of the treatment variable.
However, control variables (e.g. Population density and Disposable income for households) can be added to equation (2) as a specification check to control whether the treatment effect is as good as randomly assigned (Pettersson-Lidbom, 2008). Additional control variables should not affect the estimate of the treatment significantly, since the treatment effect should be as good as randomly assigned conditional on the control function. Further, it is not valid to interpret the coefficients except from the treatment effect, 𝜋, in the specified model (2).
4 Data
There are 290 municipalities in Sweden, and the municipal councils play an important role both for the Swedish economy and in terms of allocation of functions (Pettersson-Lidbom, 2008). The local governments are responsible for i.e. education and to a great extent social welfare. The municipality councils have a constitutional right of self-government and have a large freedom to organize its activities. Other responsibilities include organizing local infrastructure, i.e. traffic planning, traffic safety, public transport and extensive projects within infrastructure (Sveriges kommuner och landsting, 2019).
Every municipality has an elected council acting as the decision-making body. Elections are held every fourth year, and in the local elections 2014 the voter turnout was 82,8% (SCB, 2014). The seats in the council are proportionately distributed, based on each party’s vote share and based on the adjusted odd-number method (Valmyndigheten, 2019). On the national level the political landscape in Sweden has been divided into two wings, the left-wing and the right-wing, but on the municipal level other variances of coalitions often occur. A political landscape with a Proportional Representation system and a number of small parties raise questions on how to define the treatment, why the Swedish electoral system need to be treated as bipartisan (Pettersson-Lidbom, 2008). Such a simplification is necessary in order to define the treatment, and the treatment 𝑇𝑖 will equal one if the governing coalition contain the Environmental Party and zero if not.
The study exclusively focuses on whether a governing coalition include the Environmental Party or not, and based on that estimate the causal effect of Environmental Party representation on investments in green infrastructure. The Environmental Party has been chosen since they were the only party in the 2014 election with a clear alignment to fight environmental issues, who in the election manifesto claimed they wanted to increase the number of charging spots and make electric vehicles more accessible (Miljöpartiet, 2014). According to a report made by Naturskyddsföreningen, the Environmental Party were the party who promised to do most actions for the environment during the electoral period 2014–2018, followed by the Left Party and the Liberal Party (Naturskyddföreningen, 2018).
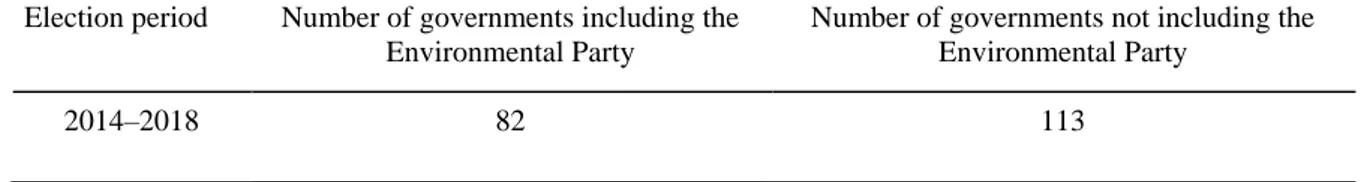
Of 290 Swedish municipalities, the final sample used in this paper consists of the results of elections held in 195 municipalities the year 2014, where 94 municipalities, that are governed by minority coalitions are excluded because the minority coalitions cannot rule without the support of other parties. Moreover, one municipality has been excluded from the sample because all of the established parties are included in a coalition (100 % of the seat shares), thus an outlier. Out of the total 290 municipalities the 195 municipalities in the sample are governed by majority coalitions, which is required when applying a sharp Regression discontinuity design in this setting. Table 1 summarizes the number of local governments where the ruling coalition contained the Environmental Party and the ruling coalitions that did not include the Environmental Party, during the sample period 2014–2018.
TABLE 1. Governing coalitions in Sweden’s local governments between 2014 and 2018.
Election period Number of governments including the Environmental Party
Number of governments not including the Environmental Party
10
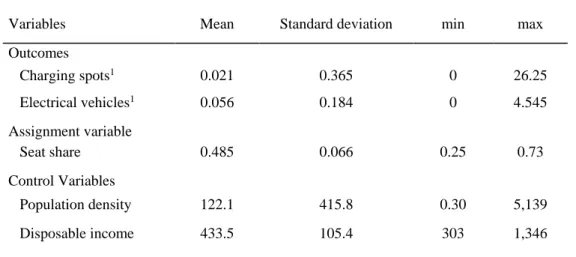
The outcomes used in the analysis are: the number of charging spots installed per population per unit area and the number of registered electric vehicles per population per unit area. The outcomes are divided by the population density, since the most populated municipalities probably will have more charging spots and electric vehicles than rural municipalities. The data set consists of monthly data for the 195 municipalities from September 2013 to January 2019. Only public charging spots for electrical vehicles are included, where the public can charge their vehicles. All registered electrical vehicles in each municipality makes the outcome variable. However, the registration of charging spots does not necessarily reflect the building pace or the registration pace. The data has been provided by Power Circle (ELIS – Elbilen i Sverige), which is an interest organization for the electric power industry. Table 2 presents summary statistics for the two outcome variables, and summary statistics for the control variables: population density and disposable income for households.
TABLE 2. Summary statistics
Variables Mean Standard deviation min max Outcomes Charging spots1 0.021 0.365 0 26.25 Electrical vehicles1 0.056 0.184 0 4.545 Assignment variable Seat share 0.485 0.066 0.25 0.73 Control Variables Population density 122.1 415.8 0.30 5,139 Disposable income 433.5 105.4 303 1,346
5 Results and Analysis
In this section the causal effect of Environmental Party representation on investments in green infrastructure is presented and analysed. In order to perform the analysis, two approaches of the sharp regression discontinuity design are implemented. The first, and most preferred approach, is to use all available data and a control function, and then use different specification checks to check whether the control function in equation (2) is correctly specified or not (Pettersson-Lidbom, 2008). The second approach, to compare average outcomes in a narrow window on each side of the threshold, is used as a specification check. The results from the estimated equation (2) are presented in Table 3, where seven different specifications of equation (2) were estimated.
5.1 Regression results
In Table 3, the regressions estimated in column 1–3 uses a full sample, no control variables, and different polynomial stages of the control function (e.g. seat share for coalitions containing the Environmental Party), and in column 4–5 two control variables are added. The regressions estimated in the two last columns 6–7 use only observations in a neighbourhood of the threshold, no polynomial stages of the control function and no control variables. The outcomes, representing the investments in green infrastructure are transformed into logarithmic form, since a percentage change interpretation is preferred for the estimated causal effect (Pettersson-Lidbom, 2008).
The first and most preferred approach of the sharp regression discontinuity design uses all available data and a control function in seat share, however one concern regarding the design is whether the control function is correctly specified or not (Pettersson-Lidbom, 2008). The first specification check is to control whether the estimate of the treatment (e.g. causal effect) is sensitive to the different specifications of the control function, e.g. different polynomial stages. The control function in equation (2) goes from a first-order to a third-order polynomial in the covariate seat share for coalitions containing the Environmental Party (column 1–3). The second specification check is to control whether the estimate of the treatment in equation (2) is sensitive to different specifications of the control function and added control variables (column 4–5). Compared to column 1–3, the control variables should not affect the estimate of the treatment, only reduce the standard errors.
The second approach of the sharp regression discontinuity design will be used as the final specification check, meaning that the causal effect is estimated by only using observations near the 50% threshold, and without any specification of the control function seat share (Pettersson-Lidbom, 2008). Column 6 includes observations that are ±2 percent from the threshold, and column 7 includes observations that are ±5 percent from the threshold. When only using observations close to the fixed threshold, the sample will be a close approximation to a randomized sample and it is therefore unnecessary to include a control function. Thus, the estimated causal effect of the second approach (column 6–7) should be equal to the estimates from the first approach (column 1–5). If there is a difference, it implies that the control function in seat share may be misspecified.
12
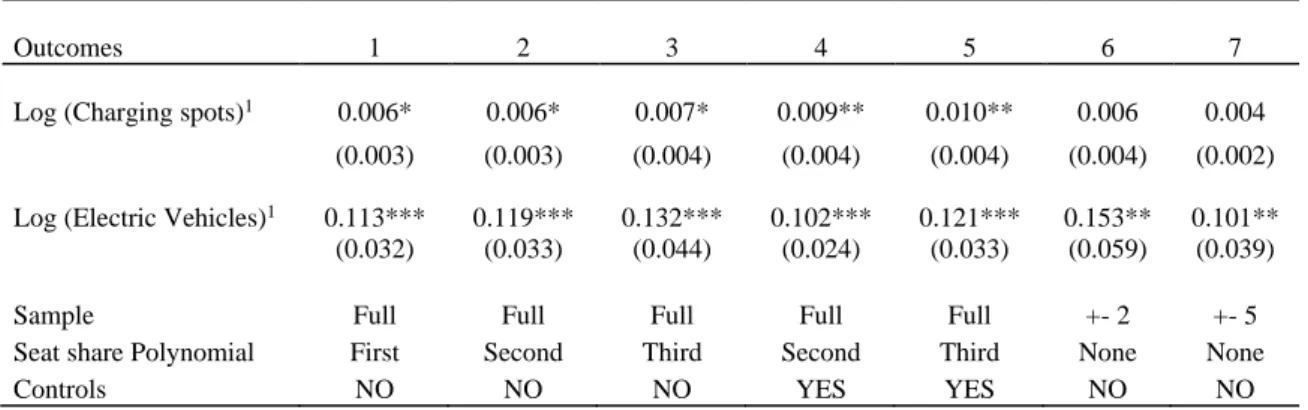
TABLE 3: Estimated causal effects
Outcomes 1 2 3 4 5 6 7
Log (Charging spots)1 0.006* 0.006* 0.007* 0.009** 0.010** 0.006 0.004
(0.003) (0.003) (0.004) (0.004) (0.004) (0.004) (0.002)
Log (Electric Vehicles)1 0.113*** 0.119*** 0.132*** 0.102*** 0.121*** 0.153** 0.101**
(0.032) (0.033) (0.044) (0.024) (0.033) (0.059) (0.039)
Sample Full Full Full Full Full +- 2 +- 5
Seat share Polynomial First Second Third Second Third None None
Controls NO NO NO YES YES NO NO
Robust standard errors in parentheses: *** p<0.01, ** p<0.05, * p<0.1
1: Charging spots per population per unit area, and Electric vehicles per population per unit area
The first row of Table 3 shows the estimated causal effect for different specifications of equation (2) with the outcome variable; charging spots per population per unit area. The estimates of the treatment in column 1–7 are quite similar to each other and ranging between 0.004 and 0.010. Since the estimates in column 1–3 hardly changes, this implies that the estimated causal effect is not sensitive to the different polynomial stages of the control function, and when the control variables are added (column 4–5), there is just a small change of the estimate. Compared to column 1–3, the added control variables (column 4–5) should not affect the estimate of the treatment. Since the estimate hardly changes, this implies that the treatment (e.g. governing coalition) is in fact as good as randomly assigned. However, the inclusion of control variables should reduce the standard errors, but the standard errors in column 4–5 do not decrease (Pettersson-Lidbom, 2008). All estimates except for the two that uses observations in a narrow window of the threshold (column 6–7), are significantly different from zero at the 5% and 10% level. When the sample is restricted to ±2 and ±5 to the 50% threshold, the estimated causal effect is 0.6% respectively 0.4%, which is quite similar to the other estimates in the first row. However, these estimates are not significantly different from zero. According to the first approach, municipalities where the Environmental Party are represented in the governing coalition have approximately 0,6 % more charging spots per population per unit area than municipalities where the Environmental Party is not in the governing coalition.
The second row of Table 3 shows the estimated causal effect for different specifications of equation (2) with the outcome variable; electric vehicles per population per unit area. As in the first row, the estimates of the treatment in column 1–7 are quite similar to each other, and ranging between 0.10 and 0.15. The estimates in column 1–3 are quite similar which implies that the causal effect is not sensitive to different polynomial stages of the control function, and the estimate hardly changes when the control variables are added (column 4–5). The only thing that change is the standard errors. All estimates are significantly different from zero at the 1% and 5% level. When the sample is restricted to ±2 and ±5 to the 50% threshold, the estimated causal effect is 15% respectively 10%, which is quite similar to the other estimates in the first row. The standard errors in column 6–7 are larger than the standard errors in the other columns, which illustrates why the first approach with the control function is the preferred method. This shows that the first approach is more efficient than just comparing the average outcomes in a small neighbourhood on either side of the treatment threshold (Pettersson-Lidbom, 2008). Since all the estimates are quite similar after applying a number of specification checks it suggests that the estimated causal effect is unbiased, and according to the first approach municipalities where the Environmental Party are represented in the governing coalition have approximately 10% more electric vehicles per population per unit area than municipalities where the Environmental Party is not in the governing coalition.
5.2 Graphical Analysis
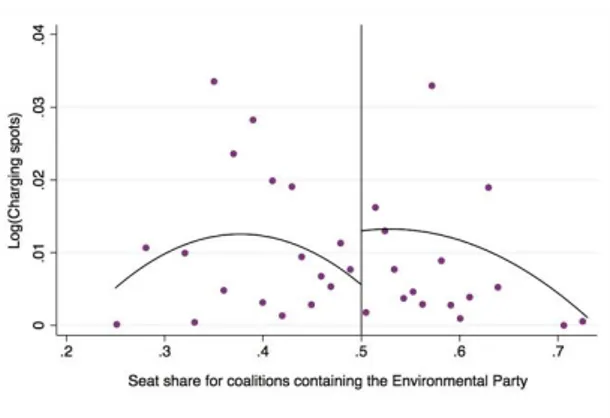
The results in Table 3 indicates that there is a positive estimate of the treatment in all of the different specifications of equation (2), an increase ranging from 0.4%–1% for charging spots and 10%–15% for electric vehicles when the governing coalition include the Environmental Party. Another way to distinguish the effect of Environmental Party representation on outcomes reflecting investments in green infrastructure is to analyse equation (2) graphically. Figure 1–2 plots the number of charging spots divided by the population per unit area (logarithmic form) against the seat share for coalitions containing the Environmental Party, and Figure 3–4 plots the number of electric vehicles divided by the population per unit area (logarithmic form) against the same forcing variable.
Each dot in Figure 1–4 is an average of the number of charging spots/electric vehicles in a municipality during the electoral period (2014–2018). The vertical line in the middle of the graphs marks the 50% threshold. Municipalities to the right are governed by coalitions that include the Environmental Party after the 2014 election, while municipalities to the left are governed by coalitions that do not include the Environmental Party after the 2014 election. The continuous line in the graphs is the predicted number of charging spots/electric vehicles from equation (2), which include a second-order polynomial in seat share for coalitions that include the Environmental Party and a binary variable equal to one for observations above the 50% threshold. In Figure 1 and 3 the whole sample is used. However, in Figure 2 and 4 only observations close to the threshold, [45,55], are applied. According to the results stated in Table 3, there should be a discontinuity at the threshold, and there is indeed a jump in Figure 1–4 for both the number of charging spots and electric vehicles at the 50% threshold.
The difference between the estimated treatment effect at the 50% threshold for charging spots per population per unit area appears to be about 0.7% higher in municipalities where the governing coalition contain the Environmental Party. This seems to be the case both when applying the whole sample size and when applying only observations in a narrow window of the threshold. This implies that the estimated treatment effect for the outcome variable charging spots per population per unit area has more or less the same estimate in Table 3 and in the graphical results in Figure 1–2. The difference between the estimated treatment effect at the 50% threshold for electric vehicles per population per unit area appears to be about 0.7% when the whole sample size is used, and about 5% when only observations in a narrow window of the threshold are applied. This implies that the treatment effect in the graphical result for the outcome variable electric vehicles per population per unit area is less than when the estimate of the treatment in Table 3.
As is shown in Figure 1–4 the regression line is downward sloping to the right of the threshold, which may have to do with the bargaining power within the coalitions. One can argue that the Environmental Party in governing coalitions close to the 50% threshold, have a greater bargaining power than in governing coalitions where the coalition has, for example, 60% of the seats in the local council. This could explain the decrease of installed charging and registered electric vehicles when the governing coalition has a greater support. According to Folke (2014), the estimated causal effect of party representation on policy outcome has to do with more than being represented in the governing coalition, instead the effects can likely be explained by changes in coalition bargaining power since small parties’ trade support for larger parties in some matters in exchange for support in their policies.
14
FIGURE 1: The effect of Environmental Party representation on charging spots when using the whole sample
FIGURE 2: The effect of Environmental Party representation on charging spots using only observations in a narrow window
FIGURE 3: The effect of Environmental Party representation on electric vehicles when using the whole sample
FIGURE 4: The effect of Environmental Party representation on electric vehicles using only observations in a narrow window
6 Discussion
In this section the estimated results and its relation to existing literature will be discussed, followed by a discussion of the validity of the regression discontinuity design.
6.1 Results
The estimate of the different specifications of equation (2) is presented in Table 3. The results of the preferred approach, using a control function and the whole data set, implies that there is an increase of charging spots per population per unit area of approximately 0.6% when the governing coalition contains the Environmental Party, compared to municipalities where the governing coalition do not contain the Environmental Party. The estimated causal effect when using all available data and a control function is quite similar to the estimated causal effect where only data in a narrow window on each side of the threshold is applied. This should imply that the estimated causal effect is an unbiased estimate. However, the estimated causal effect, when applying data in a narrow window of the threshold, is not significantly different from zero. This implies that the null hypothesis cannot be rejected, meaning that there is no difference between the average outcomes in municipalities where the governing coalition contains the Environmental Party or not. This would make sense since the estimated causal effect of Environmental Party representation on the outcome charging spots is relatively small, 0.6%. Further, there is an increase of electric vehicles per population per unit area of approximately 11% when the governing coalition contain the Environmental Party. The application of different specification checks of equation (2) show that the results are quite reliable, since the estimates are quite similar and significantly different from zero, which suggests that the estimated causal effect is an unbiased.
However, the results show a considerably larger increase of registered electric vehicles than charging spots in municipalities where the Environmental Party is represented in the governing coalition. Since the estimated causal effect on the outcome variable charging spots per population per unit area is quite small, this could indicate that there are other factors that drives the increase of registered electric vehicles. Thus, there is reason to question the validity of the results regarding the causal effect of Environmental Party representation on the number of registered electric vehicles.
In previous studies, researchers have used the regression discontinuity design to estimate the causal effect of political representation on policy outcomes. Pettersson-Lidbom (2008) and Folke (2014) have both applied data sets based on the results of Swedish local elections to estimate party effect on economic and fiscal policy, respectively fiscal policy, immigration and environmental policy. However, they use different approaches of the regression discontinuity design, where Pettersson-Lidbom (2008) treats the Swedish electoral system as bipartisan while Folke (2014) develops a new methodology originating from the regression discontinuity design. Pettersson-Lidbom (2008) find a causal effect of party representation on economic and fiscal policy, while Folke find a causal effect of party representation on immigration and environmental policy. The results of this study show that there probably is a causal effect of party representation on investments in green infrastructure, and are thus consistent with previous research based on Swedish data. The outcome investments in green infrastructure are connected to outcomes regarding environmental policy, which makes it interesting to compare the results of this study to the study by Folke (2014). However, the environmental outcome in the study by Folke (2014) is an approximation of environmental policy based on environmental ranking, rather than a measurable and factual outcome such as the number of charging spots
16
and electric vehicles. A conclusion made by Folke (2014) that may also affect the results of this study, is that the inclusion of small single issue parties in governing coalitions may affect the positive causal effect to a greater extent than including parties with a wider political agenda.
Ferreira and Gyourko (2009) has shown that party representation in the U.S. at a local level does not affect policy outcomes. Although it is difficult to speculate on why there is such a difference between the results based on Swedish respectively U.S. data sets, one possible factor may be that there are a number of fundamental differences between the two countries political systems. One fundamental difference is that the system in the U.S. is bipartisan while the Swedish political system consists of a number of parties, but is treated as bipartisan in this study and in the study by Pettersson-Lidbom (2008).
6.2 Limitations
This study, however, has its limitations. In the method section, three key assumptions of the regression discontinuity design were presented. To support the validity of the estimated causal effects, it is crucial to assess the validity of these assumptions, two of which are empirically testable (Smith, et al., 2017). The first assumption is that there should be a discontinuity in the probability of the treatment at the threshold. The second assumption is that the municipals’ value of the seat share was not manipulated, meaning that groups are either assigned to the treatment or not, in a way that is similar to randomization and that the subjects have not exerted control of the value of the forcing variable.
The validity of the first assumption can easily be tested. If the assumption is valid, the treatment will equal one for every unit of the forcing variable that is equal to or above the threshold, and the treatment will equal zero for every unit of the forcing variable below the threshold (Smith, et al., 2017). In this case, when the treatment is equal to one, the vote shares range from 0.5 to 0.73, and when the treatment is equal to zero the seat shares range from 0.25 to 0.49. This means, that the first assumption is valid for this sample. To control the validity of the second assumption, a histogram of density of the forcing variable seat share for coalitions containing the Environmental Party was created. The density in Figure 5 is not flat, which is an indication of discontinuity of the forcing variable, meaning that the forcing variable may be manipulated. This violates the assumption that groups (e.g. governing coalitions) are assigned to the treatment in a way that is as good as randomly assigned, and this in turn violates the exchangeability assumption.
One possible explanation could be that coalitions with a support just below the 50% threshold may actively choose to include the Environmental Party, in order to get a majority in the council. Thus, parties can choose to include the Environmental Party or not depending on, among others, how green they are, in order to obtain a majority in the council. For example, in the municipality Uppsala, the Liberal Party, Centre Party and the Social democrats combined have 49% of the seat shares in the local council, and to get the majority in the council they have chosen to include the Environmental Party. In contrast, in the close by municipality Knivsta, the Liberal Party, Centre Party and the Social democrats did also receive 49% of the seat shares in the council but have, however, chosen not to include the Environmental Party but the Left Party, in order to get a majority in the council. This means that one determinant of whether the Environmental Party is included in the governing coalition or not is how green the other parties are in each municipality, which can in turn affect local investments in green infrastructure.
18
7 Conclusion
The aim of the study has been to examine to what extent investments in green infrastructure are affected by Environmental Party representation at a local level, and the objective has been to estimate the causal effect of Environmental Party representation in governing coalitions on investments in green infrastructure. The results show that there probably is a positive causal effect of Environmental Party representation on outcomes reflecting investments in green infrastructure, using a sharp regression discontinuity design. The results are supported by various specification checks. However, one of the key assumptions of the regression discontinuity design, namely that the governing coalitions of the municipalities value of the forcing variable should not be manipulated, has been violated. Thus, the governing coalitions are probably not as good as randomly assigned. This makes it hard to draw any conclusions of the estimated causal effect of Environmental Party representation on investments in green infrastructure.
Nevertheless, the results can be of interest when evaluating the vision of the Environmental Party’s 2014 election manifesto, to increase the number of charging spots, and thereby also making electric vehicles more accessible, since the results suggest that there is a causal effect of Environmental Party representation on investments promoting electric vehicle infrastructure. The graphical results, however, show that there are less charging spots and electric vehicles in municipalities where the governing coalition including the Environmental Party have a greater seat share, i.e. 60% of the seat share. The same applies for the governing coalitions where the Environmental Party is not represented. The largest number of charging spots per population per unit area are in the municipalities where the governing coalitions have a support close to the 50% threshold, i.e. in municipalities where the governing coalition that include the Environmental Party barely won. It can therefore be hard to distinguish if it is the Environmental Party that drives the development of green infrastructure, since we are unaware of the Environmental Party’s bargaining power within the governing coalition. This indicates that other factors, such as bargaining power, need to be considered when assessing the causal effect of Environmental Party representation on investments in green infrastructure.
A suggestion for further research in the field of studying the causal effect of political representation on investments in green infrastructure is therefore to include other factors, such as bargaining power and to further develop the methodology developed by Folke (2014), which in some ways better reflect the Swedish political system.
References
Black, S. E., 1999. Do Better Schools Matter? Parental Valuation of Elementary Education.
The Quarterly Journal of Economics, 114(2), pp. 577-599.
Cappelleri, J. C. & Trochim, W. M., 2015. Regression Discontinuity Design. i: N. J. Smelser & P. B. Baltes, red. International Encyclopedia of the Social & Behavioral Sciences.
Amsterdam: Elsevier Ltd, pp. 152-159.
Ferreira, F. & Gyourko, J., 2009. Do politicalparties matter? Evidence from U.S. cities. The
Quarterly Journal of Economics, 124(1), pp. 399-422.
Folke, O., 2014. Shades of Brown and Green: Party Effects in Proportional Election Systems.
Journal of the European Economic Association, 12(5), pp. 1361-1395.
Frölich, M., 2007. Regression Discontinuity Design with Covariates. Mannheim: University of St.Gallen, Department of Economics.
Hahn, J., Todd, P. & Van Der Klaauw, W., 2001. Identification and estimation of treatment effects with a regression-discontinuity design. Econometrica, 69(1), pp. 201-209.
Lee, D. S., 2008. Randomized experiments from non-random selection in U.S. House elections. Journal of Econometrics , 142(2), p. 675–697.
Lee, D. S., Moretti, E. & Butler, M. J., 2004. Do voters affect or elect policies? Evidence from the U. S. House. The Quarterly Journal of Economics, 119(3), pp. 807-859.
Mattei, A. & Mealli, F., 2016. Regression Discontinuity Designs as Local Randomized
Experiments. Florence: Observational Studies. 2.
McCrary, J., 2008. Manipulation of the running variable in the regression discontinuity design: A density test. Journal of Econometrics, 142(2), pp. 698-714.
Miljöpartiet, 2014. Miljöpartiet. [Online]
Available at: https://www.mp.se/sites/default/files/valmanifest_uppdaterad.pdf [Accessed 05 06 2019].
Naturskyddföreningen, 2018. Ny fart i miljöpolitiken - en utvärdering av riksdagspartiernas
miljöinsatser 2014 – 2018, u.o.: Naturskyddsföreningen.
Pettersson-Lidbom, P., 2008. Do parties matter for economic outcomes? A
regression-discontinuity approach. Journal of the European Economic Association, 6(5), pp. 1037-1056.
SCB, 2014. Valdeltagandet har ökat i valen. [Online]
Available at: https://www.scb.se/hitta-statistik/statistik-efter-amne/demokrati/allmanna-val/allmanna-val-valresultat/pong/statistiknyhet/allmanna-val-valresultat-2014/
20
Smith, L. M., Lévesque, L. E., Kaufman, J. S. & Strumpf, E. C., 2017. Strategies for
evaluating the assumptions of the regression discontinuity design: a case study using a human papillomavirus vaccination programme. International Journal of Epidemiology, 46(3), p. 939–949.
Sveriges kommuner och landsting, 2019. Trafik, infrastruktur. [Online]
Available at: https://skl.se/samhallsplaneringinfrastruktur/trafikinfrastruktur.289.html [Accessed 06 06 2019].
Thistlethwaite, D. L. & Campbell, D. T., 1960. Regression-Discontinuity Analysis: An Alternative to the Ex-Post Facto Experiment. Journal of Educational Psychology, 51(6), pp. 309-317.
Valmyndigheten, 2019. Fördelning av mandat. [Online]
Available at: https://www.val.se/val-och-folkomrostningar/det-svenska-valsystemet/rostrakning-och-valresultat/mandatfordelning.html
[Accessed 06 06 2019].
Van Der Klaauw, W., 2002. Estimating the Effect of Financial Aid Offers on College Enrollment: A Regression- Discontinuity Approach. International Economic Review, 43(4), pp. 1249-1287.
Warren, P., 2008. State Parties and State Policies: A Double Regression Discontinuity