The Association
Between Goodwill Costs
and Share Prices
MASTER Thesis in Business Administration THESIS WITHIN: Accounting
NUMBER OF CREDITS: 30 credits PROGRAMME OF STUDY: Civilekonom AUTHOR: Andreas Hjalmarsson and Jens Åberg JÖNKÖPING May 2019
A comparison between the amortization regime and the
impairment regime in a Swedish setting
Acknowledgements
We would like to thank our tutor Argyris Argyrou for his guidance and insights during the process of writing this thesis. His dedication has really helped completing this thesis.
Moreover, we would also like to thank Oskar Eng for helping us with our ideas and making the process of writing this thesis easier.
Andreas Hjalmarsson Jens Åberg
Master Thesis Project in Business Administration
Title: The Association Between Goodwill Costs and Share Prices: A Comparison Between the Amortization Regime and The Impairment Regime
Authors: Andreas Hjalmarsson and Jens Åberg Tutor: Argyris Argyrou
Date: 2019-05-20
Key terms: goodwill, impairment, amortization, IFRS
Abstract
Background: Goodwill activity has been very high in Sweden in recent years. Goodwill is
regulated by IFRS 3, which came into effect in 2004. Instead of amortizing the asset over a specific number of years, goodwill should be tested for impairment every year. This change has received criticism due to its introduction of estimation of fair values and the possibility it gives managers to act discretionary, which has made it more difficult for investors to trust the financial information of the firm.
Purpose: The purpose of the thesis is to examine the effects the switch from the amortization
regime to the impairment regime has had on the relationship between goodwill costs and share price. The research question is if there is a difference in the association between share prices and goodwill costs between the amortization regime and the impairment regime.
Method: The thesis conducts a quantitative study with a linear regression analysis to measure
the association between goodwill costs and share prices. The sample consists of 19 of the firms listed on OMXS 30. In the model used for the linear regression share price is the dependent variable and there are nine different independent variables tested against share price, among which goodwill costs are included. To test if there is a difference between the two different regimes, the regression is divided into an amortization part and into an impairment part.
Conclusion: The thesis concludes that it can find a difference between the amortization
regime and impairment regime in the association between goodwill cost and share price. In the impairment regime goodwill cost affects share prices in contrast to the amortization regime where it does not.
1. Introduction ... 4
1.1 Background ... 4 1.2 Problem ... 5 1.3 Purpose ... 6 1.4 Definitions ... 62. Frame of reference ... 7
2.1 Accounting standards ... 7 2.1.1 IAS 22 ... 7 2.1.2 IFRS 3 ... 7 2.1.3 IAS 36 ... 8 2.2 Literature review ... 9 2.3 Theories ... 13 2.3.1 Agency theory ... 133
Method ... 14
3.1 Research process ... 143.2 Data collection and Sample ... 15
3.3 Hypothesis ... 16 3.4 Model ... 17 3.5 Variables ... 18
4
Results ... 21
4.1 Descriptive statistics ... 21 4.2 Pearson correlation ... 22 4.3 Linear regression ... 245. Analysis ... 26
6. Conclusion ... 30
7. Discussion ... 31
7.1 Limitations ... 31 7.2 Future research ... 327.3 Social and ethical implications ... 33
8. Reference list ... 34
1. Introduction
1.1 Background
In 2016, merger and acquisition activity in Sweden were at very high levels. During 2016, the amount of goodwill impairments in Sweden was at €900 million. In 2015, that number was €400 million. The Swedish company that recorded the largest impairment in 2016 was SEB. They recorded a goodwill impairment of €557 million (Duff & Phelps, 2017). This shows that there are substantial amounts of goodwill that gets impaired every year.
The standards that regulates accounting in Europe is the International Financial
Accounting Standards (IFRS). The standard IFRS 3 business combinations was issued in 2004 and regulates the reporting and treatment of goodwill in Sweden (IFRS, 2017). In the release statement the International Accounting Standards Board (IASB) claimed that IFRS 3 will contribute to a higher quality of standards and provide users of the financial statements with more useful information. IAS 22, the predecessor of IFRS 3, was criticised in the release statement mainly because the useful life of goodwill and the pattern at which it diminishes is difficult to estimate (IASB, 2004). This was based on previous research according to the IASB that mentioned an article by Jennings, LeClere and Thompson (2001). Jennings et al. (2001) made the conclusion that the impairment regime better reflects the variation in share prices than the amortization regime. Thus, it was argued that the impairment regime provided more useful information to the users of the financial statements.
In spite of these claims made by the IFRS foundation, the goodwill impairment
regulations have received criticism. Callao and Jarne (2010) argues that the treatment and accounting of goodwill is one area in which managers are given an opportunity to act discretionary, which means that managers acts according to their own will. Li and Sloan (2011) further argues that investors do not seem to be able to anticipate the impairments. According to Trainer (2018), the previous practise of amortizing goodwill on a yearly basis prevented the asset from inflating in its book value. In the impairment regime the
yearly amortization disappeared and a test for impairment should be constructed instead, which meant that the goodwill could inflate the book value for years before it would be impaired.
The criticism brought forward in previous research makes it interesting to compare and see if the impairment regime is the best way to treat goodwill. If it is harder for investors to trust the reported numbers of the impairment regime compared to the amortization regime, it means that there would be a reaction on the stock market. Therefore, the thesis will investigate the difference between the amortization regime and the impairment regime in explaining the share price.
There have been different papers discussing both the relationship between goodwill and share prices as well as the change between amortization and impairment regime. The difference between previous research and this thesis is that this thesis uses another model than other papers within this subject, to see if the results will differ from the previously found evidence within this area. The variables used are all based on existing literature, but the combination of these specific variables have not been tested by authors in the past. Additionally, the years chosen for the sample also differs from previous research (Hamberg, Paananen and Novak 2011, Chalmers, Godfrey and Webster 2011, Bens, Heltzer and Segal 2011 etc.).
1.2 Problem
According to IFRS 3, goodwill is recognized as an intangible asset when a transaction of ownership, or parts of ownership, occurs between two entities. The valuation of goodwill is conducted during the transaction and is calculated as the transaction price subtracted with the net asset acquired (IFRS, 2017). In 2004 when IFRS 3 was introduced, the rules of how goodwill should be handled changed considerably. According to the previous standard that treated the valuation of goodwill, IAS 22, it was to be recognized as an intangible asset and was to be amortized over its useful life (IAS Plus, n.d.). After the implementation of IFRS 3 this changed as mentioned. The standard setters made a noticeable change when instead of the amortization system, they implemented a system that required goodwill to be tested for impairment every year. For the companies the change means that they need to test the value of goodwill in a stipulated impairment test
in order to confirm that the goodwill balance was not overvalued, and if so, impair it and recognize a cost (IFRS, 2017).
Both regimes have been discussed previously in literature. Chalmers et al. (2011) states that the association between a firm’s investment opportunities and its goodwill
impairment losses under an impairment regime is stronger than the association under an amortization regime. Thus, the authors claim that impairment is the superior method of handling goodwill posts and to keep it from inflating in an unrealistic and improper way. In contrast to this, Paananen and Lin (2009) reached the conclusion that the
implementation of the impairment regime was the reason that accounting quality decreased after the switch from the amortization regime to the impairment regime.
1.3 Purpose
The purpose of the thesis is to examine the effects the switch from the amortization regime to the impairment regime has had on the relationship between goodwill costs and share price. The research question for the thesis is therefore, is the association between share prices and goodwill cost different in the impairment regime compared to the amortization regime?
1.4 Definitions
Association - Association is defined as a variable that has a statistical significance and
affects the dependent variable in the thesis.
Goodwill cost – Goodwill cost is defined as the amortization and/or the impairment cost. Noise – Noise is defined as information that distracts or confuses the reader
Amortization regime – The period before the implementation of IFRS 3 Impairment regime – The period after the implementation of IFRS 3
2. Frame of reference
2.1 Accounting standards
The regulations of how companies are supposed to handle intangible assets have changed historically and are consistently changing. As an example, IFRS 3 had its latest
amendment in 2019 and will be further amended in 2020 (IAS Plus, n.d.). The current and former accounting standards are presented below to describe how intangible assets, and more specifically goodwill, has been accounted for in the past and how goodwill is treated now.
2.1.1 IAS 22
IAS 22 was implemented in 1985 by IASB with the objective of setting the regulation how accounting departments should handle business combinations. A business
combination is when two entities combine into one entity, which provides one of the enterprises with control of the other enterprises’ assets. This may be done through acquisitions or by merging. When acquiring a company goodwill arises as an asset when the price paid exceeds the fair value of the assets acquired. The fair value of the assets is determined by the acquirer based on the intended use. Under IAS 22 goodwill is
amortized over its useful life, which in most cases is no longer than twenty years. Besides the amortization, goodwill is also tested for impairments if there are indications that it is needed, which is regulated in IAS 36. (IAS Plus n.d.)
2.1.2 IFRS 3
IFRS 3 superseded IAS 22 in 2004. In the release statement the IASB claimed that IFRS 3 will contribute to a higher quality of standards and provide users of the financial
statements with more useful information. The objective of IFRS 3 is similar as in IAS 22, to provide a regulated environment for companies to account for business combinations. IFRS 3 regulates both acquisitions and mergers, and how to recognize and measure assets acquired. These business combinations are treated with the acquisition method which
demands estimations of the fair value of both assets and liabilities at the acquisition date, which enterprise is the acquirer and also the measurement of goodwill. The goodwill is measured as the difference between the acquisition price combined with eventual non-controlling interests, and the combined fair value of the acquired net assets at acquisition date. Hence, if an enterprise pays an overprice for acquiring another enterprise goodwill is recognized in the acquiring company’s balance sheet as an asset (IAS Plus n.d.).
2.1.3 IAS 36
IAS 36 regulates how a company should treat its assets in terms of devaluation, in other words it stipulates how valuing assets should be done in order not to be overvalued. IAS 36 describes overvalued as when an asset is valued as more than its recoverable amount. The recoverable amount is defined as the highest of fair value, and value in use. An assets fair value is the amount it would be sold for in an orderly transaction at the measurement date. Value in use is the present value of future cash flows expected from an asset. In the case of intangible assets such as goodwill this is done by determining the future cash flow from the cash-generating unit of which the goodwill is allocated to (IAS Plus n.d.).
The recoverable amount of goodwill acquired is measured annually regardless if there are any indications of a need for impairment. This is done by allocate goodwill to a cash-generating unit and then compare the carrying amount to the recoverable amount of the cash-generating unit. This means that unlike IAS 22 where goodwill is amortized over its useful life-time, now goodwill is annually tested for impairment. Under IAS 36 the amount of goodwill may not be devalued to less than the highest of its fair value or value in use. This restricts unlimited impairments (IAS Plus n.d.).
IASB (2005) claimed that using an impairment regime is better for investors since it provides the users of financial statements with more reliable and useful information rather than an amortization regime. IASB (2005) also argued that the prediction of an intangible assets’ lifetime is what makes an amortization regime unreliable since it is impossible to predict in general terms, and if it is possible to predict the lifetime, the pattern of which the assets loses value is impossible to predict. (IAS Plus n.d.)
2.2 Literature review
Prior research has shown that the amortization of goodwill is problematic due to its inability to provide useful information to the public when analysing financial statements. Jennings et al. (2001) found that information about goodwill amortization reduces the accuracy in predicting the future profitability, and also that total earnings before amortization costs provided more informational value to users of financial statements, rather than total earnings after amortization costs. This result was confirmed by
Reynolds-Moehrle and Wallace (2001), which also argued that earnings before goodwill amortizations are more informative and useful for investors decision making. Jennings et al. (2001) presented that some investors do not view goodwill as an asset with a definite life time, but instead as an asset with indefinite useful life-time. Hence, amortize an asset which might have appreciated is not appropriate since it does not reflect the actual economic value of the asset.
The impairment regime has also been reviewed in literature. Chalmers et al. (2011) suggested that IFRS impairment tests, which were introduced with IFRS 3 and IAS 36, are reflecting underlying economic value better than amortization methods and that the decision to implement the impairment test was correct. The authors found evidence of the suitability of this implementation, even though other researchers have found different answers. Chalmers et al. (2011) argued that the noise is reduced, and hence the
informational value increased, by having the impairment directly reducing the earnings of a company, instead of having the annual amortization which in many cases were ignored by the readers of the financial statements.
In contrast to the findings of Chalmers et al. (2011), other papers have criticised the impairment regime. Carlin and Finch (2009) discussed the complexity of the goodwill impairment process, for example the adoption of a discount rate to translate the future cash flows to their present economic equivalent. If this is not done appropriately, the outcome could be that the valuation of goodwill is questionable.
Similar to Carlin and Finch (2009), AbuGhazaleh, Al-Hares and Roberts (2011) were also critical towards IFRS 3. They argued that even though the intention of the adoption of IFRS 3 was to improve the treatment of goodwill and make the information more useful, managerial discretion is apparent in the process. The authors provide empirical results which shows that goodwill impairments done under the IFRS 3 regime have a strong association with governance mechanisms instead of economic factors which indicates more opportunistic and discretionary accounting behaviour.
Callao and Jarne (2010) investigated whether the adoption of IFRS standards increased discretionary behaviour or not. Their findings supported the claim that the IFRS
standards increased discretionary behaviour, which resulted in a lower quality of financial information delivered by firms compared to before the IFRS standards.
IFRS 3 has also been criticized by Watts (2003) who argues that in order to be able to assess the need of an impairment the future cash flow is needed. Since the future value of an intangible assets is not verifiable the valuation based on this is not accurate, but instead both the future cash flow and the impairment based on the future cash flow is likely to be manipulated by managers. According to Watts (2003) the impairment test which is based on the future cash flow of a cash generating unit is not accurate.
Under the impairment regime, Hamberg et al. (2011) argues that an unimpaired goodwill post might be seen as a sign of strength. An unimpaired goodwill post may indicate success for a firm, since it provides information of good historical investments since the result will be higher if no impairment is made. Hence the share price may increase because of this. Also, the returns of firms with no capitalized goodwill are noticeably lower. According to the authors, the effect from an impairment is that more information is provided, and in the case of an impairment, bad information for the shareholders which causes the share price to decrease. However, the lack of information about impairments has the opposite effect. If the impairment is not mentioned the share price appear to increase.
Hamberg et al. (2011) concludes that the accounting method of impairments is likely to decrease the information value from annual reports to investors. Their results propose that investors are more dependent on manager actions regarding impairments than under
the amortization regime. The author also argues that the big winner of the adoption of IFRS 3 are firms with substantial goodwill posts that are no longer needed to amortize them and instead can lower their reported amortization costs compared to under the amortization regime.
In a study conducted by Paananen and Lin (2009), the quality of accounting was compared between three different time periods. 2000-2002 represented the IAS period, 2003-2004 represented a period where IAS and IFRS was a voluntary choice and 2005-2006 represented a period in which IFRS was mandatory. The study by Paananen and Lin (2009) was conducted on German companies. Their results suggested that the accounting quality first improved in the period where the IFRS was voluntary, but from 2005, when it was mandatory, the accounting quality decreased. The reason for this decrease in quality was, according to Paananen and Lin (2009), a result of the implementation of impairments rather than any external factors.
In addition, Bens et al. (2011) researched whether the changes in fair value measurement affected the accounting information provided. In their study, it was tested whether impairment of goodwill affected share prices. Their results suggested that share prices were negatively affected when a firm is recording an impairment. However, the market did not react as heavily to impairments when it came to smaller firms compared to larger firms. Bens et al. (2011) argued that this was due to the fact that the market did not view the impairments of smaller firms as credible, since it was more difficult for them to make these judgements.
Li and Sloan (2017) examined the impact the impairment test has had on accounting for and valuation of the goodwill account. Li and Sloan (2017) found that estimation of goodwill based on fair values led to inflated goodwill balances and untimely
impairments. Moreover, the investors did not seem to anticipate the untimely impairments when looking at their investing decisions. Li and Sloan (2017) further explained that the reason why managers were reluctant to impair goodwill was that an impairment would be an admission from the managers that they had overpaid for the acquisition the firm made.
Jeter, Chaney and Daley (2008) suggested that there is a trend within companies to minimize the negative effects of implementing a new accounting standard. This is because of the need to signal strength to equity markets and show that the company does not fall apart when the accounting regulation changes.
Another reason for making impairments found by Beatty and Weber (2006) in a study of SFAS 142 is companies with a need of meet or beat earnings expectations seem to have more incentives to impair assets aggressively in order to improve the following years to come.
Li, Shroff, Venkataraman and Zhang (2011) also found evidence that the financial market was impacted by the recording of impairments. However, their conclusion states that even though the market reacted negatively on the announcement of impairment, further analysis revealed that the impairment was negatively correlated to growth in sales and operating profits. Thus, the authors suggested that the market reaction could also be attributed to the loss in sales, rather than the impairment.
Beatty and Weber (2006) also reported that impairments may be made with personal incentives such as bonuses in mind. The author states that companies with performance-based bonus schemes which recently changed managers are more likely to do large impairments on assets such as goodwill in the beginning of the new managers’ tenure. In this way the manager can impair without losing reputation since the impairment can be blamed on the previous management and make the new management appear more successful than it actually may be. The authors add that firms with historical acquisitions where the same management that made the acquisition still has a key role in the firm, is less likely to impair their own acquisition in a try to save their own appearance and not be paired together with a failed investment.
The fact that new managers are more likely to impair when they are new in their role means that tenure of management has a role to play when explaining impairment of assets. This is confirmed by Francis, Hanna and Vincent (1996) who states that
2.3 Theories
2.3.1 Agency theory
Agency theory, developed by Jensen and Meckling (1976), is based on the fact that one party is performing something on the behalf of another party. The party that is
performing the act is called the agent, while the party delegating the act is called the principal. In the relationship between the agent and the principal there is information asymmetry. The principal does not have complete information about the agent. To solve this problem the principal will try to monitor and gather information on the agent to bridge the information gap (Shapiro, 2005).
In this thesis, the principal is the financial market, i.e. the investors, and the agent is the firm, i.e. the managers. The investors do not have complete information about the firm. Therefore, information asymmetry exists between the investors and the managers. The information the investors receive is via the financial statements and the results are seen on the financial markets reaction to the financial statements, i.e. the share price.
Therefore, the agency theory is applicable to this thesis.
The thesis investigates the relationship between managers and investors in the case of the reaction in the share price in relation to the treatment of goodwill. For example, if there is a difference in the variation in share prices in relation to the goodwill costs between the amortization regime and the impairment regime, then the investors do react to the
information provided by one of the regimes better. Thus, for the regime that is inferior in explaining share prices, there is more information asymmetry present then for the regime that is superior in doing so.
3 Method
3.1 Research process
In order to conduct the research, prior scholars (Jennings et al., 2001, Mehrani and Mehrani 2003, Hamberg and Beisland 2014, Riedl 2004) has helped laid the foundation of the method. The mentioned authors have stated a framework for which variables and proxies might be useful in a quantitative approach of investigating goodwill and its effects. That framework has been used by the thesis to define which data to collect and how to improve the hypothesis.
In cases where firms included in the sample presents their financial reports in other currencies than SEK (EUR) the thesis has converted this to SEK for comparability reasons. The thesis has used the currency exchange rate provided by Riksbanken for every year. The thesis used the average exchange rate in each year.
The analysis will be conducted as follows. The sample will be run through the regression model where the sample is divided into two periods, one for the amortization regime (AMORT) and one for the impairment regime (IMP). The allocation of the data to each period is done by using dummy variables.
The multiple regression will be run on the sample which contains of 152 individual firm-year observations for 19 firms. After the regression is run the result will be analysed. The p-values will be examined to see whether or not any statistical significance exists on each independent variable.
3.2 Data collection and Sample
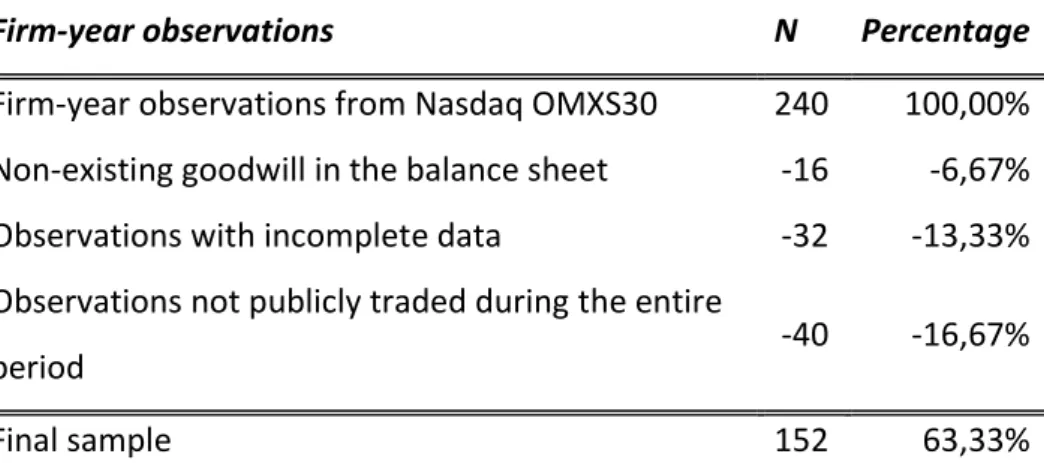
Table 1 show how the sampling of the thesis has been conducted. The Nasdaq OMXS30 index which the thesis examines, contains 30 firms for which the thesis collects 8 years each. The period for which the thesis collects data is from 1999-20091. This summarizes to a total 240 firm-year observations. The thesis collects data manually from the annual report provided. The thesis excludes firms that do not carry any goodwill in the balance sheet, hence 16 year observations are excluded. Further, the thesis removes 32 firm-year observations from firm-years with incomplete data in terms of lack of financial data and share prices. Thirdly, 40 firm years are excluded due to not being traded on the public stock market for the complete period of 1999-2009. Companies that had their initial public offering later than the 1st January 1999 have been removed.
The final sample consists of 152 firm-year observations (which is 63,33% out of possible initial observations) from 19 firms (63,33%) during the period of 1999-2009.
The thesis selects the OMX30 index for the period 1999-2009 as the sample which contains a total of 30 companies. Companies that lack any of the data that follows below are excluded from the sample. In this case, 11 companies were excluded due to the lack of data. The sample were thus reduced to 19 companies in the end. For each company, the thesis selects the following data: total assets, total debt, earnings, goodwill balance and goodwill costs. In addition, the thesis collects share price data as well.
Table 1 - Exclusion of observations *N is expressed in firm-year observations
Firm-year observations N Percentage
Firm-year observations from Nasdaq OMXS30 240 100,00% Non-existing goodwill in the balance sheet -16 -6,67%
Observations with incomplete data -32 -13,33%
Observations not publicly traded during the entire
period -40 -16,67%
From each company four years were collected from the amortization and impairment regime respectively. Some firms implemented IFRS 3 in 2004 while some implemented IFRS 3 in 2005 which meant that the years differs for the different periods between the firms. For the firms that adopted IFRS 3 in 2004, the amortization period is 2000-2003 and the impairment period is 2005-2008. For the firms that adopted IFRS 3 2005, the amortization period is 2001-2004 and the impairment period is 2006-2009.
3.3 Hypothesis
To be able to answer the research question, the thesis has developed a hypothesis.
𝐻1: 𝑇ℎ𝑒 𝑎𝑠𝑠𝑜𝑐𝑖𝑎𝑡𝑖𝑜𝑛 𝑏𝑒𝑡𝑤𝑒𝑒𝑛 𝑔𝑜𝑜𝑑𝑤𝑖𝑙𝑙 𝑐𝑜𝑠𝑡𝑠 𝑎𝑛𝑑 𝑠ℎ𝑎𝑟𝑒 𝑝𝑟𝑖𝑐𝑒𝑠 𝑖𝑠 𝑛𝑜𝑡 𝑑𝑖𝑓𝑓𝑒𝑟𝑒𝑛𝑡 𝑏𝑒𝑡𝑤𝑒𝑒𝑛 𝑡ℎ𝑒 𝑎𝑚𝑜𝑟𝑡𝑖𝑧𝑎𝑡𝑖𝑜𝑛 𝑟𝑒𝑔𝑖𝑚𝑒 𝑎𝑛𝑑 𝑡ℎ𝑒 𝑖𝑚𝑝𝑎𝑖𝑟𝑚𝑒𝑛𝑡 𝑟𝑒𝑔𝑖𝑚𝑒.
Similar to Hamberg et al. (2014) the thesis examines the effect of goodwill costs since previous authors mentioned found goodwill costs to be statistically significant. The thesis explains the term associated as if there exists a significant statistical correlation between the variables, in this case if there exist a significant correlation between goodwill costs and a firm’s share price.
Since Hamberg et al. (2014) found goodwill costs to be significant in their research in a similar setting, it will be examined if this statement is applicable to this setting as well. The difference in their sample is that it investigates all firms in OMX Nasdaq for the period 2001-2010, while the sample of this thesis is OMXS30 during the period of 1999-2009.
The thesis examines the association between share prices but adds the perspective if there is a difference after the implementation of IFRS 3 to be able to see if the implementation of the impairment regime made a difference in the reaction of the investors to the
3.4 Model
In the regression model, SPRICE is the dependent variable and there are nine different independent variables to test which variables explain the variation in share price. The regression has data that has a span from 1999-2009. As such, the regression for the thesis is as follows. Regression model (1999-2009)2: 𝑆𝑃𝑅𝐼𝐶𝐸 = 𝐴𝑀𝑂𝑅𝑇 ∗ {𝑎0+ 𝛽1𝑇𝐴𝑖,𝑡+ 𝛽2𝑇𝐿𝑖,𝑡+ 𝛽3𝑅𝑂𝐸𝑖,𝑡+ 𝛽4𝐺𝑊𝑖,𝑡+𝛽5∆𝐺𝑊𝑖,𝑡 +𝛽6𝐺𝑊𝐶𝑖,𝑡+ 𝛽7∆𝐺𝑊𝐶𝑖,𝑡,+ 𝛽8𝐸𝐴𝑅𝑁𝑖,𝑡+ 𝛽9∆𝐸𝐴𝑅𝑁𝑖,𝑡 } +𝐼𝑀𝑃 ∗ {𝑎0+ 𝛽1𝑇𝐴𝑖,𝑡+ 𝛽2𝑇𝐿𝑖,𝑡+ 𝛽3𝑅𝑂𝐸𝑖,𝑡+ 𝛽4𝐺𝑊𝑖,𝑡+𝛽5∆𝐺𝑊𝑖,𝑡 +𝛽6𝐺𝑊𝐶𝑖,𝑡+ 𝛽7∆𝐺𝑊𝐶𝑖,𝑡,+ 𝛽8𝐸𝐴𝑅𝑁𝑖,𝑡+ 𝛽9∆𝐸𝐴𝑅𝑁𝑖,𝑡 } 𝜀
The independent variables that are tested for the hypothesis are GWC. The GW, ∆GW and ∆GWC variables are included to see if the size of the goodwill post, the change of size and the change in the goodwill cost may have an association with the share price. TA, TL, ROE, EARN and ∆EARN are included since all of them have been found to be related to share price in the past. As such, these variables work as control variables for this thesis. The dummy variables Amort and IMP are used to see the differences between the different regimes. Before the implementation of IFRS 3, Amort equals 1, and after 0. Before the implementation of IFRS 3 IMP equals 0, and after 1.
3.5 Variables
The thesis uses the following variables in the regression model:
In the model, SPRICE is used as the dependent variable. SPRICE is the value of the share the third month after the end of the company’s fiscal year. The third month is chosen to make sure that the financial statement has been published before the share estimation, in line with Jennings et al. (2001).
The variable total assets represent the firm’s size in terms of total assets. It has been studied previously that size has an effect on a firm’s share price. Zaheri and Barkhordary (2010), found that total assets have a positive relationship with share price, i.e. the bigger
Table 2 - Variables used in the regression model
Variable explanation Dependent variable
SPRICE(i, t) The share price of firm i, in period t.
I ndependent variables
TA (i, t) Total assets of firm i, for the period t.
TL (i, t) Total liabilities of firm i, for the period t.
ROE (i, t) Return on equity for firm i, period t.
GW (i, t) The amount of goodwill recognized in balance sheet by firm i,
period t.
∆GW (i, t) Changes of amount of goodwill recognized in balance sheet of firm
i, from period t-1 to t.
GWC (i, t) Goodwill costs (amortizations or impairments) for firm i, period t. ∆GWC (i, t) Changes of goodwill costs recognized of firm i, from period t-1 to t. EARN (i, t) Amount of earnings recognized by firm i, period t. ∆EARN (i, t) Changes in earnings recognized between year of firm i, from period
t-1 to t.
AMORT (IMP)
An indicator variable which equals 1 for observations occurring in the amortization period (impairment period) and equals 0 if not.
the firm is the higher the firms share price. Therefore, total assets are included in the model, to see if the amount of total assets has an effect on the share price.
Total liabilities are also included in the model. When the association between leverage (debt in relation to total assets) and share return has been tested in the past, there have been mixed results. Ho, Strange and Piesse (2008) and Zaheri and Barkhordary (2015) found no evidence of a statistically significant correlation between leverage and share price while Bhandari (1988) found a positive correlation between share price and leverage. Since there are conflicting evidence, total liabilities are added to the model instead of leverage to test if that variable has more relation to the share price. ROE is a performance-based variable. ROE is included since previous research, e.g. Mehrani and Mehrani (2003), have found that the variable has a significant relationship with share price. ROE measures the firm’s use of its equity and how it turns the equity that it has into returns.
Balance of the goodwill post, goodwill costs and the change between each year of each of the two variables are added to the regression in accordance with the research provided from Hamberg (2014) since they were statistically correlated with the share price.
Goodwill costs were divided into two different variables, goodwill impairment and goodwill amortization, but in this thesis, they are merged in to one variable - goodwill cost.
The earnings of the firms, and the change in earnings are added as two separate
independent variables. Earnings and change in earnings have a history of being included in return models in prior research such as Easton and Harris (1991) and Lev and Zarowin (1999). Both variables have been proven in similar return models to have an impact on share price which is shown by Easton and Harris (1991).
The thesis expects firms reported earnings to increase in the impairment regime since the need for annual amortization has been removed. Hence, the expectation of future cash flow should be higher for a firm which carries goodwill in their balance sheet after the adoption of IFRS 3 since the removal of amortizations enable the firm to make a choice to make an impairment or not, which could lower the costs of the firm. This might affect the value of equity in the market. The history of amortizations of goodwill had no
correlation with the performance of the firm, which is why this accounting information about goodwill under the amortization regime was ignored (Jennings, Robinson, Thompson and Duvall, 1996).
The price of a share may vary a lot and there are many dependent variables. Jennings et al. (1996) explains the treatment of goodwill as one of these dependent variables. The thesis expects to gain results explaining that there is an association between how the goodwill costs are treated and the share price, hence that impairments do affect the share price. The thesis argues that goodwill costs under an amortization regime does not provide much information to investors, instead this simply adds more noise in an annual report. Due to previous research which the thesis refers to in the literature review the thesis expects that there will be a correlation between the goodwill cost and the share price as well (Hamberg et al., 2011).
4
Results
4.1 Descriptive statistics
The table below presents the descriptive statistics for the thesis. The mean value of goodwill for the sample is 11 155 million SEK. The maximum value of goodwill is 60 102 million SEK which shows a significant difference between the firms. The mean cost of goodwill is 728 million SEK, where the largest goodwill cost equals 9 795 million which was recognized by Stora Enso in 2002.
There is a big variation in size of total assets within the sample. The average firm reports total assets of 498 851 million SEK while the firm with the most assets recognized in their balance sheet reports a total of 5 390 777 million SEK. There is a variance in size in the thesis because of the inclusion of Swedish banks. The four banks which is included in the sample is significantly larger than the average firm. The banks are the biggest four firms in the sample. The firm with largest size in terms of assets, except the banks, is Nokia in 2008 which recorded a total of 380 billion SEK.
Table 3 - Descriptive Statistics
Variables Median Mean Std.
Deviation Minimum Maximum
TA 88 505 498 851 902 759 10 694 5 390 777 TL 55 733 447 462 876 358 8 104 5 152 648 ROE* 20,38% 26,51% 49,67% -37,55% 413,95% GW 9 331 11 155 9 065 1 60 102 ∆GW -1,5 761 5 599 -11 385 47 302 GWC 229 728 1 478 0 9 795 ∆GWC 0 133 1 702 -8 736 9 644 EARN 3 829 5 747 8 292 -21 264 33 126 ∆EARN 151 -459 5 462 -42 282 10 556 SPRICE* 80,88 90,58 73,82 14,19 750,21 N=152
All numbers are presented in millions SEK
4.2 Pearson correlation
Table 4 - Pearson Correlation
Observations amortization n=76 Total assets Total
liabilities ROE Goodwill
Change GW GWC Change GWC EARN Change earn Share price TA 1,0000 ,999** -0,0560 0,1896 -0,0807 -0,0168 0,0030 ,313** 0,0349 -0,0732 TL ,999** 1,0000 -0,0463 0,1827 -0,0817 -0,0398 0,0029 ,287* 0,0438 -0,0981 ROE -0,0560 -0,0463 1,0000 -,271* 0,0752 -0,1992 -0,1560 ,435** ,274* 0,0471 GW 0,1896 0,1827 -,271* 1,0000 ,284* 0,1053 0,0811 -0,0718 -0,0671 0,0107 ∆GW -0,0807 -0,0817 0,0752 ,284* 1,0000 -,372** -0,1698 0,0637 -0,0266 0,0984 GWC -0,0168 -0,0398 -0,1992 0,1053 -,372** 1,0000 ,635** 0,1248 -,272* 0,2059 ∆GWC 0,0030 0,0029 -0,1560 0,0811 -0,1698 ,635** 1,0000 -0,1375 -,380** 0,1188 EARN ,313** ,287* ,435** -0,0718 0,0637 0,1248 -0,1375 1,0000 ,369** ,273* ∆EARN 0,0349 0,0438 ,274* -0,0671 -0,0266 -,272* -,380** ,369** 1,0000 -0,1154 Share price -0,0732 -0,0981 0,0471 0,0107 0,0984 0,2059 0,1188 ,273* -0,1154 1,0000 Observations Impairment n=76 Total assets Total
liabilities ROE Goodwill
Change GW GWC Change GWC EARN Change earn Share price TA 1,0000 ,999** -0,1379 0,2256 0,0221 0,0289 0,0310 ,620** 0,0021 -0,0514 TL ,999** 1,0000 -0,1300 0,2062 0,0075 0,0181 0,0206 ,610** 0,0069 -0,0559 ROE -0,1379 -0,1300 1,0000 -,241* 0,0137 -0,1205 -0,0732 -0,0428 0,1359 0,1891 GW 0,2256 0,2062 -,241* 1,0000 ,520** ,434** ,378** 0,0899 -,241* -0,0472 ∆GW 0,0221 0,0075 0,0137 ,520** 1,0000 -0,2082 -0,1865 0,1239 -0,1040 ,283* GWC 0,0289 0,0181 -0,1205 ,434** -0,2082 1,0000 ,937** -0,1384 -0,1099 -0,0130 ∆GWC 0,0310 0,0206 -0,0732 ,378** -0,1865 ,937** 1,0000 -0,1122 -0,0842 -0,0206 EARN ,620** ,610** -0,0428 0,0899 0,1239 -0,1384 -0,1122 1,0000 ,431** 0,1058 ∆EARN 0,0021 0,0069 0,1359 -,241* -0,1040 -0,1099 -0,0842 ,431** 1,0000 0,1316 Share price -0,0514 -0,0559 0,1891 -0,0472 ,283* -0,0130 -0,0206 0,1058 0,1316 1,0000
**. Correlation is significant at the
0.01 level (2-tailed).
*. Correlation is significant at the
Table 4 presents the Pearson correlation coefficients for the variables of the regression for both periods. The Pearson correlation coefficient measures the association between to variables in a linear regression and the value of the coefficient can be from -1 to 0 and 0 to 1 (Oxford Reference, n.d.). The Pearson correlation table is included for transparency reasons since there is a large correlation between the two variables TA and TL, 0,99 Pearson correlation for both regressions. Thus, TL is excluded from the final regression to avoid any problem with multicollinearity.
The thesis also recognizes the correlation between other variables and its close relation to the change of the same variable. As an example, there is a correlation that is significant at the 0,05 level between GW and ∆GW. This concern is identified with GWC and ∆GWC and EARN and ∆EARN as well. Since all these variables are closely related in nature, e.g. ∆GW is based on GW, the subsequent correlation between the variables is expected. This could result in a problem with multicollinearity. However, the thesis still argues that all variables except TL are important to test against the dependent variable and that the multicollinearity is not as big as for TA and TL.
4.3 Linear regression
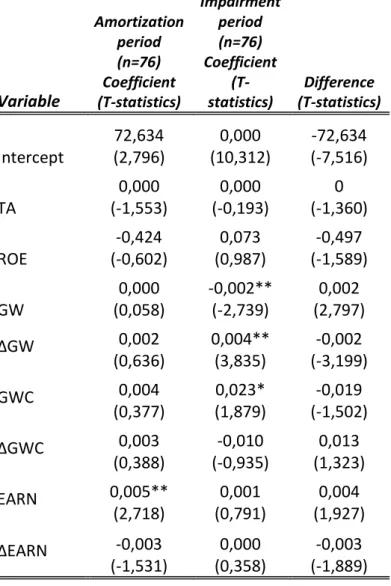
Table 5 displays the results from the linear regression. The model had an explanatory power of 8,8% for the amortization regime and 14,6% for the impairment regime. That means that the independent variables in the regression explains 8,8% and 14,6% of the variation in the dependent variable.
Table 5 - Linear regression
Variable Amortization period (n=76) Coefficient (T-statistics) Impairment period (n=76) Coefficient (T-statistics) Difference (T-statistics) Intercept 72,634 (2,796) 0,000 (10,312) -72,634 (-7,516) TA 0,000 (-1,553) 0,000 (-0,193) 0 (-1,360) ROE -0,424 (-0,602) 0,073 (0,987) -0,497 (-1,589) GW 0,000 (0,058) -0,002** (-2,739) 0,002 (2,797) ∆GW 0,002 (0,636) 0,004** (3,835) -0,002 (-3,199) GWC 0,004 (0,377) 0,023* (1,879) -0,019 (-1,502) ∆GWC 0,003 (0,388) -0,010 (-0,935) 0,013 (1,323) EARN 0,005** (2,718) 0,001 (0,791) 0,004 (1,927) ∆EARN -0,003 (-1,531) 0,000 (0,358) -0,003 (-1,889) ** Significant at 5% * Significant at 10%
In the amortization regime, the only variable of the ones tested against share price that has a statistically significant correlation with the dependent variable is EARN. EARN has a positive correlation with share price which means that an increase in the earnings of the company increases the share price as well. The rest of the variables does not have a statistically significant association with the share price, including the variable goodwill cost which represent the amortization cost of goodwill.
For the impairment regime, there are several variables that do have a statistically significant correlation with share price. Variables GW, ∆GW and GWC are all
statistically significant at the 10%-level, with both GW and ∆GW also being statistically significant at the 5%-level. The correlation with share price is positive for ∆GW and GWC while GW has a negative correlation with share price.
The comparison between the two samples shows that there is a difference between them. The three variables (GW, ∆GW and GWC) that do have a statistical significance for the impairment regime are not statistically significant for the amortization regime while the only variable (EARN) that is statistically significant for the amortization regime is not statistically significant in the impairment regime.
5. Analysis
The thesis has one hypothesis to be able to answer the research question. The level of significance for the regression is at the 10%-level to be able to determine at which confidence-level to reject or accept the hypothesis. The 10% represent the likelihood of the making a Type I error (Anderson, Sweeney, Williams, Freeman and Shoesmith 2015).
The hypothesis in the thesis concern if there is any difference between the amortization and impairment regime in association with share prices. The result from the regression analysis conducted states that there is a difference through the two regimes. In the amortization regime the variable GWC is not associated with share price. This changes for the impairment regime where GWC is found to have an association with share price with a significance of 0,065, and a positive relationship 0,023. Based on the hypothesis and the results from the regression, the thesis rejects H1. Since H1 states that there is no difference between the amortization and impairment regime.
Thus, the research question of this thesis has been answered through the hypothesis. H1 is rejected, since there is a difference between the two periods according to the results provided from the regression analysis. Thus, the results from the linear regression means that the answer is that there is a difference between the two periods. Chalmers et al. (2011) found that there was a difference between the two different regimes and
concluded that the regulators were right to implement the impairment regime. The results of this thesis are therefore agreeing to this result from Chalmers et al. (2011), since the results did reveal a difference between the periods.
The variables that is control variables in the model do experience a change between the two different periods as well. GW and ∆GW are both statistically significant in the correlation with share prices during the impairment regime while the remain not
statistically significant in the amortization regime. The GW and ∆GW represent the size of the goodwill post. In the amortization regime the size of the goodwill post was
consistently amortized while during the impairment regime there is no need to impair the size of the goodwill post as long as the impairment test does not end with an impairment. Investors have according to the results taken this into account. When the goodwill post was amortized on a yearly basis the investors did not take that into account when making
investing decisions. However, when the goodwill post has been tested for impairment based on fair values the investor has taken that into account when making their
investment decisions. As such, the implementation of the impairment regime has resulted in an investment environment where investors look at the size of the goodwill post when making their decisions to either sell or buy a share, which was not the case during the amortization regime.
The results of the regression do as is mentioned above reveal the statistically significant relationship between GW, GWC and ∆GW in the impairment regime. However, the sign of the correlation can seem to be counter-intuitive. GW has a negative correlation with share price and GWC has a positive correlation with share price. The correlation would therefore mean that when the size of the goodwill post increases, the share price is decreasing and when there is an increase in the impairment cost the share price is increasing. This is counter-intuitive since if the goodwill post is increasing the profit/loss-account increases, while an increase of the impairment cost decreases the profit/loss-account. It is difficult to determine a specific reason for this result, but a possible explanation is that investors are of the opinion that a bigger goodwill post is a result of earnings management and manipulation of the result, as has been argued by AbuGhazaleh et al. (2011). If managers do not record an impairment even though it would be reasonable to do so, the goodwill post will increase, and the goodwill cost will not increase. But if they instead record an impairment, investors could be of the opinion that the firm is revealing numbers that reflects reality better.
As well as GW and ∆GW, EARN is significant in one period but not significant in the other period. In contrast to the other variables however, EARN is significant in the amortization regime and not significant in the impairment regime. The statistically significant correlation between EARN and share price during the amortization regime is positive, thus meaning that an increase in EARN leads to an increase in the share price. The variable is however not significant in the impairment regime. As such, in the amortization regime goodwill was not affecting share prices but the earnings were the variable from this set of variables that were affecting the investment decisions. The remaining control variables, namely TA, ROE, ∆GWC and ∆EARN is not statistically significant in neither the amortization nor the impairment regime. These
prices in previous research (Zaheri and Barkhordary 2015, Mehrani and Mehrani 2003, Hamberg 2014 and Easton and Harris 1991) but in this setting the variables did not prove to be that. TA did shift very much between the different firms in this setting, where the financial institutes had much higher TA than the rest of the sample, which may have affected the relationship between TA and share price. ROE did also vary much between the different firm-year observations, with a maximum value of 413% and a minimum value of -37,55%. Since some firms are highly dependent on liabilities and have small amounts of equity, the percentage becomes very high in some cases which investors may not take into account and look at the earnings directly. ∆GWC and ∆EARN are both closely related to GWC and EARN and can therefore be affected by the correlation between those variables. However, since ∆GWC can represent a small negative change but the GWC can still be large, for example in year X1 GWC could be 1 million SEK and in year X2 900 thousand SEK, investors might be taking the cost of 900 thousand SEK into account rather than the negative change in cost of 100 thousand SEK. The same goes for ∆EARN, earnings might be decreasing but it could still be a huge profit for the
company which leads to the investors not taking the change into account.
The results from this thesis is also analysed from a theoretical perspective. In this thesis, the results revealed that a relationship between GWC and share prices exist under the impairment period. This means that investors do make decisions based on financial information regarding GWC. In this case, there is a difference between the amortization regime compared to the impairment regime. Therefore IFRS 3 has made a difference for the agency problem. There is a difference how investors react to the treatment of
goodwill. Before the implementation of IFRS 3 it was not a post which investors took into account, but after the implementation this has become relevant for investors.
Meaning that under the amortization period the investors did ignore the cost of amortize goodwill, but under the impairment regime it has not been ignored since it affects the share price.
Therefore, information asymmetry was more apparent during the amortization regime compared to the impairment regime. During the impairment regime investors do take the goodwill cost into account when making investment decisions, compared to the
amortization regime. Information asymmetry is therefore less apparent during the impairment regime, since the new regime has made the information of the goodwill post
more influential for the investors. In the amortization regime the asymmetry was larger since the amortization of goodwill did not have a statistically significant correlation with the share price.
The interpretation of the difference in information asymmetry between the two regimes may come from the fact that amortizations do not bring any informational value to investors compared to impairments. Amortizations do not reveal anything about the performance of the company, since amortizations are linear devaluations based on the estimated life-cycle of the goodwill post. Impairments on the other hand are based on fair-values, which means that it means that it reveals information about how the goodwill is valued from a market perspective. Thus, it reveals information about how the company has performed in some capacity, while amortization does not say anything about the company’s performance.
6. Conclusion
This thesis investigates the relationship between goodwill costs and share prices and if that relation changed after the adoption of IFRS 3. The topic has been discussed in the past and switch from the amortization method to the impairment method has received criticism. The switch meant that instead of amortizing the goodwill post every year the managers were due to make impairment tests every year instead. To measure if that change had any implications, the thesis chose to test the association between goodwill costs with share price, to see if the stock market had any reaction to the amortization or impairment of goodwill.
The thesis used a sample that consisted of 19 different firms on the OMXS 30 Index. The thesis selects these companies based on the information available for the years the thesis examined, which is 2000-2009. From these firms the thesis has a total of 152 firm-year observations. These firm-year observations are used in the linear regression to examine the relationship between goodwill cost and share prices.
The results of the linear regression revealed that the goodwill costs do have an association with share prices under the impairment regime, but not for amortization regime for the sample used in this thesis. The main finding is that the regulatory change to IFRS 3 did have a significance for investors and variations in the share prices which is proven by the analysis of GWC.
Furthermore, this thesis shows that the regulatory change from the amortization regime to the impairment regime has impacted the decision making of investors. This is supported by previous research that provides similar results (Chalmers et al. 2011).
Finally, the findings of the thesis do support the IASB’s decision to implement the impairment regime instead of the amortization regime. From the perspective of the investors, the impairment regime has increased the impact of the goodwill costs on the decision to either sell or buy shares. Therefore, the impairment regime has proven to increase the information value of the goodwill post compared to the amortization regime.
7. Discussion
The aim for this study was to examine whether there is a difference in the amortizations and impairment associations with the company share price to see if the goodwill costs are relevant from an investor’s perspective. As presented in table 5 the thesis comes to the conclusion that there is a difference. In addition, the thesis finds other variables that shows a significance in the company share price, such as GW in the impairment regime.
From the analysis the thesis states that the results found are not consistent with previous literature in terms of that there exists a difference between the impairment regime and the amortization regime (Chalmers et al. 2011).
As stated in section 3.5 the thesis expected results that the size of the goodwill balance should correlate with the company share price. This can be accepted after the completion of the regression analysis, as seen in table 5 there is an association between GW and share price for the impairment regime. The change of goodwill is also significant, and has a positive relationship to the share price, which is in line with Hamberg et al. (2011) which argued that firms with more capitalized goodwill shows a higher return in general.
The thesis also argued in section 3.5 that the expected result is that the goodwill cost before implementation (amortization) is not relevant to investors, but simply add more noise to the reader of the financial reports and hence that the information value increases under the impairment regime.
7.1 Limitations
The thesis examines whether there is an association between a firm’s share price and its goodwill costs and if this has changed during the implementation of IFRS 3. Since the implementation occurred in 2004 the thesis had to go back some years to collect the necessary data. This caused an issue where the data needed was not available in most databases, leading to manual collecting of the data. Because of this the thesis was not able to collect all data in one database, instead the thesis collected the financial
information from Retriever Business, and mainly annual reports. The information of the share price was collected from Yahoo Finance.
The need to collect data from different sources increases the risk of mistakes due to that the data may be presented differently on these three sources. However, where there was doubt the authors used the annual report as the main tool to resolve potential issues.
Another limitation of the thesis is the narrow setting. The thesis is aware that the setting examined is a narrow group of companies in a special setting with a certain set of laws and governing rules. Hence the outcome of this study may not be reproduceable in other settings if attempted. The small set of 19 companies over 8 firm-years is also an apparent limitation, since this is a small sample, and a bigger sample increases the probability to make an accurate assumption about the population.
The limitations presented are issues that the thesis is well aware of and has had in mind during the process of writing this thesis. Hence, the awareness might reduce the risk of drawing to strong conclusions on the result presented.
7.2 Future research
For future research purposes this thesis suggest that the study could be replicated by future scholars. This thesis is quite specialized and has a narrow sample. To examine whether the result of this thesis is consistent in other settings or in a larger sample would be interesting, since the results is not consistent with prior authors results.
This thesis investigates the sample of selected firms included in OMXS30, it could be further examined if the perspective is broadened to as an example the entire Stockholm stock exchange. Since the thesis only managed to gather data for 19 companies, there is more companies that could be investigated within this area. The opportunity to select more years to collect data from, especially more recent years, to see if the relationship between goodwill cost and share price has changed the longer the impairment regime has been implemented.
It would also be interesting to compare different industries within this aspect as well. Since the sample for this thesis is small, a larger sample gives an opportunity to divide the sample into different industries. This thesis noticed for example that companies in this sample that is from the banking industry has very large amount of assets and
goodwill compared to other industries, which make it interesting to see if that could be a reason for investors to react differently to goodwill.
The thesis also encourages future research to see if there is a difference between a
European country like Sweden and another country like the USA. The US uses fair value estimations when measuring goodwill but instead of IFRS standards they follow the US GAAP. Therefore, it would be interesting to see, by using the same method as in this thesis, if there is a similar reaction to share prices in an American setting to a European setting.
7.3 Social and ethical implications
The effect of the results of this study on a societal and ethical perspective is also discussed. Since the thesis found that after the change from the amortization regime to the impairment regime, share prices are more associated with goodwill costs, there are some societal and ethical consequences. First of all, this is evidence that the IASB made the right decision to switch from the amortization to the impairment regime. Thus, this thesis supports the decisions made by the IASB and therefore the thesis is contributing to increase the trust for the IASB in general. Secondly, the evidence from the thesis can also be used by people in general. When investors are making investment decisions goodwill is one factor that is taken into account, which could be a sign for other people to have a look at the goodwill post when making investment decisions.
From an ethical point of view, the thesis contributes with evidence that the information regarding goodwill has proven to be more useful for investment decisions. Thus, since there are other papers, such as AbuGhazaleh et al. (2011), that argue that the impairment regime has increased opportunistic behaviour by managers, this thesis is a counter-argument to that. The impairment regime is according to the results of this thesis more valuable when making investment decisions than the amortization regime, which arguably could point to the fact that opportunistic behaviour is not seen as a problem.
8. Reference list
AbuGhazaleh, N, M., Al-Hares, O, M. and Roberts, C. (2011). Accounting Discretion in Goodwill Impairments: UK Evidence. Journal of International Financial Management &
Accounting, 22(3), 165-204.
Anderson, D, R., Sweeney, D, J., Williams, T, A., Freeman, J. and Shoesmith, E. (2015).
Statistics for Business and Economics. United Kingdom: Cengage Learning EMEA
Beatty, A. and Weber, J. (2006) Accounting discretion in fair value estimates: An
examination of SFAS 142 Goodwill Impairments. Journal of accounting research, 44(2). Bens, D., Heltzer, W. and Segal, B. (2011). The Information Content of Goodwill
Impairments and SFAS 142. Journal of Accounting, Auditing and Finance, 26, 526-555. Bhandari, L. C. (1988). Debt/Equity Ratio and Expected Common Stock Returns: Empirical Evidence. Journal of Finance, 43(2), 507-528.
Callao, S. and Jarne, J. (2010). Have IFRS Affected Earnings Management in the European Union. Accounting in Europe, 7, 159-189
Carlin, T, M. and Finch, N. (2009). Discount Rates in Disarray: Evidence on Flawed Goodwill Impairment Testing. Australian Accounting Review, 19(4), 326-336.
Chalmers, K, G., Godfrey, J, M. and Webster, J, C. (2011). Does a goodwill impairment regime better reflect the underlying economic attributes of goodwill? Accounting and
Finance, 51(3), 634-660.
Duff & Phelps (2017). 2017 European Goodwill Impairment Study. Retrieved from:
https://www.duffandphelps.com/-/media/assets/pdfs/publications/valuation/gwi/2017-eu-goodwill-impairement-study.ashx
Easton, P. and Harris, T. (1991). Earnings As an Explanatory Variable for Returns. Journal of Accounting Research, 29(1), 19-36.
Francis, J., Hanna, J. D. and Vincent, L. (1996). Causes and effects of discretionary asset write-offs. Journal of Accounting Research, 34, 117–134
Hamberg, M, A., and Beisland, L-A. (2014). Changes in the Value Relevance of Goodwill Accounting following the Adoption of IFRS 3. Journal of International
Accounting, Auditing and Taxation, 23(2), 59-73.
Hamberg, M., Paananen, M. and Novak, J. (2011). The Adoption of IFRS 3: The Effects of Managerial Discretion and Stock Market Reactions. European Accounting Review,
Ho, R. Y. W., Strange, R. and Piesse, J. (2008). Corporate financial leverage and asset pricing in the Hong Kong market. International Business Review, 17(1), 1-7.
IAS Plus. (n.d.) IAS 22: Business Combinations (superseded). IAS Plus. (n.d.) IAS 36: Impairments of Assets.
IAS Plus. (n.d.) IFRS 3: Business Combinations.
IASB Press release (2004). IASB issues standards on business combinations, goodwill
and intangible assets.
https://www.iasplus.com/en/binary/pressrel/2004pr06.pdf?fbclid=IwAR2Hnq4w_EMbub kJSqmkfGp1XPWWrFVi8oi5Vbv0t0x3YJlMBKNgczNcCBU
IFRS Foundation. (2017). IAS 36: Impairment of Assets. IFRS Foundation. (2017). IFRS 3: Business Combinations.
International Accounting Standards Board (2005). International Financial Reporting Standards (IFRS) including Basis of Conclusions
Jennings, R., LeClere, M. and Thompson, R. B. (2001). Goodwill amortization and the usefulness of earnings. Financial Analysts Journal, 57(5), 20–28.
Jennings, R., Robinson, J., Thompson, R. B. and Duvall, L. (1996). The relation between accounting goodwill numbers and equity values. Journal of Business, Finance and
Accounting, 23, 513–533.
Jensen, M. and Meckling, W. (1976). Theory of the Firm: Managerial Behaviour,
Agency Costs and Ownership Structure. Journal of Financial Economics, 3(4), 305-360. Jeter, D., Chaney, P. and Daley, M. (2008). Joint accounting choices: an examination of firm’s adoption strategies for SFAS No. 106 and SFAS No. 109. Review of Quantitative
Financial Accounting, 30, 153–185.
Lev, B. and Zarowin, P. (1999). The Boundaries of Financial Reporting and How to Extend Them. Journal of Accounting Research, 37(2), 353-385.
Li, K, K. and Sloan, R, R. (2017). Has Goodwill Accounting Gone Bad? Review of
Accounting Studies, 22(2), 964-1003.
Li, Z., Shroff, P, K., Venkataraman, R. and Zhang, I, X. (2011). Causes and
Consequences of Goodwill Impairment Losses. Reviews of Accounting Studies, 16, 745-778.
Mehrani, S. and Mehrani, K. (2003). Relationship between the profitability ratios and stock returns, Journal of Accounting and Auditing Studies, 23, 93-105
Moehrle, S. R., Reynolds-Moehrle, J. A. and Wallace, J. S. (2001). How informative are earnings numbers that exclude goodwill amortization? Accounting Horizon, 15(3), 243-255.
Nasdaq (2019) OMX Stockholm 30 index.
https://indexes.nasdaqomx.com/Index/Overview/OMXS30
Paananen, M. and Lin, H. (2009). The Development of Accounting Quality of IAS and IFRS over Time: The Case of Germany. Journal of International Accounting Research,
8(1), 31-55
Riedl, E.J. (2004). An examination of long-lived asset impairments. Accounting Review,
79(3), 823-852.
Shapiro, S. P. (2005). Agency theory. Annual Review of Sociology, 31, 263. Trainer, D. (2018, December 17). How Price to Book Misleads Investors. Forbes. Retrieved from: https://www.forbes.com/sites/greatspeculations/2018/12/17/how-price-to-book-misleads-investors/
Watts, R. L. (2003). Conservatism in accounting part I: Explanations and implications. Accounting Horizons, 17(3), 207-221.
Zaheri, F. and Barkhordary, S. (2015). Relationship between Financial Characteristics of Companies in Cement Industry and Their Stock Returns in Tehran Stock Exchange.
9. Appendix
Appendix 1 - List of companies
Assa Abloy Atlas Copco Boliden Electrolux Ericsson Handelsbanken Nokia Nordea Sandvik SCA SEB Securitas Skanska SKF Stora Enso Swedbank Swedish Match Tele 2 Volvo
Total number of firms 19