ICT Investment and the
Effect on Economic Growth
BACHELOR THESIS WITHIN: Economics
NUMBER OF CREDITS: 15 ECTS
PROGRAMME OF STUDY: International Economics & Policy
AUTHORS: Emil Karlsson
Jennie Liljevern
TUTORS: Johan P Larsson
Amedeus Malisa
JÖNKÖPING June 2017
i
Bachelor Thesis in Economics
Title: ICT Investment and the Effect on Economic Growth – a Comparative Study across Four Income Groups
Authors: Emil Karlsson and Jennie Liljevern Tutor: Johan P. Larsson and Amedeus Malisa Date: 2017-06-15
Key terms: Information and Communication Technologies, ICT Capital Services, Economic Growth, Income Groups
JEL Classification: C23, E13, E22, O11, O43
Abstract
The purpose of this study is to investigate if growth in ICT investments affects output growth differently across four income groups. Our panel data analysis is based on a sample of 101 countries in the period 1995-2015, where we conduct an augmented Cobb-Douglas production function with GDP growth as dependent variable. We divide the regression sample into high-, upper middle-, lower middle- and low-income countries to account for income disparities across countries. The outcomes are measured by estimating both ordinary least square and a fixed effects model. The impact of capital investments is measured by using two variables; growth of ICT capital services and non-ICT capital services. In addition, we control for exports and the growth in labor quality. Our major findings show that there are only significant contributions to growth in the top-three richest countries, with exception for the middle-income countries when controlling for fixed effects.
ii
Table of Contents
1. Introduction ... 1 1.1 Problem ... 1 1.2 Purpose ... 2 1.3 Outline ... 22. Background & Related Literature ... 4
2.1 Definition of ICT... 4 2.2 Related Literature ... 4 3. Theoretical Framework ... 7 4. Empirical Framework ... 10 4.1 Data ... 10 4.2 Country Classification ... 12 4.3 Empirical Model... 12 4.4 Descriptive Statistics ... 14 5. Empirical Analysis ... 17 5.1 Results ... 17
5.2 Analysis & Discussion ... 20
6. Conclusion ... 24
iii
Tables
Table 4.1 - Descriptive Statistics: High-Income Countries 1995-2015 ... 15
Table 4.2 - Descriptive Statistics: Upper Middle Income Countries 1995-2015 ... 15
Table 4.4 - Descriptive Statistics: Low-Income Countries 1995-2015 ... 16
Table 4.3 - Descriptive Statistics: Lower Middle Income Countries 1995-2015 ... 16
Table 5.1 - All countries – Dependent Variable: gGDP - 1995 – 2015... 17
Table 5.2 - Dependent Variable gGDP - 1995 –2015 ... 19
Appendices
Appendix 1 – List of Countries ... 30Appendix 2 – Descriptive Statistics ... 31
Appendix 3 – Augmented Dickey-Fuller unit root tests ... 31
Appendix 4 – Jarque-Bera Normality Test ... 34
1
1. Introduction
Technological development is commonly known as the main driver behind employment and economic growth. Increased innovations for information and communication technologies (ICTs) have, in particular, been discussed to be the primary transformer for economic processes as production and trade during recent decades (World Bank, 2017a). Ever since the growth in productivity rates for many developed countries during the 1990’s, the increased utilization of ICT capital has been exceptional (Venturini, 2006). The highest shares of ICT capital investments in 2013 were found in Europe, where OECD (2015) estimates that nearly 4% of GDP in Switzerland and Czech Republic were devoted to these kinds of assets. It might be considered as a low share of total GDP, but when looking at the internet connection globally the usage among the population in 1995 reached 0.78% and increased by 15 percentage points ten years later (World Bank, 2017b). The World Bank estimates that almost half of today's population live in regions provided with internet connection, but only 1 out of 7 inhabitants in least developed countries can use it (2017a). Since many of the ICT related devices are reliant on internet connection, they argue for the expensive access and an underdeveloped infrastructure in developing countries to be the main obstacles in ICT investments (World Bank, 2017a). Although the implementation of digital agendas is becoming a governmental priority worldwide, the use is very dispersed across countries and regions. This is shown by GSMA (2016) which estimates that nearly 85% of the Europeans and almost 79% of the Americans in 2015 did have some sort of mobile subscription, while only 43% of the population in Sub-Saharan Africa had one.
1.1 Problem
Due to these assets’ potential and complementary effects on labor and capital, ICT has been a center of dispute among researchers investigating growth of economies during recent decades. A common conclusion is that investments in internet, broadband and infrastructure for telecommunications are significantly correlated with output growth in developed economies (Röller & Waverman, 2001; Wolde-Rafuel, 2007). Since ICT tends to be positively correlated with income, there could be reasons for one to expect different effects between developed- and less developed countries. Research stress that income differences across countries could be the
2
consequences of country-specific characteristics affecting investment decisions (North, 1991). The quality of national policies incentivizing ICT investments can for example influence the contribution to growth by establishing supportive regulations. However, the effect of ICTs on economies at different levels of income has been somewhat overlooked up until recently and the results regarding the effects on low-income countries, where the support for ICT is assumed to be quite low, are split. Although the research within this topic is currently on the rise, attributes affecting ICT’s contribution to economic growth have not been scrutinized sufficiently.
1.2 Purpose
The purpose of this paper is to add to the existing literature about the effects ICT investments are having on output growth. We analyze how the contribution to GDP growth differs amongst country groups and try to explain what might causing these potential differences with help from previous research. Our approach is inspired by the earlier studies of Yousefi (2011) and Niebel (2014) and follows the empirical methodologies outlined in their papers. However, this study differs in several aspects. This thesis will analyze a greater amount of countries and an increased timespan consisting of 21 years. The rapid increase in ICT assets during 1995 – 2015 and great variability in the adoption, imply that the period is interesting to investigate. The challenge of finding proper and reliable data for all countries makes it a natural decision to only include countries showing values for ICT capital investments during the period. We will divide all countries into different income groups by using the most recent classification by United Nations (2017) and data primarily collected from a comprehensive database by the Conference Board (2016a). We employ an augmented Cobb-Douglas production function which consists of explanatory variables like ICT capital, non-ICT capital, employment growth and additional variables as exports and labor quality.
1.3 Outline
The organization of this study is as follows: Section 2 defines ICT and discusses the main contributions to the topic so far by presenting previous studies. In the theoretical framework, section 3, we discuss relevant theories that can explain the differences in investments and growth at different stages of development. Section 4 presents data and method used to
3
accomplish the empirical analysis in section 5. Finally, we interpret the results and present what we conclude from the estimated regression with help from previous literature and theory. In addition, suggestions for further studies will be presented.
4
2. Background & Related Literature
The common conclusion among previous studies investigating the impact of ICT, is that increased investments in these assets do have positive effects on growth. The contribution to income among countries at different stages of development are however somewhat mixed. We will in this section define the concept of ICT and discuss related literature relevant for our study.
2.1 Definition of ICT
ICT capital are used for many different purposes, not at least for how people communicate and how firms are producing goods and services. The assets permeate the economy through transportations, retail services, educational- and health sectors as well as personal lifestyles. By increased use of automated vehicles and machinery, e-commerce, online classes, healthcare and social networks, ICTs are usually referred to assets such as computers and related hardware, software, communications- and video equipment (OECD, 2017).
2.2 Related Literature
The positive effects of ICTs on economic growth have been confirmed by many members of the OECD and the European Union (Edquist & Henrekson, 2004; Hanclova, Doucek, Fischer & Vltavska, 2015; Falk & Biag, 2015). As suggested by Edquist and Henrekson, with support from Hagsten (2015) who is studying broadband-connection, ICTs have been some of the most important innovations for growth during the past three decades. However, the significant effects of increased ICT capital and e-commerce have not been fully exploited within all countries in the Western World. They stress that countries invested heavily in the production of ICT in the end of the second millennia, experienced higher growth rates in comparison to other countries importing it1. Hanclova et al. (2015) suggest that growth related to ICT in Eastern Europe, consisting most of emerging economies, is less evident. They on the other hand, suggest that investments should be prioritized by upper middle income countries where higher marginal returns are anticipated. This is consistent with Dimelis and Papaioannou (2009), studying ICTs and productivity on the global level. They suggest developed countries have reached higher
1 Edquist and Henrekson (2004) give the example of United States and Nordic countries, which invested in ICT during the 1990’s and created a comparative advantage within the IT industry.
5
growth rates due to advantages of higher learning and experience levels, in relation to developing countries. These factors tend to lower the cost of implementation and lead to faster technological distribution in the society. Steinmuller (2001) in contrast, argues that less developed countries can achieve higher growth rates through ICTs. The strategy of
leapfrogging enables poor economies to skip some steps related to capability building, e.g.
historical experience, by bypassing some of the old technologies that developed countries have established. He states that the phenomenon of leapfrogging is possible and almost every country can benefit from it. For countries to overcome obstacles hindering these opportunities, the World Bank (2017a) argues that effective reforms set by governments must be fulfilled. Well-established national strategies for ICTs are crucial for raising private and corporate investments in broadband and telecommunications and make the accessibility less expensive. King et al. (1994) argue that institutions are big influencers that foster a good environment for ICT investments. By supporting e.g. higher education, governments can increase the human capital stock and through this attract more ICT investments.
Several Granger Causality tests, testing the hypothesis whether ICT causes output growth or not, have yet reached somewhat different results. Beil, Ford and Jackson (2005) for example, state that economic growth is causing increased investments in telecommunications. They suggest that policies aiming to stimulate investments and improve GDP growth, could therefore be ineffective. Röller and Waverman (2001) and Wolde-Rufael (2007) argue for a more common conception that investments in ICT instead causes output to grow. Röller and Waverman stress that less developed countries find it harder to achieve higher growth in relation to members of the OECD, due to very low levels of functioning infrastructure in telecommunication. They agree with previous authors that a potential influencer could be the role of institutions. Policies, governmental regulations and corporate incentives should play major roles in developing the infrastructure for telecommunication and thus affect the relationship between ICT and GDP growth.
To shed light on the global impact of ICT, Yousefi (2011) studies the growth across different income groups and finds significant contributions of ICT in most economies, with an exception for the low-income group. However, Dedrick, Kraemer and Shih (2011) argues that developing countries have gained higher productivity rates from ICT investments during recent decades.
6
Countries having growth of tertiary enrollment above the median today, gain relatively more from IT than countries below the median. They discuss the existence of a potential lag between the time of investments in the 1980’s and increased knowledge in how to use different IT assets, to explain the low productivity gains in previous periods. This is in line with the arguments previously mentioned by Dimelis and Papaioannou (2009), which in addition support the fact that less developed countries can gain from ICT investments through the flow of FDI. Furthermore, Yousefi’s investigation has been somewhat criticized for the exclusion of heterogeneity effects, contributing to differences in investments of ICT. As being acknowledged by himself, one should need more appropriate data to do comparisons across countries with different economic conditions. Niebel (2014) chose to follow a similar method by adding exports as a measurement for the openness to trade. Even when including the effects from trade, developing countries are according to Niebel positively affected by increased growth of ICT services. Labor service is only significant in developed and emerging economies, while all tests point at the affection of exports only is significant in emerging countries. Although he concludes that ICT capital services contribute positively to output growth, he does not put much emphasis in discussing what might causes the impact differentials on growth between the three stages of development.
7
3. Theoretical Framework
In this section, we will through economic theory discuss the general impact ICTs are said to have on output growth in different countries. The last paragraph presents the theoretical model used in the empirical part of this study.
Existing theories have for a long time stated capital, labor and technological development to be the main drivers for sustained economic growth. The technology factor is suggested to complement capital and labor in the sense that it brings productivity gains in production by new knowledge and innovations (Solow, 1956; Romer, 1990; Gottfries, 2013). The neoclassical model for growth conceives technology as an exogenous factor. In this case, one should expect income to converge between countries over time because of every economy’s constant access to technological progress. On the other hand, endogenous growth theory does not assume convergence since it attempts to explain how the level of technology varies. Both theories do support the characteristics of diminishing marginal returns on investments. Consequently, expectations about higher returns on investment where lower stocks of capital and labor are anticipated (Gottfries, 2013).
Investments in ICT have not for that long, as the case for other types of non-ICT related capital, been evident to affect economic growth of countries. According to Venturini (2006), the effects could not be realized until the late 1990’s, after the impressive increase of productivity in the United States. He explains that countries’ growth rates today are driven by the process of learning-by-doing, determined by increased usage of ICT in both industries and households. The consumption and investment behaviors of ICT are complementary factors and the spillover effects occurring between households and firms are determined by the social value of capital. He suggests that households own firms and can thus allocate the investment and consumption behavior by existing externality effects. However, Venturini’s model is solely based on the development of a high-income country and might not capture the investment behavior in lower income countries. Avgerou (2003) argues that ICT investments are only successful in those economies that have the prerequisites for implementing and efficiently use the assets. She argues that it should not be surprising if ICT capital can affect economies differently in terms of growth. According to her, economic development is a context-specific process and related to market efficient policies and historical consequences of institutions. Developed countries
8
should therefore hold better technologies in form of ICT, due to their level of prior experience and established infrastructure suitable for efficient use. Glaser, La Porta, Lopez-de-Silanes and Shleifer (2004) argue for human capital to have a greater impact on growth and poverty reduction. They stress that societies are built upon a collection of individual characteristics largely determined by the knowledge and the social capital of its citizens.
Waverman, Meschi and Fuss (2005) stress that demand elasticity for mobile phones in developing countries are significantly above 1. This implies that demand is rising much more in comparison to income. However, they argue that developing countries too often find it difficult to experience growth related to ICT investments due to a so called low telecoms trap, implying an unrealistically high cost which reduces the opportunities for raised productivity. They stress that these consequences are mainly affected by the lack of efficient networks and accessibility of good infrastructure supporting these types of assets. Romer (1990) suggests that countries can access new technologies through the knowledge spillovers occurring through trade. The diffusion of technological factors across countries and companies implies a high importance of a country's magnitude of exports and imports. He argues that countries with relatively low human capital stocks should benefit more from trade due to the external sources of knowledge, research and new innovations. In other words, for less developed countries to achieve higher productivity gains from new technologies, they should focus on integrating with economies with relatively higher stock of human capital. Dollar & Kraay (2002), agrees upon the statement that trade induce countries to grow faster. They stress that trade liberalized economies often tend to have better constitutions supporting commercial exchange and grow more rapidly. A country’s openness to the World should therefore always be taken into consideration when analyzing the growth differentials across countries.
Dimelis and Papaioannou (2009) agree upon the statements mentioned by previous authors - technological progress cannot be the same for all countries around the globe. Every economy is holding different policies and prerequisites e.g. human capital, supporting the implementation of new technologies. North (1991) and Acemoglu, Johnson and Robinson (2001) are suggesting that historical consequences such as colonization, could be a factor of why some countries still find it difficult to reach higher growth rates in relation to others. Time-invariant factors such as institutional climate, should in other words have plausible effects in the
9
development and human capital of countries. Economies that early established solid property rights and governmental structures are today investing more in both capital and education, leading to the development of a larger output stock. United Nations (Information Economy Report, 2006) confirm that governmental actions aiming to invest in ICT capital, should have plausible effects for developing countries to reach higher levels of income. They conclude that ICT adoption can make positive impacts on per capita income even in low-income countries, by raising the human capital endowment and thus raise the efficient use of ICT assets.
A common model used in previous studies investigating the effects of ICT investments on output growth, is the neoclassical model by Solow (1956). In this model the technological factor, or Solow residual2, is a parameter of great matter. It includes all other factors of production that cannot be explained by capital and labor alone. Since growth is discussed to be influenced by technology, which often is determined by factors such as new innovations, externalities, human capital and investment decisions, there are reasons to believe upon a positive relationship between the Solow residual and the capital variable for ICT (Stiroh, 2002), making the neoclassical model suitable to use in this context. Although Stiroh finds little evidence of the positive relationship, he argues that one should not drop the framework of the neoclassical concept since there are strong reasons to believe GDP growth in the digital era is in favor of technological factors. The production function outlined by Solow includes the three following factors of production:
𝑌 = 𝐴𝐾𝛼𝐿1−𝛼
where Y is output stock, K and L is the stocks of capital and labor respectively. A is the technological parameter affecting the productivity of K and L. In addition, the function represents constant returns to scale, implying that 1 unit increase in both capital and labor will contribute to 1 unit increase in the level of output. The values of 𝛼 and (1 − 𝛼) will therefore sum up to one.
10
4. Empirical Framework
This section describes the practical approach chosen to analyze the problem of this thesis, where we put ICT capital as explanatory variable to GDP growth. We begin by describing the data selected for this study followed by a classification of countries. Finally, a presentation of the production function used to analyze our problem and some descriptive statistics, are examined.
4.1 Data
For us to analyze the impact of investments in information and communication technologies to output growth, we need a comprehensive dataset consisting of variables measuring economic inputs of several countries globally. National statistical offices most often estimate domestic values in their own national currencies and are therefore not directly internationally comparable. Fortunately, the Conference Board3 has conducted a great database for this type of study by collecting economic data for 123 countries worldwide, during the period of 1950 - 2016. The dataset we are ought to use is the Total Economy Database (TED) (2016a) and includes variables for two sources of capital, output growth, labor and human capital. Due to limited data accessibility of ICT capital for developing countries, we end up with a total number of 101 countries. As mentioned in the theoretical part, ICTs have only been considered to affect productivity for several years due to the rapid growth during the 1990’s, after the so-called IT
boom (Venturini, 2006; Edquist & Henrekson, 2004). The great increase in these kinds of
investments during the past three decades, therefore makes up an interesting period for us to investigate. In accordance with Niebel (2014), we start in 1995 but add another twenty years to gather the impact up until recently. Thus, we end up with a total number of 21 years during the period 1995 - 2015. Additional data which is not covered by the TED, is accessed from the World Bank (2017c).
Since previous empirics have found support for the relationship between ICT and GDP, we assume this relationship to flow from ICT investments to output growth (Röller & Wavermann, 2001; Wolde-Rafuel, 2007) and have, just as Niebel (2014), Yosefi (2011) and Hanclova et al. (2015), put ICT as an independent variable explaining GDP. To distinguish for growth in ICT
3 The Conference Board is an independent, non-profit research association working with issues regarding public interest by reporting economical values (2016a).
11
investments, TED is dividing capital into two categories; growth of ICT capital services and non-ICT capital services. ICT capital services are provided by assets as telecommunication materials, computer hardware and software, while the non-ICT capital services are referred to the growth in the services provided by transports, machinery, buildings, construction and other types of non-ICT assets. Hence, the empirical part is based on capital services instead of capital stocks. According to OECD (2001), Inklaar and Timmer (2013) and Niebel (2014), this measure is more appropriate since it reflects upon the assumption that short-lived assets (computers, phones, etc.) are having greater impact in production, as indicated by user cost of capital. ICT as well as non-ICT capital services, are thus calculated as the growth of stocks in single ICT assets weighted by the share in total ICT capital compensation. As theory suggests, we expect both types of capital services to contribute to the growth of GDP. ICT services are however expected to have relatively greater marginal impacts in the lower income groups, due to the law of diminishing returns on investments (Solow, 1956; Romer, 1990; Gottfries, 2013). Since developed countries are assumed to hold better prerequisites, they should in general also be regarded as more efficient users and eager to invest in new technologies. We have therefore reason to believe that the impact of ICT could be high in the high-income group as well (Avgerou, 2003)
We include labor quality as one of the control variables since we assume human capital to influence the level of production (Glaeser et al., 2004). Labor quality consists of three levels of skills; low, medium and high, and is a composition of data sources from different origins4 (The Conference Board, 2016b). Since these sources are set up differently in terms of definitions, time and countries, TED has estimated the relationship between them using a seemingly unrelated regression (SUR) model. The employment data covers all employees, including self-employed, apprentices and the military, engaged in productive activities within the country’s border. The data is gathered from different sources by the Conference Board5. The level of employment and human capital are vital factors for raising output and this study will thus expect positive effects on GDP growth in most of the income groups (Solow, 1956; Romer, 1990; Gottfries, 2013).
4Cohen & Soto (2007), Barro & Lee (2012), EU KLEMS and Wittgenstein Centre for Demography and Global Human Capital
(2015).
12
From World Development Indicators, we add export as a measure for a country’s openness to the rest of the world (World Bank, 2017c). In addition to labor quality, we follow Niebel and assume that the level of trade and export are important factors for GDP growth. Theory suggests that the more globalized a country is, the easier it is to accumulate capital and access new technology through the exchange of knowledge across borders (Romer, 1990; Dollar and Kraay, 2002). The expectations about exports having positive effects on GDP growth are therefore present in our empirical analysis.
4.2 Country Classification
To grasp potential disparities between countries, especially different income levels, we separate them in accordance to their level of development. We classify these as different income groups rather than dividing them into developing-, emerging- and developed economies. We follow the country classification table drawn by the World Economic Situation and Prospects, WESP (United Nations, 2017), where each country is categorized into the low-, lower middle, upper middle or the high-income country group. The classification is dependent on each country’s gross national income (GNI) per capita. Countries having a GNI less than $1.025 per capita are drawn under the category of low-income countries, countries between $1.026 and $4.035 are classified as lower middle income, upper middle income countries between $4.036 and $12.475 and high-income countries for those with more than $12.475 per capita. All countries can be found in table A1.1 in Appendix 1.
4.3 Empirical Model
The empirical model in this study is based on the neoclassical Solow model, presented in the theoretical framework. The analytical framework follows the methodologies outlined by Yousefi (2011) and Niebel (2014) in their studies. We put GDP growth as dependent variable by having capital, labor and technology on the right-hand side of the equation, without the assumption of constant returns to scale. The contribution of capital to GDP is measured by having two capital variables; ICT and non-ICT capital services. In addition, we augment the production function by including two control variables, export and labor quality, since those
13
are considered to affect the level of production as well. We end up with the following augmented production function:
i = country 1, 2, 3… t = period
where
gY
i,t is the annual growth rate of GDP,gK
ICTi,t andgK
NICTi,t are the growth rates of ICTand non-ICT capital services respectively, and
gE
i,t is the growth rate of employment. Finally,X
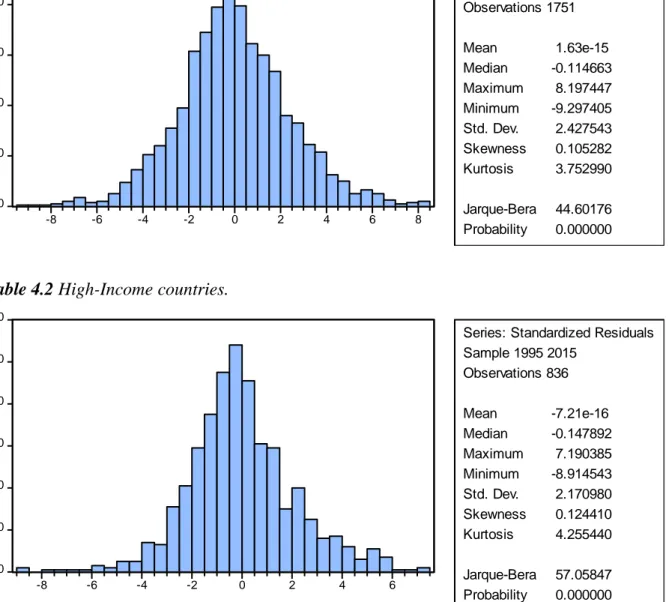
i,t stands for the additional variables for export and growth of labor quality. All variables apart from exports, are presented in annual growth rates as the log change of previous year’s value and are measured in terms of 2015 US Dollars purchasing power parities (PPP).We run panel estimations for the four different country groups by using two types of models; pooled ordinary least square (OLS) and fixed effect models (FEM). We cut of the 5% highest and lowest observations and replace them with the 5th and 95th percentile value, to avoid problems of extreme outliers in the data. The process is called Winsorising and is a more robust method to correct for outliers, in comparison to trimming (IHS EViews, 2010). To avoid problems of non-stationarity, a Fisher Augmented Dickey-Fuller test for panel data analysis is conducted (Appendix 3). The ADF results do not find any problems of non-stationarity in the aggregated sample, nor in the high-income group. Problems of unit roots are solved among the other three groups by differencing the affected time-series. The drawback is that we end up with less number of years. Consequently, for all groups except the most developed we can only estimate the period 1996 - 2015. It should be noted that the Jarque-Bera normality tests indicate non-normal distributions among residuals in the highest income and lower middle income countries, as well as for the total sample (Appendix 4).
The OLS regression is used as a benchmark for the analysis, where the assumption about no individuality among countries is present. They are all having the same intercept and the same slope. The assumption that all countries are holding the same characteristics is somewhat unrealistic (Gujarati & Porter, 2009) and not the purpose of this study. Countries should not
14
hold similar prerequisites for using factors efficiently in production, due to differences in investments behavior (Avgerou, 2003). We will therefore adopt a FE model to control for unobserved heterogeneity across countries, by letting all nations to have individual intercepts and control for time-invariant qualities to not affect GDP growth. The difference between the two models will show if some constant variables omitted from the model, affect the contribution of ICT to GDP growth. Both models are estimated with robust standard errors, using Whites period coefficient covariance estimator to remove potential problems with heteroscedasticity (Eviews, 2016).
4.4 Descriptive Statistics
Below, there are four tables reporting summary statistics for each income group. Every table gives an overview of the statistical nature in each subgroup by presenting the values of the mean, median, maximum, minimum and standard deviation for each variable. The summary statistics for the full sample can be found in table A2.1 in Appendix 2.
As can be seen in table 4.1 - 4.4, the mean value for the annual change in ICT capital investments are presented for each income group. As expected, the highest growth rate is reached within the high-income group. This observation is consistent with previous literature and implies that the richer an economy is, the more it tends to invest in ICT due to the knowledge and experience in how to use and implement these assets (Avgerou, 2003; Beil, Ford & Jackson, 2005; Venturini, 2006). The highest maximum value of 65.2% is presented in the low-income group, indicating that the largest investments are not placed in any of the top-three highest income groups. The change in non-ICT investment is still relatively high in the most developed countries, yet not as large as the investments for ICT in any of the four income groups. This implies that some of the less developed countries have invested heavily in ICTs during the past two decades. This is in accordance with the findings of Niebel (2014) and Dedrick et al. (2013) and might display the realization of the so called leapfrogging effect discussed by Steinmuller (2001).
Another main variable in focus for the empirical part is the annual growth rates for GDP. In accordance with the neoclassical theory, the highest rate is reached in the low-income group followed by the lower middle income group. The same relationship can be noticed for the mean
15
value of employment growth, as the highest value comes from below and ends with the lowest mean in the high-income economies. These recognitions display the observations by Dedrick et al. (2013) and Niebel (2014), about the rise in income among less developed countries during the past two decades. Furthermore, the rise might represent the success from increased investments in ICT and non-ICT capital as well as increased employment rate which should have a plausible effect on output growth (Solow, 1956; Romer, 1990; Gottfries, 2013). Although the highest average values for GDP are reached for the low-income group, the highest minimum values are reached for the upper middle and in the lower middle income group for the employment rate.
For labor quality and exports, higher rates are explored in the high-income group. The unrealistically low median as well as the relatively lower mean value for the upper middle income group, might indicate that there could be some biasedness or measurement errors in the data for export. However, the tables give an overview about the relatively lower rates in the low-income groups in comparison the developed.
Table 4.1 - Descriptive Statistics: High-Income Countries 1995-2015
Source: The Conference Board (2016) and the World Bank (2017)
Table 4.2 - Descriptive Statistics: Upper Middle Income Countries 1995-2015
Source: The Conference Board (2016) and the World Bank (2017)
gGDP gICT gNICT gEmployment gLabor Quality Export % of GDP
Mean 3.012433 15.91900 3.355078 1.274806 0.395945 52.96728 Median 2.857492 14.79699 2.880083 1.345245 0.310951 43.42753 Maximum 8.740070 32.04962 9.094110 5.534577 1.115487 160.3446 Minimum -2.450791 3.823758 0.255046 -1.958880 0.022180 16.92983 Std. Dev. 2.749152 7.525781 2.175520 1.760511 0.285414 34.75061 Observations 836 836 836 836 836 836
gGDP gICT gNICT gEmployment gLabor Quality Export % of GDP
Mean 3.942654 13.19339 -0.027561 1.982523 -0.003785 -0.028340 Median 4.015630 12.16439 0.044870 2.141071 0.003667 0.000000 Maximum 10.53673 35.96643 3.845262 6.108792 0.504177 24.07263 Minimum -4.120802 -4.874120 -7.431728 -2.735221 -0.580911 -21.41074 Std. Dev. 3.499686 9.233922 1.372037 2.164911 0.078683 4.083994 Observations 407 407 407 407 407 407
16
Table 4.4 - Descriptive Statistics: Lower Middle Income Countries 1995-2015
Source: The Conference Board (2016) and the World Bank (2017)
Table 4.3 - Descriptive Statistics: Low-Income Countries 1995-2015
Source: The Conference Board (2016) and the World Bank (2017)
gGDP gICT gNICT gEmployment gLabor Quality Export % of GDP
Mean 4.955204 15.11854 0.048224 2.410774 0.003804 28.66016 Median 5.046018 14.92673 0.050294 2.493957 0.003002 24.86869 Maximum 9.546127 39.52879 5.418834 6.488618 0.370544 62.84007 Minimum -1.679405 -5.457444 -6.152139 -2.880427 -0.404322 11.51269 Std. Dev. 2.252047 10.65957 1.038844 2.041554 0.050776 13.56161 Observations 339 339 339 339 339 339
gGDP gICT gNICT gEmployment gLabor Quality Export % of GDP
Mean 5.256713 -0.414414 0.171651 3.146388 0.005343 20.48802 Median 5.400000 1.166639 0.171829 3.322903 0.003401 20.75642 Maximum 10.55441 65.16451 4.377003 4.794707 0.123903 30.66378 Minimum -0.728816 -53.08947 -8.105458 0.588888 -0.092569 9.830083 Std. Dev. 2.881087 17.43820 1.713302 1.132137 0.021098 5.881081 Observations 125 125 125 125 125 125
17
5. Empirical Analysis
In this section, a presentation and analysis of the main findings from the regressions will be presented. We investigate whether ICT capital investments and their impact on GDP growth differ between countries at four levels of income.
5.1 Results
Table 5.1 examines the results from the regression for the aggregated sample in period 1995 – 2015. The growth in ICT capital services is insignificant for the two models with only a few percentage points (0.012% and 0.014%) differing the output elasticities. For the non-ICT capital services, the elasticities range from 0.479% to 0.437%, indicating a higher importance in relation to ICT. The growth of employment seems to have somewhat higher importance for economic growth when accounting for country-specific effects (0.521%) compared to the OLS (0.458%). When controlling for labor quality and export in the regression, we only find significant results for the labor variable. When we exclude the control variables, we find that ICT capital has a significant effect in both models, as can be seen in table A5.1.
* p < 0.1, **p < 0.05, *** p < 0.01. All standard errors are estimated with Whites period coefficient covariance estimator
Table 5.1 - All countries – Dependent Variable: gGDP - 1995 – 2015
Variables OLS FEM
gICT Capital Serv. 0.011591 0.014488 gNICT Capital Serv. 0.479263*** 0.436616*** gEmployment 0.458463*** 0.521142*** gLabor Quality -0.646490* 1.022370** Export % 0.001090 -0.001133 Constant 1.138814*** 0.683452 Adjusted R2 0.346677 0.443701
18
Since the purpose of this study is to compare the contribution of ICT growth across different countries, the output in table 5.2 presents the results for each subsample for the same period. When including exports and labor quality, the low-income group do not find ICT contributing to GDP growth at all. In this group, we also find the only significant export coefficient. On the other hand, in the FE model for high-income countries the labor quality seems to find its only significant impact on GDP. Although insignificant results, the control variables seem to affect the impact of ICT on GDP positively for the lower middle income group, where the coefficient increase from 0.0405% and 0.014% to 0.044% and 0.027% in OLS and FEM respectively. For the high-income group, the impact from the control variables are mixed, with a slight increase in OLS for ICT and a decrease in FEM. In the other two groups, when including exports and labor quality, we get lower elasticities of ICT capital.
When we exclude labor quality and export, ICT capital is significant in the three highest income groups with an exception for FEM in the lower middle income group. The elasticities reveal somewhat higher values in all subgroups in comparison to the aggregated sample. The magnitude of the non-ICT capital services is considerably higher for all subsamples, in comparison to the ICT services. It is surprising to see is the elasticity in the upper middle income countries is around 1.3. This is a remarkably high value in relation to the other groups. The variable suggests a 1% increase in growth of non-ICT capital services would affect growth of GDP with 1.3%.
19
* p < 0.1 ** p < 0.05 *** p < 0.01
All standard errors are estimated with Whites period coefficient covariance estimator Table 5.2 - Dependent Variable gGDP - 1995 –2015
Group Variables OLS FEM
High-Income gICT Capital Serv. 0.056954*** 0.057382*** gNICT Capital Serv. 0.321397*** 0.219719**
gEmployment 0.588300*** 0.737138***
gLabor Quality 0.044218 0.660441**
Export % 0.001552 -0.017498
Constant 0.177795 1.087396
Adjusted R2 0.372632 0.469352
Upper Middle Income gICT Capital Serv. 0.048142** 0.006591 gNICT Capital Serv 1.242143*** 1.313912***
gEmployment 0.385873*** 0.398522***
gLabor Quality 1.582198 1.183480
Export % 0.002612 0.005554
Constant 2.582792*** 3.106468***
Adjusted R2 0.378176 0.578190
Lower Middle Income gICT Capital Serv. 0.044418** 0.026961 gNICT Capital Serv. 0.574419*** 0.566220***
gEmployment 0.112611 0.198684**
gLabor Quality 1.600055 0.458789
Export % 0.017584 0.012898
Constant 3.474450*** 3.669914***
Adjusted R2 0.135205 0.303499
Low-Income gICT Capital Serv. -0.007542 -0.004736 gNICT Capital Serv. 0.521802** 0.488911**
gEmployment 0.509946** 0.478445*
gLabor Quality 1.327520 -8.755657
Export % -0.110056*** 0.020872
Constant 5.807270*** 3.284623***
20
5.2 Analysis & Discussion
The output from the empirical part presents interesting results. As expected, the result for the full sample in table A5.1 shows a positive relationship between ICT capital services and GDP growth rate, supporting previous work made by both Niebel (2014) and Yousefi (2011). The values of capital services provided by non-ICT assets are considerable higher, implying that classical assets like buildings, cars and machinery should still be more important for the global growth in relation to new technologies within the ICT sector. Increased coefficients are observed when including export and labor quality as control variables. However, there are no longer any evidence for ICT capital services affecting growth. Consistent with Gottfries (2013) and Glaeser et. al (2004), labor quality seems to have an important role for growth in the full sample. Since traditional theory is predicting exports to have a positive effect on growth (Romer, 1990; Dollar and Kraay, 2002), it is surprising to see the opposite in our empirical findings. The insignificant results might however indicate that there could be some measurement errors. Since these results are aggregations of countries with different income levels, we should not assume that these values are true for all countries globally (Avgerou, 2003; Dimelis & Papaioannou, 2009). Again, all economies do not share the same prerequisites for investing and using new technologies, one should therefore not rely on the results based on an aggregated sample of different countries.
The impact of ICT on GDP growth affects the four subgroups in the output differently. Regarding ICT capital services in the high-income group, there are no differences in the significance level between the two models, nor any remarkable changes in the contributions to GDP growth. This could suggest that there are not many unobserved heterogeneity effects, constant over time, that affect the impact on the contribution of ICT to GDP growth rate. The significance levels are in line with both Yousefi and Niebel as well as theory; high-income countries should have a high stock of ICT capital and historical experience in how to efficiently use these assets. When allowing every country to have its own intercept we notice that labor quality becomes significant to GDP growth. This might partially support the statement by Avgerou about context-specific characteristics and that these could affect the educational contribution to GDP. In addition, it is expected that these countries have developed appropriate infrastructures supporting these types of assets. Our results somewhat contradict the statements made by Edquist and Henrekson as well as Venturini, stressing that growth in high income
21
countries are today driven by investments and usage of ICT capital. The contributions of non-ICT related capital shown in our output, seem to still be relatively more important in relation to ICT capital services.
In the upper middle income group, the results show reduced importance of ICT capital services in relation to the high-income group. This is not in favor of previous research and theory studying upper middle economies, which shows that these countries should have higher elasticities of ICT compared to higher income economies (Yousefi, 2011; Hanclova et al., 2015). On the other hand, the results about relatively lower contributions in this income group are in line with the findings of Niebel, if one consider the upper middle income group as ‘emerging’ economies. Interestingly, when including both control variables, the significant contribution of ICT investments to GDP growth in FEM disappears. The result estimated by the fixed effects model now suggests that ICT capital services no longer is contributing to the growth of GDP. Non-ICT capital services however shows increased importance when controlling for omitted variables. Our results also show that labor qualities are insignificant in this group. This could be another explanation why ICTs do not affect GDP growth in these countries. Researchers argue that the labor force in low-income countries do not have the required education, nor skills, to handle these technologies efficiently and are thus not able to benefit from high-tech investments of ICT (North, 1991; Acemoglu, Johnson & Robinson, 2001). This could also be a consequence of low institutional qualities, since King et al. (1994) and Glaeser et al. (2004) state that institutions have a major role in the development of human capital and vice versa. However, these results measure the growth in labor quality and the effects on growth in GDP from one year to another, implying that the change in human capital does not contribute to the change in GDP output. This could mean that the change in labor quality are time-invariant over the years and is therefore not contributing to the change in GDP growth rate.
The contribution of ICT capital services in the lower middle income countries is like the results found in the upper middle income group. When controlling for fixed effects the variable is no longer contributing to growth of GDP. As in the upper middle income economies, a potential reason for this could be the impact of low quality institutions. The results for the non-ICT capital however, show much less importance in explaining the GDP growth in relation previous
22
group. This is not consistent with the theory presented by the neoclassical model about the law of diminishing marginal return on capital, which states that countries with relatively lower stocks of capital should have higher elasticities. On the other hand, the contribution seems to be higher in this group in comparison to the high-income group.
For low-income countries, we do not find any significant contribution from the growth in ICT capital to GDP growth. Here, the growth of non-ICT capital services seems to be of higher importance. This might be explained by the suggestion of Wavermann, Meschi and Fuss (2005) about the fact that lower income countries seem to hold less incentives to invest in infrastructure for new technologies. The explanation to this is that country-specific characteristics and established infrastructure, do not support these kinds of investments. This could imply that lower income countries in general suffer from lower contributions of ICT in relation to other types of capital that meet more primary needs. Wavermann et al. also argue that another explanation for why less developed economies exhibit insignificant contributions from ICT capital could be the consequence of the so-called telecom income trap. This implies that the cost of ICTs exceeds the gains in productivity. The lower levels of income might also affect the support for building efficient infrastructures for telecommunications, as stressed by Röller and Waverman (2001). In comparison to the lower middle income group, the growth in employment seem to be of much higher importance in these types of countries. This could partially be explained by the lower stocks of capital making labor more important in the production. In addition, one might also assume higher unemployment rates in low-income countries, making the growth of employment a much more important variable to GDP growth in relation to previous group.
Overall, the results show that ICT capital still has a more important role among the World’s richest countries. In contrast to Niebel, we do not find any significant impact of ICT in the three lower income groups when accounting for country-specific effects. Interestingly, both middle-income groups exhibit significant impacts of ICT in the OLS model. It can however, be noticed that the fixed effect model fails to support the effects of ICT capital on growth in most countries. One could therefore assume there is some time-invariant heterogeneity aspect that rendering ICT negligible when accounting for it. Many less developed countries are today affected by current or historical consequences of war, famine and poverty and might therefore find it hard
23
to establish stable economies and increased growth. This is in line with the research of North (1991) and Acemoglu et al. (2001), which arguing that historical aspects still influence the configuration of institutions today.
24
6. Conclusion
The purpose of this study was to investigate how growth in ICT investments affect output growth differently at four levels of income and what possibly can affect the levels of contribution. By employing a panel dataset consisting of 101 countries, the investigation covers the effects during 1995-2015, which was a period of increased investments in ICT.
According to the outcome in this paper, it seems like non-ICT related capital services e.g. buildings, classical machinery, transports etc., are more important in explaining the growth of GDP in relation to ICT capital services. In both models for the high-income group, we find significant support that growth in ICT capital services explains the growth of GDP. With support from related literature this might be the consequence of historical economic stability and high experience levels of using technologies prior to ICT, since exports do not have any impact on the economies. Less importance is found in the low-income group where none of the two regressions point at significant contributions of ICT capital services to growth. Low stocks of human capital and exports could play major roles for the unsupportive environment. Previous studies also suggest that lower contributions to growth could be explained by the fact that less developed countries usually are having unstable policies, acting as barriers for the ability to use ICT capital efficiently. The two middle income groups exhibit the same pattern for the two models regarding the growth of ICT capital services. Interestingly, the variable is having a significant impact on output growth when not controlling for country-specifics effects while in the fixed effects models, ICT becomes insignificant. In contrast to the high-income group, this might be explained by relatively lower qualities of institutions as suggested by North (1991). On the other hand, these countries are having higher income levels than the low-income group and might therefore show significant contributions to growth in the OLS model, implying that heterogeneous characteristics e.g. policies supporting ICT investments might be on the rise. This could in time bring the contribution from ICT capital to higher levels like those experienced in high-income countries.
This paper adds contradicting results regarding positive impact on all countries globally and support the fact that there is something apart from labor quality and exports, that affects the contribution of ICT. For future research to investigate the impact on GDP growth, effort should be devoted to examining if institutions are having an impact on the contribution from ICT
25
investment, by including variables explaining the quality of these. The impact on economic growth should also be examined e.g. by studying a more disaggregated dataset. This could be done by dividing the period into smaller segments and use more country groups. One will then be able to see the effects of ICT in a narrower perspective and the changing effects over time.
26
Reference List
Acemoglu, D., Johnson, S., & Robinson, J. (2001). The colonial origins of comparative development: An empirical investigation. American Economic Review, 91(5), 1369-1401.
Avgerou, C. (2003) The link between ICT and economic growth in the discourse of
development. In: Korpela, M., Montealegre, R. & Poulymenakou, A., (eds.) Organizational
Information Systems in the Context of Globalization. Springer, New York, USA, pp. 373-386. ISBN 9781402074882
Beil, R., Ford, G., & Jackson, J. (2005). On the relationship between telecommunications investment and economic growth in the United States. International Economic Journal, 19(1), 3-9. DOI: 10.1080/135116142000320399
Dedrick, J. Kraemer, K. L., & Shih, E. (2011). Information Technology and Productivity in Developed and Developing Countries. Journal of Management Information Systems, 30(1), 97-122.
Dimelis, S. P. & Papaioannou, S. K. (2009). FDI and ICT Effects on Productivity Growth: A Comparative Analysis of Developing and Developed Countries. European Journal of
Development Research, 22(1), 79-96.
Dollar, D. Kraay, A. (2002). Institutions, Trade, and Growth. The World Bank.
Edquist, H., Henrekson, M. (2004). Technological breakthroughs and productivity growth,
SSE/EFI Working Paper Series in Economics and Finance, No. 562
Eviews. (2016). Estimating A Panel Equation.
Retrieved April 24, from http://www.eviews.com/help/helpintro.html#page/content%2Frobust regRobust_Least_Squares.html%23
Falk, M. & Biag, F. (2015). Empirical Studies on the Impacts of ICT Usage in Europe. Institute
for Prospective Technological Studies Digital Economy Working Paper 2015/14.
Glaser, E.L., La porta, R., Lopez-de-Silanes, F., Shleifer, A. (2004). Do Institutions Cause Growth? Journal of Economic Growth 9 (3) (September): 271-303. DOI:10.1023/b:joeg.0000038933.16398.ed
Gottfries, N. (2013). Macroeconomics. Basingstoke: Palgrave Macmillan. GSMA (2016). The mobile economy 2016.
27
Retrieved from: https://www.gsmaintelligence.com/research/?file=97928efe09cdba2864cdc f1ad1a2f58c&download
Gujarati, D., & Porter, D. C. (2009). Basic econometrics (5.th ed.). Boston: McGrawHill Hagsten, E. (2015). Broadband connected employees and labour productivity: A comparative analysis of 14 European countries based on distributed Microdata access. Economics of
Innovation and New Technology, 1-17.
Hanclova, J., Doucek, P., Fischer, J., & Vltavska, K. (2015). Does ICT capital affect economic growth in the EU-15 and EU-12 countries? Journal of Business Economics and Management, 16(2), 387-406. DOI: 10.3846/16111699.2012.754375
IHS Eviews, (2010), TRIM. (EViews). Accessed 2017-04-20.
Information Economy Report 2006. The Development Perspective, (2006). New York:
UNCTAD. Retrived from: http://www.unctad.org/en/docs/sdteecb20061_en.pdf
Inklaar, R. & Timmer, M. P., (2013). Capital, labor and TFP in PWT8.0. Retrived from: http://piketty.pse.ens.fr/files/InklaarTimmer13.pdf
King, J.L., Gurbaxani, V., Kraemer, K.L., McFarlan, F.W., Raman, K.S. & Yap, C.S. (1994). Institutional Factors in Information Technology Innovation. Information System Research 5:2. Niebel, T. (2014). ICT and economic growth: Comparing developing, emerging and developed countries. ZEW Discussion Papers No. 14-117.
North, D. (1991). Institutions. The Journal of Economic Perspectives (1986-1998), 5(1), 97. OECD (2001), Measuring Productivity - OECD Manual: Measurement of Aggregate and
Industry-level Productivity Growth, OECD Publishing, Paris.
DOI: http://dx.doi.org/10.1787/9789264194519-en
OECD (2015), OECD Digital Economy Outlook 2015, OECD Publishing, Paris. DOI: http://dx.doi.org/10.1787/9789264232440-en
OECD (2017), ICT investment (indicator). DOI: 10.1787/b23ec1da-en (Accessed on 12 April 2017)
Romer, P. M. (1990). Endogenous technological change. Journal of Political Economy, 98(5), S71-S102
28
Röller, L., & Waverman, L. (2001). Telecommunications Infrastructure and Economic Development: A Simultaneous Approach. The American Economic Review, 91(4), 909-923. Steinmueller, W. (2001). ICTs and the possibilities for leapfrogging by developing countries.
International Labour Review, 140(2), 193-210.
Stiroh, K. J. (2002). Are ICT Spillovers Driving the New Economy? Review of Income and
Wealth 48(1), pp. 33-57 http://www.roiw.org/2002/33.pdf
Solow, R. (1956). A Contribution to the Theory of Economic Growth. The Quarterly Journal
of Economics, 70(1), 65-94.
The Conference Board. (2017a). The Conference Board Total Economy Database™, Retrieved March 20, 2017 from: http://www.conferenceboard.org/data/ economydatabase/
The Conference Board. (2017b). Total Economy Database – Sources and Methods
Retrieved March 20, 2017 from: https://www.conference-board.org/retrievefile.cfm?filename =TED_SourcesMethods_nov20161.pdf&type=subsite
United Nations (2017). World Economic Situation Prospects. Retrieved April 18, 2017 from https://www.un.org/development/desa/dpad/wpcontent/uploads/sites/45/publication/2017wesp _full_en.pdf
Venturini, F. (2006). ICT and Productivity Resurgence: A growth model for the Information Age. IDEAS Working Paper Series from RePEc.
Waverman, L., Meschi, M. & Fuss, M. (2005). The Impact of Telecoms on Economic Growth
in Developing Countries. Retrieved May 6, 2017 from http://www.assignmentpoint.com /wpcontent/uploads/2012/04/L_Waverman_Telecoms_Growth_in_Dev_Countries.pdf
Wolde-Rufael, Y. (2007). Another look at the Relationship between Telecommunications Investment and Economic Activity in the United States. International Economic Journal, 21(2), 199-205.
World Bank (2017a). Information and Communication Technologies. Retrieved April 12, 2017 from http://www.worldbank.org/en/topic/ict/overview
World Bank (2017b). Individuals using internet (% of population. Retrieved May 11, 2017 from
http://data.worldbank.org/indicator/IT.NET.USER.ZS
World Bank (2017c). Exports of goods and services (% of GDP). Retrieved April 23, 2017 from http://data.worldbank.org/indicator/NE.EXP.GNFS.ZS
29
Yousefi, A. (2011) The impact of information and communication technology on economic growth: evidence from developed and developing countries, Economics of Innovation and New
30
Appendix 1 – List of Countries
Table A1.1 – List of Countries
Source: United Nation (2017)
Australia New Zealand Algeria Armenia Burkina Faso Austria Norway Angola Bangladesh Ethiopia Bahrain Oman Argentina Bolivia Madagascar
Belgium Poland Belarus Cambodia Malawi
Canada Portugal Brazil Cameroon Mali
Chile Qatar Bulgaria Egypt Niger
Cyprus Saudi Arabia China Guatemala Tanzania Czech Republic Singapore Colombia India
Denmark Slovak Republic Costa Rica Indonesia Estonia Slovenia Dominican Republic Kenya Finland South Korea Ecuador Morocco
France Spain Georgia Pakistan
Germany Sweden Iran Philippines Greece Switzerland Jamaica Sri Lanka Hong Kong Taiwan Jordan Sudan Hungrary Trinidad Tobago Malaysia Syria Ireland United Kingdom Mexico Tajikistan Israel United States Peru Tunisia
Italy Uruguay Romania Ukraine
Japan Russian Federation Uzbekistan Kuwait Serbia & Montenegro Vietnam
Latvia South Africa Yemen
Lithuania Thailand Zambia
Luxembourg Turkey
Malta Turkmenistan
Netherlands Venezuela
31
Appendix 2 – Descriptive Statistics
Table A2.1 Descriptive Statistics: All countries - 1995 – 2015
Source: The Conference Board (2016) and the World Bank (2017)
Appendix 3 – Augmented Dickey-Fuller unit root tests
Results for the Augmented Dicky-Fuller unit root tests.H0: There is unit root (non-stationarity)
Table A3.1 ADF Unit Root test: All countries
Table A3.2 ADF Unit Root test: High-Income Countries
gGDP gICT gnICT gEmpl gLQ Export %
Stat. 551.545 448.945 291.451 707.906 208.836 263.663 Prob. 0.0000 0.0000 0.0000 0.0000 0.0367 0.0002 Stat. -12.5979 -8.89219 -3.87246 -15.6283 -0.09509 -2.53528 Prob. 0.0000 0.0000 0.0001 0.0000 0.4621 0.0056
ADF - Fisher Chi-sq.
ADF - Choi Z-stat
gGDP gICT gNICT gEmpl gLQ Export %
Stat. 266.633 240.770 173.518 272.433 135.331 110.443
Prob. 0.0000 0.0000 0.0000 0.0000 0.0002 0.0282
Stat. -9.61196 -7.39645 -4.78965 -9.73005 -3.40136 -1.64727
Prob. 0.0000 0.0000 0.0000 0.0000 0.0003 0.0498
ADF - Fisher Chi-sq. ADF - Choi Z-stat
gGDP gICT gNICT gEmployment gLabor Quality Export % of GDP
Mean 3.814260 15.34089 3.848440 1.795926 0.329436 39.27439 Median 3.815707 14.35705 3.508448 1.799598 0.298725 32.21320 Maximum 9.848467 36.83021 9.966584 5.821805 0.827041 96.64283 Minimum -2.714485 -1.684516 -0.484032 -2.352787 0.004595 12.79590 Std. Dev. 3.007628 9.436000 2.584943 1.973105 0.222375 22.50627 Observations 1751 1751 1751 1751 1751 1751
32
Table A3.3 ADF Unit Root test: Upper Middle Income Countries
Table A3.4 ADF Unit Root test: Lower Middle Income Countries
Table A3.5 ADF Unit Root test: Low-Income Countries
gGDP gICT gNICT gEmpl gLQ Export %
Stat. 125.228 123.970 50.1017 231.648 22.4037 54.8466 Prob. 0.0000 0.0000 0.5489 0.0000 0.9943 0.2310 Stat. -5.35900 -5.09437 -0.10529 -10.4292 2.11633 -0.67519 Prob. 0.0000 0.0000 0.4581 0.0000 0.9828 0.2498
ADF - Fisher Chi-sq.
ADF - Choi Z-stat
gGDP gICT gNICT gEmpl gLQ Export %
Stat. 102.620 64.8666 47.2447 188.696 23.6132 65.6534 Prob. 0.0000 0.0347 0.4215 0.0000 0.9442 0.0300 Stat. -4.31373 -2.32728 -0.01291 -7.94839 1.89526 -0.62916 Prob. 0.0000 0.0100 0.4948 0.0000 0.9710 0.2646
ADF - Fisher Chi-sq.
ADF - Choi Z-stat
gGDP gICT gNICT gEmpl gLQ Export %
Stat. 64.6905 21.8151 20.7948 39.6908 3.04607 24.4221 Prob. 0.0000 0.0825 0.1070 0.0003 0.9990 0.0407 Stat. -5.86386 -1.24403 -1.13450 -3.45277 2.46762 -1.51607 Prob. 0.0000 0.1067 0.1283 0.0003 0.9932 0.0648
ADF - Fisher Chi-sq.
33
Table A3.6 ADF Unit Root test after differencing: Upper Middle Income Countries
Table A3.7 ADF Unit Root test after differencing: Lower Middle Income Countries
Table A3.8 ADF Unit Root test after differencing: Low-Income Countries
gGDP gICT gNICT gEmpl gLQ Export %
Stat. 125.228 123.970 155.152 231.648 181.318 204.198 Prob. 0.0000 0.0000 0.0000 0.0000 0.0000 0.0000 Stat. -5.35900 -5.09437 -8.09301 -10.4292 -10.1463 -10.3126 Prob. 0.0000 0.0000 0.0000 0.0000 0.0000 0.0000
ADF - Choi Z-stat ADF - Fisher Chi-sq.
gGDP gICT gNICT gEmpl gLQ Export %
Stat. 102.620 64.8666 191.570 188.696 149.893 65.6534 Prob. 0.0000 0.0347 0.0000 0.0000 0.0000 0.0300 Stat. -4.31373 -2.32728 -9.71971 -7.94839 -8.77278 -0.62916 Prob. 0.0000 0.0100 0.0000 0.0000 0.0000 0.2646
ADF - Choi Z-stat ADF - Fisher Chi-sq.
gGDP gICT gNICT gEmpl gLQ Export %
Stat. 64.6905 61.0251 53.6703 39.6908 59.1908 24.4221 Prob. 0.0000 0.0000 0.0000 0.0003 0.0000 0.0407 Stat. -5.86386 -5.82998 -4.19703 -3.45277 -5.76712 -1.51607 Prob. 0.0000 0.0000 0.0000 0.0003 0.0000 0.0648
ADF - Choi Z-stat ADF - Fisher Chi-sq.
34
Appendix 4 – Jarque-Bera Normality Test
H0: Residuals are normally distributed
Table 4.1 Full Sample (All Countries).
Table 4.2 High-Income countries.
0 40 80 120 160 200 -8 -6 -4 -2 0 2 4 6 8
Series: Standardized Residuals Sample 1995 2015 Observations 1751 Mean 1.63e-15 Median -0.114663 Maximum 8.197447 Minimum -9.297405 Std. Dev. 2.427543 Skewness 0.105282 Kurtosis 3.752990 Jarque-Bera 44.60176 Probability 0.000000 0 20 40 60 80 100 120 -8 -6 -4 -2 0 2 4 6
Series: Standardized Residuals Sample 1995 2015 Observations 836 Mean -7.21e-16 Median -0.147892 Maximum 7.190385 Minimum -8.914543 Std. Dev. 2.170980 Skewness 0.124410 Kurtosis 4.255440 Jarque-Bera 57.05847 Probability 0.000000
35
Table 4.3 Upper Middle Income countries.
Table 4.4 Lower Middle Income countries.
0 10 20 30 40 50 -8 -6 -4 -2 0 2 4 6 8
Series: Standardized Residuals Sample 1996 2015 Observations 407 Mean -1.55e-16 Median -0.197263 Maximum 7.886866 Minimum -9.161331 Std. Dev. 2.742660 Skewness 0.191476 Kurtosis 3.429461 Jarque-Bera 5.614721 Probability 0.060364 0 10 20 30 40 50 -7 -6 -5 -4 -3 -2 -1 0 1 2 3 4 5
Series: Standardized Residuals Sample 1996 2015 Observations 339 Mean 4.01e-16 Median 0.068702 Maximum 4.834012 Minimum -6.835651 Std. Dev. 2.078729 Skewness -0.273412 Kurtosis 3.598619 Jarque-Bera 9.285233 Probability 0.009632
36
Table 4.5 Low-Income countries.
0 4 8 12 16 20 -6 -4 -2 0 2 4 6
Series: Standardized Residuals Sample 1996 2015 Observations 125 Mean 8.10e-16 Median 0.184576 Maximum 6.627490 Minimum -6.752510 Std. Dev. 2.615227 Skewness -0.203277 Kurtosis 3.076730 Jarque-Bera 0.891530 Probability 0.640334
37
Appendix 5 – Regression Output
Table A5.1. Dependent Variable: gGDP - 1995 – 2015
* p < 0.1, **p < 0.05, *** p < 0.01. All standard errors are estimated with Whites period coefficient covariance estimator
Variables
OLS
FEM
gICT Capital Serv 0.020813** 0.022027**
gNICT Capital Serv 0.413037*** 0.408713***
gEmployment 0.393381*** 0.501715***
Constant 1.329270*** 1.133286***