Mimicking the insider
A study in the Swedish bank sector
Master Thesis Finance
Author: Andreas Lindqvist
Tutors: Per-Olof Bjuggren
Louise Nordström
i
Master Thesis within Business Administration
Title: Mimicking the insider
Author: Andreas Lindqvist
Tutors: Per-Olof Bjuggren and Louise Nordström
Date: May 2012
Key Words: Insider, Outsider, Insider trading, Mimic, Bank, Efficient Market Hypothesis, Abnormal Return
Abstract
Background: Achieving an abnormal return on your investment is something investors
are trying to achieve. A lot of attempts have been made to try and find an investment strategy that always generates abnormal returns, although none has been proven to be absolute. Efficient Market Hypothesis (EMH) proponents argue that when it comes to public available information, one could not get an abnormal advantage of this informa-tion. Behavioural Finance (BF) proponents however argue that there may still be possi-ble for this due to human psychology. For markets to have the best possibilities for be-ing efficient, it must be a large and competitive market where information transfers rap-idly. When analysing aspects necessary for earning abnormal return for outsiders, there are indications that these aspects does exist and it might be profitable to mimic the in-siders operating in the Swedish large-cap bank sector. The large-cap bank sector con-tains of Svenska Handelsbanken (SHB), Nordea, Swedbank and Skandinaviska Enskil-da Banken (SEB).
Purpose: The purpose of this thesis is to explore whether there exist an opportunity in
the Swedish bank sector for outsiders to earn abnormal return based on insiders’ trans-actions. In the process an indirect test will be made to see if the semi-strong form of ef-ficiency holds for the Swedish bank sector.
Method: Observing the movements on the market when the information about insider
trading becomes public. The results are tested for both statistical significance and eco-nomical significance.
Conclusion: The purpose of this study was to try and determine whether or not
outsid-ers could mimic the insider’s transactions in order to earn abnormal return in the Swed-ish bank sector. However, based on this study this seems not to be possible in the over-all sector. The signs that indicated that this would be possible for the Swedish large-cap banks turned out to be false. The result that showed statistical difference from zero was negative and it was therefore concluded that the insider did not predict the future very well. This leads to the conclusion that there are stronger factors than the sign of insid-ers’ transactions determine the future stock price. Since the insiders could not predict the future stock prices, any attempt from outsiders to try to exploit their information would not be beneficial. This resulted in the BF assumptions of under- and overreaction in the price did not occur in this study and instead the results turned out to be in line with the EMH description of semi-strong markets.
ii
Magisteruppsats inom Företagsekonomi
Titel: Imitera insynspersonen
Författare: Andreas Lindqvist
Handledare: Per-Olof Bjuggren och Louise Nordström
Datum: Maj 2012
Nyckelord: Insynsperson, Utomstående, Insynshandel, Imitera, Bank, Effek-tiva Marknads Hypotesen, Överavkastning
Abstrakt
Bakgrund: Att uppnå överavkastning på sin investering är något investerare ständigt
försöker uppnå. Många försök har gjorts för att försöka hitta en investeringsstrategi som alltid genererar överavkastningen, dock har inga gjorts som visat sig vara kontinuerliga. Den Effektiva Marknads Hypotesens förespråkare hävdar att när det gäller offentligt tillgänglig information kan man inte få onormal fördel av detta. Dock hävdar föresprå-kare för Behavioural Finance att detta fortfarande kan vara möjligt och att detta beror delvis på mänsklig psykologi. För att marknader ska ha de bästa möjligheterna för att vara effektiv, måste de vara stora och konkurrenskraftiga där information överförs snabbt. När man analyserar vissa aspekter som är nödvändiga för att tjäna överavkast-ningen för utomstående, verkar det finnas tecken på att detta skulle kunna vara möjligt genom att imitera insynshandel i den Svenska large-cap banksektorn. Sektorn består av Handelsbanken (SHB), Nordea, Swedbank och Skandinaviska Enskilda Banken (SEB).
Syfte: Är att undersöka om det finns en möjlighet för utomstående att få
överavkast-ningen baserad på insynspersonernas transaktioner. I processen görs ett indirekt test för att se om den Svenska banksektorn uppnår semi-stark effektivitet.
Metod: Observera rörelserna på marknaden när information om insynshandel blev
all-mänt. Resultatet testas för både statistisk och ekonomisk signifikans.
Slutsats: Syftet med denna studie var att försöka avgöra huruvida icke-insynspersoner
kunde imitera insynspersonernas transaktioner för att tjäna onormal avkastning i den Svenska banksektorn. Baserat på denna studie verkar detta inte vara möjligt i den totala sektorn. De tecken som indikerade att detta skulle vara möjligt för visade sig vara falskt. Resultatet som visade statistisk skillnad från noll var negativt och därför drogs slutsat-sen att insynspersonerna inte kunde förutsäga framtiden särskilt väl. Detta leder till slut-satsen att det finns starkare faktorer än insynspersoners transaktioner som avgör framti-da aktiekurser. Eftersom insynspersoner inte kunde förutse de framtiframti-da aktiekurserna, skulle varje försök från en utomstående att försöka utnyttja detta inte vara fördelaktigt. Detta resulterade i fenomenet av under- och överreaktioner som BF förespråkade, inte förekom i denna studie. Istället visade resultatet sig vara i linje med EMH beskrivning-en av semi-starka marknader.
iii
Disposition
Chapter 6 - Conclusion
In the last chapter a reflection of the analysis regarding what information this study has presented will be given. Here will also be a statement whether the bank sector coincides with the EMH or not. Finally there will be suggestions for
further research based on the findings of this study.
Chapter 5 - Analysis
Here the analysis of the results from the empirical findings will be compared to earlier findings. Further the finacial theories presented in chapter three will be applied in order to describe the observations.
Chapter 4 - Empirical Findings
In this chapter the empirical results of both the bank sector as a whole and each individual bank will be presented by several tables. Both buy and sell transactions are observed and these are based on selfcreated databases. Both statistical
and economical significance will be tested.
Chapter 3 - Theoretical Framework
Here will the criterias for abnormal return be described. After that two theories regarding the state of the market will be presented. Those are EMH and BF, and they describe if and/or why abnormal return could appear in a market.
Chapter 2 - Methodology
In the second chapter a explanation of the the use of an Event study will be given. The chapter also provides which data that will be used and the description and motivation of the use of the concept CAAR. Last there will be a list of
common mistakes one must be careful about when conducting empirical research.
Chapter 1 - Introduction
The thesis will begin by giving an introduction to the concept of abnormal return and the indications that shows that this might be possible in the Swedish bank sector by following insider trading. It furthers analyses earlier research regarding mimicking insider trading and illustrates how this study differes from theirs. Also a clear purpose will be
iv
Table of Contents
Disposition………...iii
1
Introduction ... 1
1.1 Background ... 2
1.2 Insider Trading Law ... 3
1.3 Earlier studies ... 5 1.4 Problem discussion ... 7 1.5 Purpose ... 8 1.6 Method ... 8
2
Methodology ... 9
2.1 Method approach ... 9 2.2 Research approach ... 9 2.3 Event study ... 10 2.3.1 Estimation window ... 11 2.4 Abnormal return ... 112.5 Cumulative Average Abnormal Return ... 13
2.6 Hypotheses ... 13
2.7 T-test ... 14
2.8 Wilcoxon signed rank test ... 14
2.9 Chi-square test for normal distribution ... 15
2.10 Validity ... 16
2.10.1 Primary and secondary data ... 16
2.10.2 Data collection ... 16
2.10.3 Common mistakes ... 17
3
Theoretical framework ... 19
3.1 Exploiting insider trading ... 19
3.2 Efficient Market Hypothesis ... 19
3.3 Behavioural Finance ... 21
3.3.1 Limits to Arbitrage ... 22
3.3.2 Investor Sentiment ... 22
4
Empirical Findings ... 25
4.1 Market movements ... 25
4.2 The event day in each bank ... 26
4.3 CAAR 30 days after ... 28
4.4 CAAR 60 days after ... 29
4.5 CAAR 120 days after ... 29
4.6 Event studies overview ... 30
4.7 Economic significance ... 31
5
Analysis ... 33
5.1 Explaining the scenario ... 33
5.2 Economic significance ... 36
6
Conclusion ... 37
6.1 Further research ... 38
v
Appendix
Appendix 1 - CAAR around the event day, buy ... 42
Appendix 2 - CAAR around the event day, sell ... 44
Appendix 3 - Wilcoxon signed rank test ... 47
Appendix 4 – Chi Square test for normal distribution, Buy ... 49
Appendix 5 – Chi Square test for normal distribution, Sell... 56
Equation
Equation 1, Logarithmic daily return ... 11Equation 2, Market model (simplified) ... 12
Equation 3, Market model ... 12
Equation 4, Expected return ... 12
Equation 5, Abnormal return ... 12
Equation 6, Cumulative abnormal return ... 13
Equation 7, Cumulative average abnormal return ... 13
Equation 8, T-test ... 14
Equation 9, Wilcoxon Z-test ... 15
Equation 10, Wilcoxon Z-test expected value ... 15
Equation 11, Wilcoxon Z-test standard deviation ... 15
Equation 12, Chi-square test ... 15
Figure
Figure 1-1, Swedish GDP and banks total turnover ... 3Figure 2-1, Research process, (Creswell, 2003) ... 9
Figure 3-1, Semi-strong form ... 21
Figure 3-2, Over and underreaction ... 23
Figure 5-1, CAAR around event day, buy ... 33
Figure 5-2, Market movements if insider do not trade on special information. ... 34
Figure 5-3, CAAR around event day, sell ... 35
Table
Table 1-1, Times being flagged by FI (position) ... 2Table 1-2, Definition of active and non-active insiders (Taken from FI) ... 4
Table 1-3, Overview of earlier findings ... 7
Table 2-1, Type I and Type II error ... 14
Table 2-2, Wilcoxon signed rank test ... 15
Table 2-3, Observations ... 17
Table 2-4, Unique events ... 17
Table 4-1, Critical values T-test ... 25
Table 4-2, Market movements, buy ... 26
Table 4-3, Market movements, sell ... 26
Table 4-4, CAAR buy day 0 ... 27
Table 4-5, CAAR sell, day 0 ... 27
Table 4-6, CAAR buy, day 30 ... 28
Table 4-7, CAAR sell, day 30 ... 28
vi
Table 4-9, CAAR sell, day 60 ... 29
Table 4-10, CAAR buy, day 120 ... 30
Table 4-11, CAAR sell, day 120 ... 30
Table 4-12, Overview Hypothesis, buy ... 31
1
1
Introduction
Here an introduction of the possibilities of abnormal return will be presented. There will also be a motivation why the four big banks in Sweden are interesting to investi-gate. Then results of previous research will be presented, in order to give the reader a broader view of what to expect from the result of this study.
Achieving an abnormal return on your investment is something investors are trying to achieve. The definition of abnormal return is “A rate of return for taking a particular
risk is greater than that required by the market” (Law, 2008). A lot of attempts have
been made to try and find an investment strategy that always generates abnormal return, although none has been proven to be absolute.
This is according to Fama (1970) what to be expected, since markets are considered to be efficient1. He stated that in most markets there is no possibility to earn abnormal profit on public available information, but he admitted that trading on non public avail-able information could be used to get an advantage. This also coincides with later re-search2 which concludes that insiders do earn abnormal profit on their trades.
For markets to have the best possibilities for being efficient, it must be a large and com-petitive market where information transmitted rapidly (Elton, Gruber, Brown and Goetzmann, 2011). That the American market is large, where Fama did his studies, is unquestionable. Whether or not the Swedish market is large enough to be considered ef-ficient has not been proven. When it comes to the competiveness factor, there is a branch in the Swedish market that cannot be seen as complete competitive. This branch is the large-cap banks.
The large-cap banks in Sweden are few and they have all been caught for delaying their insiders’ transactions, which is a clear sign for illegal insider trading according to Sey-hun (2000). When analysing the aspects3 necessary for earning abnormal return for out-siders, there are indications that it might be possible to mimic the insiders in the Swed-ish large-cap bank sector to earn abnormal return.
1 See chapter 3.2 2 See chapter 1.3 3 See chapter 3.1
2
1.1
Background
In order to try to prohibit insiders from trading on non public information on the Swed-ish market, several laws have been constructed4. In Sweden it is the government elected Financial Supervisory Authority5 (FI) who has the responsibility to overview the mar-ket. Their purposes according to themselves are:
Monitors and analyses trends in the financial market. We assess the financial health of individual companies, the various sectors and the financial market as a whole.
We examine the risks and control systems in financial companies and supervise com-pliance with statutes, ordinances and other regulations. We also supervise comcom-pliance
with the Swedish Insider Act, investigate cases of suspected offences and share price manipulations (FI, 2011).
The authority is the Swedish version of the U.S. Securities and Exchange Commission (SEC).
According to the Swedish law, every person who is considered to be an insider person must register their transactions on the market to the FI. This must be done within five days from the day of the transaction. All these transactions are then summoned into an insider trading database on FI’s webpage, which is open to the public. If they find any companies that do not follow these rules, they will issue a flag to the company, which then must pay a fee.
In Sweden there are four banks which are considered to be large-cap (Swedish Bankers Association, 2011). Those are Svenska Handelsbanken (SHB), Nordea, Swedbank and Skandinaviska Enskilda Banken (SEB). When analyzing the companies that are among the top ten companies to be flagged in 2010 all the four big banks were included (Table 1-1).
Table 1-1, Times being flagged by FI (position)
2010 2009 2008
SHB 15 (8) 3 6
Swedbank 30 (5) 62 46
Nordea 15 (8) 20 27
SEB 44 (2) 30 21
This is according to Seyhun (2000) an indication that the insiders are trading on insider information. He claims that when insiders do trade on special information and want to avoid regulatory attention, they will delay their reporting as much as possible. They would even choose to report later than required by law because they calculate that the information is worth more than the potential fee sentenced by the regulatory force.
4 See Chapter 1.2
3
In order to see the banks’ control in the Swedish market we can note that in 2010 the Swedish GDP was 3 308 billion SEK (SCB, 2011). In the same year SHB, Nordea, Swedbank and SEB showed a total balance of 2 153, 1 715, 2 179 and 5 207 billion SEK respectively6 (Figure 1-1). This indicates that these banks are too big to fail. If any of the banks would go into bank-ruptcy, the economic backswing in Sweden would be devastating and which would take years to recover from. As long as the four big banks control their dominance in the bank market, the situation is likely to remain the same. The sector cannot be seen as purely competitive since there are too few players competing at the top level.
Therefore an investor has the information that the banks will not default. This minimizes some risk and according to Seyhun7 (2000), minimizing risk is one of the key factors in order to exploit insider information. Further the investor knows that the insiders in these banks delay their transactions information and slows down the speed of information, which weakens that aspect, which is assumed to hold in order for the theory of efficient markets to work efficiently. It would therefore be interesting to explore if these indications can result in achieving abnormal returns for outsiders. In order for outsiders to benefit from the insiders’ trading, the insider must be trading on special information. The Swedish government, like many other governments, however try to make the insiders transactions as transparent as possible by applying laws concerning insider trading.
1.2
Insider Trading Law
The law against insider trading was introduced in 1985 and has since then been rein-forced in 1991, 2000 and 2005. The law is called “Market Abuse Penal Act” (2005:377) and states that it is illegal to trade on information which is not public. Further it prohib-its disclosing inside information which would otherwise influence the price of the fi-nancial instrument. In other words it states that you are not allowed to influence the share prices in an improper way. An additional act called “Act concerning Reporting Obligations for Certain Holdings of Financial Instruments” (2000:1087) states that peo-ple who are to be considered insider persons must report their actions on the market to the FI. In Sweden there are different types of insider persons. Each of which must report their actions on the market within five days from the occurrence of the transaction.
6 Numbers are taken from each bank annual reports. 7 See chapter 3.1
Figure 1-1, Swedish GDP and banks total turnover
0 1000 2000 3000 4000 5000 6000 Sw ed en SHB N o rd ea Sw ed b an k SE B GDP 2010 Total balance 2010
4
Active insiders are those who inherit a position where they will get exclusive informa-tion first handed. Then there are those who are to be considered non-active insiders. These are the ones who have the opportunity to possess the exclusive information from the active insiders before any other. These can be seen in Table 1-2 and this study will regard both kinds of insiders equal.
Table 1-2, Definition of active and non-active insiders (Taken from FI)
Active Insiders Non-active Insiders
- A board member of the company or in the parent company,
- A managing director or deputy manag-ing director of the company or its par-ent company,
- An auditor or deputy auditor of the company or its parent company,
- A partner in a partnership that is the company's parent company,
- A holder of another senior executive post or qualified function of a perma-nent nature at the company or its par-ent company,
- If the post or function can normally be considered to have access to non-public information,
- A holder of a senior executive post or a service provider if they may normal-ly be considered to have access to non-public information,
- Larger shareholders who own at least ten percent of the share capital or number of votes for all shares in the company.
- The spouse of the person with an in-sider position,
- Children who are in the custody of the person with an insider position,
- Other closely related parties for ex-ample if they have shared a household with the person who has an insider position for at least one year,
- A legal person whose activities are significantly influenced by the person with an insider position or total share of votes of ten per cent or more.
The purpose of regulating insider trading has been criticised. Anthony Evans (2009), who is a columnist for The Guardian, says that all markets would be better off by lega-lizing illegal insider trading. He argues that by eliminating the boundary between what information you can use and cannot use, then trading on what was before regarded as il-legal insider trading would then be reflected in the stock-price. Bourdreaux (2003) ar-gues that the idea of regulating insiders does not protect any part and that it keeps in-formation from being able to flow free. His argument is that by abandoning the regula-tions only the experts will remain on the market and thereby making the market effi-cient. Those people who think the regulations are good for eliminating unfairness in the market, he responds;
5
If I embark upon an occupation that I know nothing about — say, running a restaurant — I am likely to suffer substantial losses. These losses would
re-sult from the competition of other restaurants run by people who possess more knowledge about the restaurant business than I do. No one thinks that
the industry-specific knowledge possessed by experienced restaurateurs gives them any advantage that is unfair.
-Bourdreaux, 2003
Even though there are those who oppose the insider trading laws, the laws are still ac-tive. However, when analyzing previous research, these laws do not seem to prohibit in-sider trading as they were designed to do.
1.3
Earlier studies
Since the theory of efficient markets8 was developed by Fama (1970), several studies have been performed in order to test it. Fama claimed that markets which are “large” are efficient up to at least the semi-strong level. When analysing the effects of outsiders mimicking insider trading, we are in fact testing the semi-strong efficiency. In order for the outsider to earn from the insiders action, the insider must also make money resulting in that the insiders must have new information. One of the first to test this was Jaffe (1974), who investigated the New York Stock Exchange market and revealed that insid-ers do possess special information. He also found that for outsidinsid-ers this information vanished when the transaction cost was taken into account, except for one strategy. The findings suggested that to make abnormal profit as an outsider, one must invest only in intensive trading companies and then hold the stocks for eight months. He further ac-knowledged that the size of the insider transaction did not affect the value of the infor-mation contained in the insider transaction.
Other studies have shown similar results, such as Seyhun's study from 1986. He studied 60 000 observation of insider transactions from 1975 to 1981 with data taken from SECs Official Summary. He concluded that insiders can gain from their information and that they also can determine the value of the information they have. From an outsider point of view he found that it was not profitable to mimic the insiders’ transactions. This because, during this period it took two months for the public to receive the infor-mation that an insider trade had taken place, which by the time it became public was worthless. Firth, Leung and Rui (2011) also found indications that insiders have special information, but that it is difficult to gain from it as an outsider. They tested whether the Hong Kong market was affected by insider trading. When they analysed the insider’s transactions between 1993 and 1999, they discovered that insiders do earn excessive profits on both buy and sell transactions. They even revealed that sell transactions con-tain more information than buy transactions, which is contrary to Bettis, Vickrey and
6
Vickrey (1997) findings (see below). When trying to mimic the insiders’ action, Firth et al. found that there were little, to no gain from such a strategy. In Europe, Del Brio, Mi-guela and Perote (2002) discovered that also the Spanish market, based on data between 1992 and 1996, gave indication that insiders’ special information could not be used by outsiders as an investment strategy.
From these studies there seems to be no opportunity of getting abnormal return as an outsider, indicating that markets are indeed efficient in the semi-strong form. There have, however, been studies which have showed that outsiders are able to earn abnormal return by following insiders. Bettis, Vickrey and Vickrey (1997) did their test by ob-serving insider trades during 1985 to 1990 on the New York Stock Exchange. They found that outsiders can indeed make abnormal return by following insider transactions. Their result showed however that only buy transaction gave abnormal returns while sell transactions did not generate abnormal returns. Further they realized that the reporting delay had a huge impact on the return. In other words, the sooner the market gets the in-formation about an insider transaction has taken place, the more valuable is that infor-mation to outsiders. Zingg, Lang and Wyttenbach (2007) found that there are possibili-ties for outsiders to earn abnormal return by mimic insiders’ transactions. However they only found this to be true for the buy transactions. They observed transaction on the Swiss market between 2005 and 2006. Across the Atlantic, Lakonishok and Lee (2001) did a study on the US market and discovered that the market does not react when insider trading occurred. They further found that only buy purchases prove to contain valuable information. Even though they found a profit opportunity for outsiders, they claimed that creating a good investment strategy is not straightforward. This is because insider trading in high liquidated stocks contains less information while investing in small liq-uid stocks is more costly.
Cheuk, Fan and So (2006) tested the Hong Kong market between 1993 and 1998, and they found that insiders earn abnormal profit from both buy and sell transactions. In contrary to Firth et al (2011) findings they claimed that as an outsider there was a prof-itable strategy for sell transactions. The abnormal profits from buy transactions were too small to be profitable.
Eckbo and Smith (1998) did their study on the Norwegian market, which have similar trading laws and market size as the Swedish market. They found that on the Oslo Stock Exchange, based on data from 1985 to 1992, there could not be proven that there were any signs of abnormal gain by the insiders trading, which concluded that the Norwegian market was in a strong form state. Therefore there were also no gains for the outsiders to profit by mimicking the insiders. They however do not discuss why the Norwegian laws concerning insider trading are more effective than in other countries.
A summary is presented in Table 1-3. When observing it there seems to be a clear pat-tern that insiders do trade on special information, but whether an outsider would be able
7
to profit from this seems inconclusive. Overall it appears that buy transactions contain more information than insiders’ sell transactions.
Study Country Data Insiders earn
abnormal return
Outsiders mimicking insiders earn abnormal return.
Jaffe (1974) USA Monthly Yes No
Seyhun (1986) USA Daily Yes No
Bettis et al (1997)
USA Daily Yes Yes
Eckbo and Smith (1998)
Norway Daily No No
Lakonishok and Lee (2001)
USA Monthly Yes, for buy
transactions
Yes, for buy transac-tions
Del Brio et al (2002)
Spanish Daily Yes No
Cheuk et al (2006)
Hong Kong Daily Yes Yes, for sell
transac-tion
Zingg et al (2007)
Switzerland Daily Yes, for buy transactions
Yes, for buy transac-tions
Firth et al (2011)
Hong Kong Daily Yes No
1.4
Problem discussion
Based on the previous studies in chapter 1.3, the insiders are trading on special informa-tion. This give indications that an insider can, and do, trade on non public information in Sweden as well. However the results from whether or not outsiders can benefit from this are mixed. Fama (1998) argued that, if there exists an abnormal return opportunity it must exist in all of the economical states and not only during a specific bad time or specific good time. This means that the opportunity must exist during both recessions and booms. In general large-cap companies are better equipped to deal with recessions than small-cap companies (Bodie, Kane and Marcus, 2009). Therefore if abnormal profit would be available while minimizing risk, it should be found within large cap stocks.
In Sweden there exists an indication that the four big bank insiders are trading on in-sider information. This is a requirement in order for the outin-siders to be able to profit from mimicking insider trading. Because of stricter insider trading laws the reporting delay for insiders transactions has shrunk compared to earlier years and has created a more transparent flow of information. However, the banks’ insiders seem to slow down
8
the speed of information, indicating that they are trying to maximize their profit on spe-cial information. The four banks are all large-cap, hence should not reveal as much extra information when insiders trade (Lakonishok and Lee, 2001). There therefore exist many contradictory observations regarding the possibilities for abnormal return. This is what makes it interesting to find out if the possibility actually exists.
While a lot of studies have been made on international markets, especially the American market, there have not been any recent peer-reviewed articles constructed on the Swed-ish market regarding outsider mimicking insider trading. Further, according to my con-cern no studies have been done that analyse a special segment within the market.
1.5
Purpose
The purpose of this thesis is to explore whether there exist an opportunity in the Swed-ish bank sector for outsiders to earn abnormal return based on insiders’ transactions. In the process an indirect test will be made to see if the semi-strong form of efficiency holds for the Swedish bank sector.
1.6
Method
In order to determine whether or not there is a possibility to make abnormal return by following insider trading in the banks, the results must also be statistically and eco-nomically significant. With the intention of achieving this, the hypotheses will be based on earlier research and findings and test these against my empirical data. The data is collected from the Financial Supervisory Authority and Nasdaq WebPages. The conclu-sion will come from the empirical findings and state whether or not the results are in line with economic theories and earlier research.
9 Researcher tests or verifies a theory Researcher tests hypotheses or research questions
from the theory
Researcher defines and operationalizes variables derived
from the theory Researcher measures
or observes variables using an instrument
to obtain scores
2
Methodology
This chapter will start by presenting the approach I have chosen in order to get as good results as possible. Then the concept of the event study will be introduced. Finally a mo-tivation will be given towards the usage of the different tests that will be used.
2.1
Method approach
The philosophical statements are important to have in mind when doing research. Ac-cording to Saunders, Lewis and Thornhill (2009) there are four aspects of the term phi-losophy. They are;
Positivism
Realism
Interpretivism
Pragmatism
Positivism states that you take the position of “the natural scientist”. When wanting to try to find out an answer by collecting quantitative data and applying theories, then the researcher is using the positivistic philosophy. This study is therefore using the positiv-istic philosophy9.
2.2
Research approach
In general there are two ways of conducting a research. They are the deductive approach and the inductive approach. Creswell (2003) explains that when doing a quantitative analysis the best way to do is by following a deductive approach. Figure 2-1 shows the steps in a deductive model for quantitative studies. The researcher verifies a theory by
9 See Saunders et al (2009) to read about the other aspects.
10
constructing hypotheses derived from theory. This is the method that will generate the best solution toward the research (Creswell, 2003). Inductive testing is the deductive testing but in reverse. This kind of approach is more applicable when conducting quali-tative researches. Therefore instead of sticking my hand into the fire ten times to see if it is warm each time (inductive), the assumption will instead be that the fire is warm and the research will start from there (deductive).
After focusing on those aspects, it is important to start determine what kind of tests one wants to conduct.
2.3
Event study
When testing for semi-strong form, a very widely used method is to construct an event study (Elton, Gruber, Brown and Goetzmann, 2011). Event studies were originally de-signed by Fama, Fisher, Jensen and Roll (1969) in order to measure how stock prices respond to new information.
When constructing the event study, this thesis will follow the eight steps presented by Elton et al (2011).
1. Collect a sample of firms that had a surprise announcement. The “surprise” will be when any insider in the banks makes a buy or sell action within the bank stocks and that action from the insider becomes public.
2. Determine the precise day of the announcement and designate this day as zero. The precise day when the action happens will be constructed as day zero. This study will use daily data to test the before and after effects.
3. Define the period to be studied. The intervals will differ from -10 up to + 120 days (see Figure 2-2).
4. For each of the firms in the sample, compute the return on each of the days being
studied. The expected return will be calculated with the market model10.
5. Compute the abnormal return for each of the days being studied for each firm in the
sample.
6. Compute for each day in the event period the average abnormal return for all the
firms in the sample. Meaning that all the transactions within the banks will be added
to-gether, and then calculate the average.
7. Often the individual day’s abnormal return is added together to compute the
cumula-tive abnormal return from the beginning of the period.
8. Examine and discuss the results.
11
What the test does is that it helps observing anomalities at a certain point of time, which is very useful when one wants to see the market movement from insider trading.
2.3.1 Estimation window
The estimation window (Figure 2-2) is constructed in order to be able to calculate pa-rameters for the expected return model and will symbolise the state of the market before the event. According to Mackinlay (1997) the estimation window should be no longer than 250 days before the event. In this study the estimation window will be between -180 to -11 days prior to the event.
Figure 2-2 Event window and Estimation window
-10 to 120 days
-10 to 60 days
-180 to -11 days -10 to 30 days
T-2 T-1 T0 T1 T2 T3
Estimation window Event window
2.4
Abnormal return
To be able to calculate the abnormal return, one must first calculate the expected return. To calculate the expected return one must first define what kind of return that will be used; daily, weekly or monthly. This study uses daily data because it shows a more pre-cise movement of the stock prices (Aczel and Sounderpandian, 2009). There are also two ways to calculate the daily return. One is by using discrete values and the second by using logarithmic values. This study will use logarithmic return (Equation 1) since it is better at constructing normally distributed results than the discrete method, which in-creases the power of the t-test (Aczel and Sounderpandian, 2009).
𝑅𝑖𝑡 = 𝑙𝑛 𝑃𝑖𝑡
𝑃𝑖𝑡 −1 (1)
Where;
Pit= closing price of day t in security i
Pit-1= closing price of the day before t in security i
12
There are four models that are widely used to determine expected return (Copeland, Weston and Shastri, 2005). These are the CAPM-based method, empirical market line, the multifactor cross-sectional model and the market model. The empirical technique of constructing the CAPM and the empirical market line are subject to Roll’s critique11. He argued that it is mathematically impossible to get statistical significant abnormal return by using those methods and therefore those methods will not be applied. The multifac-tor cross sectional model is better when comparing performance by different sizes and since in this study all the companies are large cap stocks; this kind of model will not be used.
By conclusion the market model will be applied, which has also been used increasingly in finance (Elton et al, 2011). The market model states a linear relationship between the return and the market and is seen in Equation 2.
𝑅𝑖 = 𝑎𝑖 + 𝛽𝑖𝑅𝑚 (2)
Where 𝑎𝑖 = 𝑟𝑒𝑡𝑢𝑟𝑛 𝑖𝑛𝑑𝑒𝑝𝑒𝑛𝑑𝑒𝑛𝑡 𝑜𝑓 𝑡ℎ𝑒 𝑚𝑎𝑟𝑘𝑒𝑡 𝑟𝑒𝑡𝑢𝑟𝑛, and can be put as; ai = 𝛼𝑖+𝑒𝑖, where 𝛼𝑖 = 𝑒𝑥𝑝𝑒𝑐𝑡𝑒𝑑 𝑣𝑎𝑙𝑢𝑒 𝑜𝑓 𝑎𝑖 , and 𝑒𝑖 = 𝑟𝑎𝑛𝑑𝑜𝑚 𝑒𝑙𝑒𝑚𝑒𝑛𝑡 𝑜𝑓 𝑎𝑖 We get; 𝑅𝑖 = 𝛼𝑖 + 𝛽𝑖𝑅𝑚 + 𝑒𝑖 (3) Where; 𝑅𝑖 = 𝐴𝑐𝑡𝑢𝑎𝑙 𝑟𝑒𝑡𝑢𝑟𝑛 𝑖𝑛 𝑠𝑒𝑐𝑢𝑟𝑖𝑡𝑦 𝑖 𝛽𝑖 = 𝑅𝑒𝑠𝑝𝑜𝑛𝑠𝑖𝑣𝑒𝑛𝑒𝑠𝑠 𝑖𝑛 𝑠𝑒𝑐𝑢𝑟𝑖𝑡𝑦 𝑖 𝑡𝑜 𝑡ℎ𝑒 𝑚𝑎𝑟𝑘𝑒𝑡 𝑟𝑒𝑡𝑢𝑟𝑛 𝑅𝑚 = 𝑀𝑎𝑟𝑘𝑒𝑡 𝑟𝑒𝑡𝑢𝑟𝑛
The market index in this thesis is a bank index called OMX Stockholm Banks PI, it has been chosen to minimize the non-systematic risk.
This leads to the expected return that can be seen in Equation 4.
𝑅 = 𝛼𝑖 𝑖 + 𝛽𝑖𝑅 𝑚 (4)
Were;
𝑅 = 𝐸𝑥𝑝𝑒𝑐𝑡𝑒𝑑 𝑟𝑒𝑡𝑢𝑟𝑛 𝑖
𝑅 𝑚 = 𝐸𝑥𝑝𝑒𝑐𝑡𝑒𝑑 𝑚𝑎𝑟𝑘𝑒𝑡 𝑟𝑒𝑡𝑢𝑟𝑛
The abnormal return (AR) is then calculated as in Equation 5.
𝐴𝑅𝑖 = 𝑅𝑖− 𝑅 𝑖 (5)
13
2.5
Cumulative Average Abnormal Return
Trying to determine whether the actions of insiders in certain companies have signifi-cant effects, constructing AR will not be sufficient. Instead one should apply the Cumu-lative Average Abnormal Return (CAAR) when constructing event studies (Kothari and Warner, 2006). This is done by first calculating the Cumulative Abnormal Return (CAR) (Equation 6).
𝐶𝐴𝑅𝑖𝑡 = 𝑛 𝐴𝑅𝑖𝑡
𝑡=1 (6)
To calculate the average of the result from CAR, the procedure can be seen in Equation 7.
𝐶𝐴𝐴𝑅𝑖𝑡 =𝑛1 𝑇 𝐶𝐴𝑅𝑖𝑡
𝑡=1 (7)
2.6
Hypotheses
Lakonishok and Lee (2001) found that the market does not respond when the news of an insider transaction has occurred, resulting in an opportunity to get abnormal return on the investment since insiders indeed were trading on special information. It would there-fore be interesting to see if that same opportunity exists within the Swedish banks. The first Hypothesis is therefore conducted in order to see if the market regards the an-nouncement of insider trading to bring new information about the companies or not. Both buy transactions and sell transactions will be analysed.
H0: CAAR0 = 0, No new information
H1: CAAR0 ≠ 0, New information
In order to see if the market responded correctly on the event day or not, a test on the CAAR some days later of the event day must be done. Stocks in banks purchased by in-sider persons and employees are not allowed to sell their stocks until 30 days has passed. This makes controlling any time shorter than this irrelevant. Therefore test on the 30th, 60th and 120th day has been decided and will be analysed. The maximum of 120 days has been chosen to further minimize the problem of cross-correlation which Kothari and Warner (2006) warns about (see below).
The second hypothesis is constructed to see whether the market responded correctly at the event day or if there is an opportunity for an outsider to gain abnormal return by fol-lowing insider traders in any of the four banks.
H0: CAAR30, 60,120 = 0
14
2.7
T-test
When testing a hypothesis it is important to have a strong power of the test (Aczel and Sounderpandian, 2009). The power is measured in the probabilities of Type 1 and Type 2 error to occur. The errors are shown in Table 2-1.
Table 2-1, Type I and Type II error
H0 True H0 False
Not reject H0 No error Type II error
Reject H0 Type 1 error No error
The most used type of testing the significance is to use the T-test. In order for the T-test to work properly, the result must be following normal distribution. It is calculated in Equation 8.
𝑇 − 𝑡𝑒𝑠𝑡 = 𝐶𝐴𝐴𝑅𝑡
(𝜎𝐶𝐴𝐴𝑅/ 𝑛−1) (8)
The result is then tested against a distribution table and can be tested against different levels of significance. The results that are showing a 90% significance will be noted but not be assumed to be significant in the analysis.
A number of studies has shown that by using CAAR in the long run the distribution will not necessarily be normal, meaning that the Central Limit Theorem12 (CLT) (the as-sumption of when n>30, the distribution becomes normal) does not apply (Lyon, Barber and Tsai, 1999 & Kothari and Warner, 2006). Another problem in the long run is the problem with cross-correlation between the event windows. The definition of long run is tests of one year or longer (Jegadeesh and Karceski, 2009). Since this test involves at most up to the first 120 days after the event, these problem will not affect the results as much. Nevertheless in order to minimize the problem with the data not being normal distributed, a non-parametric test will be conducted, which does not need the assump-tion of normal distribuassump-tion to hold.
2.8
Wilcoxon signed rank test
This test is useful when testing comparison between two populations, often used in “be-fore and after” studies (Aczel and Sounderpandian, 2009). In this test the expected re-turn will be the “before” population and the actual rere-turn will be the “after” population. The test also takes into consideration the magnitude of the difference between the popu-lations by dividing them into ranks. Then you sum up all the negative (in this case when expected return ≥ actual return) ranks absolute value. This result generates a value that is tested against a table chart for different levels of significance and sample sizes. If this value is greater than the critical point, the null hypothesis cannot be rejected (Aczel and Sounderpandian, 2009).
15
Table 2-2, Wilcoxon signed rank test
Observation Actual return Expected return Difference (D) Rank absolute numbers Rank of positive D Rank of negative D 1 2 1 1 1 1 2 3 5 -2 2 2 Etc. ∑+=1 ∑-=2
From the example in Table 2-2 the Wilcoxon T value is 2, if the critical value where to be 3, then we would have rejected the null hypothesis.
In this research the standardized Z-statistic (Equation 9) will be used to determine the significance of the Wilcoxon test.
𝑍 =𝑇−𝐸(𝑇)𝜎
𝑇 (9)
Where;
𝐸 𝑇 = 𝑛(𝑛+1)4 (10)
𝜎𝑇 = 𝑛 𝑛+1 (2𝑛+1)24 (11)
This rises however the question of which of the test to go on, when the T-test and the Wilcoxon test shows contradictive results. Therefore in order to determine that the chi-square test for normal distribution will be used.
2.9
Chi-square test for normal distribution
In order to see which of the test should be more emphasized when n>30, a Chi-square test for normal distribution will be applied. It is constructed by dividing the data in six different interval based on the data’s value. From there it calculates the chi-square value according to Equation 12. If the p-value of the chi-square test is lower than the signifi-cance, then we cannot assume a normal distribution and the non-parametric test will have greater power than the t-test.
𝜒2 = (𝑂𝑖−𝐸𝑖)2 𝐸𝑖 𝑘
𝑖=1 (12)
Where;
k = Numbers of interval being used Oi = Observed counts in the interval
16
When n<30 the chi square test becomes biased and will not be a good measure for the distribution. However this will not be a problem, because when n<30 the Wilcoxon test will be a better test of testing for significance than the t-test, because the assumption of normal distribution cannot be applied.
Seyhun (2000) says that the transaction cost is approximately around 1 %. Therefore this study will assume 1% in transaction costs in order to better compare the result to earlier research. This percentage will be subtracted from the statistical significant CAAR results in order to see if the CAAR remains positive.
2.10 Validity
Validity is a term which tries to determine if the data provided is answering the question at hand or not (Bell, 2006).
2.10.1 Primary and secondary data
Primary data consists of data collected for the first time from primary sources (Kumar 2008). These kinds of data are usually collected when doing qualitative research or us-ing questionnaires (Saunders et al 2009). This research will instead use secondary data which consists of data that have been conducted and analysed by other individual, these types of data are usually found in journals and books. The problem with secondary data is to assure the reliability of the information. In the literature research I have mostly used academic journals found in secondary resources. Since an academic journal is be-ing evaluated by academic peers before grantbe-ing access to be published (Saunders et al, 2009), the articles found in them are considered legitimate.
The data concerning the insider trading and information about the different banks has come from government affiliations. Sweden comes fourth on the Corruption Perceptions Index13. There is therefore no reason to believe that the government would interfere in the statistic results made by their affiliations, meaning that those results are not to be considered biased.
2.10.2 Data collection
To get as good results as possible which reflect the reality one should try to have as large sample as possible (Kumar, 2008). In this thesis all the transactions, which have been made by insiders between the year 2006 and 2010 within the banks, were used as the sample. The sample period has been determined so that it contains both good eco-nomic periods and bad ecoeco-nomic periods. This is important according to Fama (1998) and Copeland et al (2005) to prove that an abnormal profit opportunity clearly exists. All transactions which were not a pure buy or sell transaction were abolished, since those two types of transactions symbolise an active action from the insiders.
13 Constructed by Transparency International, where the better position the country places the less corrupt it
17
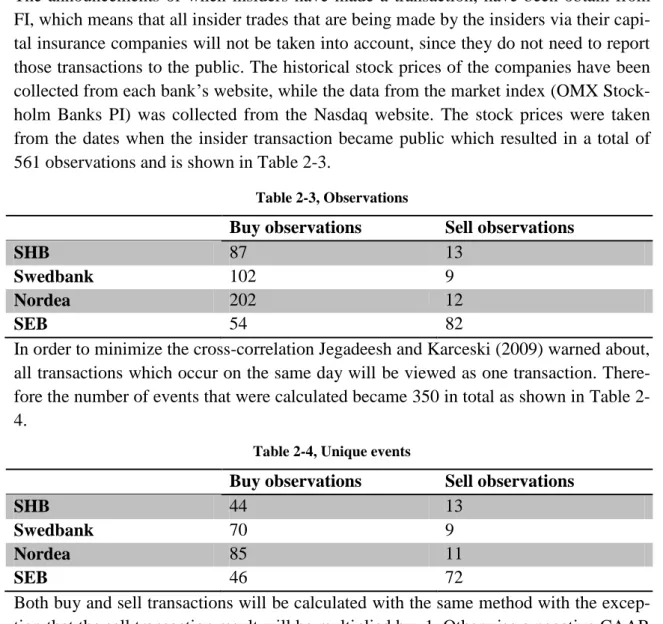
The announcements of when insiders have made a transaction, have been obtain from FI, which means that all insider trades that are being made by the insiders via their capi-tal insurance companies will not be taken into account, since they do not need to report those transactions to the public. The historical stock prices of the companies have been collected from each bank’s website, while the data from the market index (OMX Stock-holm Banks PI) was collected from the Nasdaq website. The stock prices were taken from the dates when the insider transaction became public which resulted in a total of 561 observations and is shown in Table 2-3.
Table 2-3, Observations
Buy observations Sell observations
SHB 87 13
Swedbank 102 9
Nordea 202 12
SEB 54 82
In order to minimize the cross-correlation Jegadeesh and Karceski (2009) warned about, all transactions which occur on the same day will be viewed as one transaction. There-fore the number of events that were calculated became 350 in total as shown in Table 2-4.
Table 2-4, Unique events
Buy observations Sell observations
SHB 44 13
Swedbank 70 9
Nordea 85 11
SEB 46 72
Both buy and sell transactions will be calculated with the same method with the excep-tion that the sell transacexcep-tion result will be multiplied by -1. Otherwise a negative CAAR would be a bad result for buy transactions but good results for sell transactions. There-fore this is done in order for the result to be easier to interpret in context of its value to the outsider where all positive CAAR are good for the outsider and all the negative CAAR are bad for the outsider.
2.10.3 Common mistakes
When conducting empirical studies, Copeland, Weston and Shastri (2005) warn about eight common mistakes.
1. Biased model of equilibrium returns, telling us that if the model we use to define
normal return is biased, our result will not estimate the correct normal return. This prob-lem has been minimized by using the Market model.
2. Specification searches, indicating that you will always find certain periods where a
18
five year (2006-2010) sample period, which contains different states of the market, which will limit this problem.
3. Sample selection bias, describes that a portfolio will always show positive abnormal
return prior to a split. These problems often affect those who are examining split reac-tions.
4. Survivorship bias, when, for example, a study is made to test the earnings of
small-cap companies over a ten year period. If the researcher neglects to add the result of all those companies that has disappeared in the last ten years, the results will be upward-biased. This potential bias is however eliminated in this study, since the study is testing predetermined stocks which have existed during the whole test period.
5. Biased measurements of return, saying that calculations of geometric returns over
several years will overstate the real performance. Instead using the ratio of geometric re-turns gives appropriate results when comparing different time spans.
6. Inappropriate portfolio weightings, indicates that for example using to many
small-cap companies in order to determine the state of the whole market is not appropriate. This test is however not testing whether or not the whole market is inefficient.
7. Failure to distinguish between statistical and economic significance, to conclude that
market is inefficient based only on statistical significance is wrong. A researcher must also test whether the arbitrage profit withstands after taking into account the transaction cost. This study uses a transaction cost of 1%.
8. Overestimation the frequency of opportunity for arbitrage, to be able to determine
that markets are inefficient the frequency of opportunity of abnormal returns must be high.
19
3
Theoretical framework
In this section I present the necessary aspects for abnormal profit to outsiders mimick-ing insiders. After that, a presentation of the Efficient Market Hypothesis (EMH) which claims that it is unlikely that outsiders will benefit from insiders will be described. Fi-nally the Behavioural Finance (BF) is introduced in order to try to explain the pattern found in previous research where EMH fails to explain.
3.1
Exploiting insider trading
According to Seyhun (2000) there are three factors to be considered in order for outsid-ers to be able to earn abnormal return from insider trading. The first assumption regards the reporting delay when insiders reporting their transactions. If for example it would take up to two months for an outsider to know that an insider has made a transaction, then that special information the insider traded on has already become public, leaving the information useless now. However, internet and the stricter governmental laws to-ward insider trading, has contributed so that most countries demand that insiders must report their transactions within 5 days. Knowing that the banks insider must hold their stocks for at least 30 days, the outsider know if the insider is trading on special knowl-edge then he or she will also be able to benefit from it.
The second assumption is that the abnormal profit must exceed transaction costs. Since an active investment strategy is more costly than a simple buy-and-hold strategy with the index portfolio, the awareness of transaction cost becomes even more important. This goes hand in hand with Copeland et al (2005) remarks about economic signifi-cance.
The last factor in order to be able to earn from insiders is that the risk to outsider must be minimized in order for them to see it beneficial. This is because Seyhun (2000) claims most people are risk averse, meaning that they are not only concerned with the ability to make profit, but also the probability to make losses. Seyhun continue saying that as long as the transactions are not cross-correlated with each other the portfolio re-mains diversified which minimizes the risk further.
In order for an outsider to have the opportunity of abnormal return, the outsider must be able to act before the rest of the market does. This could be difficult since the market re-ceive the news simultaneously. According to the Efficient Market Hypothesis this is in-deed very unlikely to occur.
3.2
Efficient Market Hypothesis
“If you find a $100 bill on the street walk, don’t pick it up. If it were real somebody
would have picked it up already” - Unknown
The quote above is a common joke among economists in order to describe the Efficient Market Hypothesis (EMH). The theory behind the EMH comes from Fama (1970). To
20
describe the theory in short it would be that prices fully reflect all available information. In his article he states that there are some conditions that should be fulfilled if the theory should hold. In a summary they are;
There are no transaction costs
All available information is available at no costs to all of the market participants
All investors analyses the available information and make the same conclusions. Hence they are being rational.
Fama (1970) continues stating that even though these conditions are sufficient for the capital market efficiency, they are not necessary. As long as a satisfactory amount of in-vestors have access to available information and that there are not some inin-vestors who constantly make better evaluations of available information than others, the market effi-ciency holds. He later divides up the market condition into three groups;
Weak form;
For the weak form (also called tests of return predictability) to hold, all past stock prices must be reflected into current stock price (Fama, 1991). This means that as an individ-ual you cannot analyse recent stock prices in order to predict future stock prices. The market should follow what is called a Random Walk. A Random Walk explain that the likelihood that the price tomorrow will go up, down or stay the same, have the same probability to occur (Fama, 1965).
The random walk theory claims that the usage of both technical analysis and fundamen-tal analyses of stock prices are inefficient. Technical analysis is based upon examine past returns in order to find trends or other abnormalities to be able to predict future stock prices. Fundamental analysis focuses more on today’s data (for example annual reports) in order to make future forecasts. In the weak form however the usage of fun-damental analysis could still be useful in order to predict future returns.
Semi-strong form;
The semi-strong form (also called studies of announcements) states that all public avail-able information is reflected in the stock price (Fama, 1991). The assumption of this is that it is impossible to make abnormal returns by analysing publicly available data, for example annual reports. This means that the usage of fundamental analysis no longer is effective. Fama (1970) finds that much empirical results support the market conditions up to this level.
Strong form;
The strong form represent a market were both public and non-public information are re-flected in the stock price. This proposes a scenario where not even insiders can trade on information which is not known to the public, and make excessive profit. Fama (1970) argues that even if this market state is most likely unreachable, there are so few who can take advantage of it, leaving the EMH still in a good description of the real world.
21
In conclusion for this study the weak form will not be tested since the purpose of this study does not concern it. The strong form seems to have little real life proof of existing and even Fama (1970) states that it is unlikely to hold. Even this state is not in direct concern of this study; the bank sector must however not be in this form, in order for outsider to be able to profit from insiders abnormal returns investments. The state that is interesting to examine is the semi-strong form, and according to EMH my result would look similar to Figure 3-1, if the market assumes that the insider contain special infor-mation. This leaves no possibility for abnormal return after the announcement of insider trading.
How come that some research find evidence for inefficiency in semi-strong form? One could state that the market researched simply does not meet the requirements for semi-strong form and conclude that the market is, at highest, in a weak form state. This how-ever does not explain what is happening when people earn abnormal return on public available information. In order to try to explain why that would be possible in the first place, the concept of Behavioural Finance (BF) is introduced.
3.3
Behavioural Finance
The definition of Behavioural Finance (BF) is “The study of the role played by
psycho-logical factors in financial decision making and hence their effect on overall market outcomes” (Law, 2008). BF is according to Shleifer (2000) based upon two
founda-tions, which are Limits to Arbitrage and Investor Sentiment. Limits to Arbitrage states that a lot of securities do not have good substitutes, which is very risky for the arbitra-geur, since the prices do not go back to the equilibrium state directly. This gives indica-tion that prices do not always shift in the right amount, leaving the market inefficient. Investor sentiment tries to explain how investors own biases and belief creating the
de-Time C A A R % T0 Price
22
mand for securities, which contradicts the assumptions of rational behaviour. Therefore BF is based upon the idea of irrational investors’ makes disturbances in the market which arbitrageurs cannot eliminate (Shleifer, 2000).
3.3.1 Limits to Arbitrage
According to the EMH theory, even if there are irrational investors in the market, there will always be so called arbitrageurs who exploit this irrationality and therefore brings back the price back to its fundamental value. In order for them to be able to do that, they must be able to short sell stocks. Short selling is illegal or at least regulated in many markets. In those markets where it is not, it can still be very hard to find any brokers who are willing to lend their stocks (Shleifer, 2000).
Shleifer and Vishny (1997) found that arbitrageurs do make the price return towards its fundamental value, when the mispricing is small. When the mispricing is larger the ef-fect is not as powerful. The reason being the higher the mispricing the higher the vola-tility of the arbitrage position will be. Even though the position would have attractive expected returns, the volatility would also bring greater risk of losses and the ability to liquidate the portfolio under pressure from the outside investors.
Ritter (2003) divides the opportunity of arbitrage into high frequency events and low frequency events. He claims that high frequency events are in line with the EMH be-cause it is hard to locate an investment strategy that is continuously profitable. The low frequency events do not support the EMH because if it did then for example the 1987 stock market crash or the 1999-2000 IT-bubble would not have occurred. For low fre-quency events the arbitrageurs gets wiped out, even though their assumptions of the long run are correct but they cannot afford to stay in their position until the market real-ises the mispricing.
When researching for opportunities in insider trading, the theory of limited arbitrage claims that this indeed would be possible, since the professionals fail to close the gap that may occur from market movements. However the most interestingly factor when regarding opportunity for abnormal return, is the possibility to do this if you understand peoples motives and be able to exploit this. This brings us to the concept of Investor Sentiment.
3.3.2 Investor Sentiment
The idea of people being rational has been questioned by many researchers. Ricciardi and Simon (2000) found evidence that there is a correlation between decision and irra-tionality, where the EMH claims that the irrational investors’ behaviour is random and that the effects will cancel them out. Ritter (2003) lists some patterns describing irra-tional behaviour;
Heuristics
23 Mental accounting Framing Representivness Conservatism Disposition effect
The points which are the most relevant to this study are the overconfidence, represen-tivness and conservatism factors14. According to Shefrin (2008) investors seem to be overconfident in their investing abilities and ignoring or at least underestimate the risk that is involved. The conservatism factor states according to Ritter (2003) that investors seem to adjust slowly to news announcements, especially when the news contradicts their own beliefs for the future. However if the same news keeps on coming for a long time then people will react to it, but they will probably by then overreact due to the rep-resentivness bias. This bias describes the pattern when investors ignore the long term averages and instead only analyse recent events. This is according to Shiller (2002) one of main the reasons why economic bubbles like the stock market crash in 1987 and the IT bubble bursting in 2000 were realised.
These points help the understanding of why there is a possibility to earn abnormal re-turn. This is because they explain the phenomena of over- and underreactions in the stock price of news announcements. In Figure 3-2 we can see that if people overreact to news, then it will take awhile before the price returns to its fundamental value. This is because arbitrageurs are unable to correct this directly. If an investor is able to foresee this, then he or she would be able to benefit from this before the stock price adjusts back to its fundamental value. This phenomenon could very well explain why recent studies have shown that earning abnormal return by mimicking insiders is possible.
14 To read about the other factors see Ritter (2003)
New Price
Old Price
T0 Time
Overreaction
Underreaction
24
In criticism towards BF, Fama (1998) argued that BF theories can only explain one spe-cific event at the time and are unable to explain the whole market. He therefore argues that BF is not a good replacement for EMH. Further he claims that the techniques in or-der to find anomalities are predetermined and when using other methods, the anomali-ties disappear. He therefore questions the results of BF research.
To summarize, Seyhun (2000) brings up three factors in order to be able to mimic insid-ers as an outsider. The EMH claims that this is not possible in the semi-strong form, and if it is possible then the market could be described as at most to be in weak form effi-ciency. The EMH fails to describe why some researchers found events that could dis-prove the semi-strong form. BF however claims that it is not likely for markets to be ef-ficient in the first place, indicating that opportunities for abnormal return do exist, due to Limits to Arbitrage and Investor Sentiment.
25
4
Empirical Findings
In this chapter the results of the findings will be presented, together with the tests of significance. First the overall market movements on the event day will be tested. Later in the chapter the results of the findings on the days after the event of each of the banks will be accessible. There will also be a short statement whether or not the results are significant.
Before presenting the result I will present the different critical values15 each statistical test must be larger, in absolute values, in order for the results to be considered signifi-cant. For the buy transactions, all of the companies have more than 30 observations which lead them to have the same critical values. When it comes to sell transactions, three of the banks do not overcome 30 observations. This means that they have different critical values and will therefore first be compared towards the Wilcoxon test. The criti-cal values for the t-test are presented in Table 4-1.
Table 4-1, Critical values T-test T-test, critical values Buy (90%, 95% and 99%
significance) Sell (90%, 95% and 99% significance) SHB 1.65, 1.96, 2.57 1.78, 2.18, 3.10 Nordea 1.65, 1.96, 2.57 1.81, 2.23, 3.17 Swedbank 1.65, 1.96, 2.57 1.86, 2.30, 3.35 SEB 1.65, 1.96, 2.57 1.65, 1.96, 2.57
For the Chi-square test and Wilcoxon test, their p-value must simply be lower than the error level being tested, to be viewed as significant.
4.1
Market movements
When observing the market adjustments on the event day for the bank sector, Table 4-2 shows that there in fact are no adjustments. This pattern seems to hold until 60 days has passed, when the negative CAAR result of 1,6% is 99% significant on both the t-test and the Wilcoxon test. Between the 60th day and the 120th day the market shows indica-tion to adjust back to its fundamental value. Interestingly, the result on the 60th day is negative, indicating that the market is acting opposite of what the insiders predicted. Further the Chi-square test shows strong indication that the distributions does not re-main normal when the number of observations exceeds 30, since the Chi square results are significant on all periods with 99% significance.