This is the published version of a paper published in BMC Medical Genetics.
Citation for the original published paper (version of record):
Ahmad, S., Zhao, W., Renstrom, F., Rasheed, A., Samuel, M. et al. (2015)
Physical activity, smoking, and genetic predisposition to obesity in people from Pakistan: the
PROMIS study.
BMC Medical Genetics, 16: 114
http://dx.doi.org/10.1186/s12881-015-0259-x
Access to the published version may require subscription.
N.B. When citing this work, cite the original published paper.
Permanent link to this version:
R E S E A R C H A R T I C L E
Open Access
Physical activity, smoking, and genetic
predisposition to obesity in people from
Pakistan: the PROMIS study
Shafqat Ahmad
1, Wei Zhao
2, Frida Renström
1, Asif Rasheed
3, Maria Samuel
3, Mozzam Zaidi
3, Nabi Shah
3,4,
Nadeem Hayyat Mallick
5, Khan Shah Zaman
6, Mohammad Ishaq
7, Syed Zahed Rasheed
7,
Fazal-ur-Rheman Memon
8, Bashir Hanif
9, Muhammad Shakir Lakhani
9, Faisal Ahmed
10, Shahana Urooj Kazmi
11,
Philippe Frossard
3,12, Paul W. Franks
1,13,14*†and Danish Saleheen
2,3,15*†Abstract
Background: Multiple genetic variants have been reliably associated with obesity-related traits in Europeans, but little is known about their associations and interactions with lifestyle factors in South Asians.
Methods: In 16,157 Pakistani adults (8232 controls; 7925 diagnosed with myocardial infarction [MI]) enrolled in the PROMIS Study, we tested whether: a) BMI-associated loci, individually or in aggregate (as a genetic risk score - GRS), are associated with BMI; b) physical activity and smoking modify the association of these loci with BMI. Analyses were adjusted for age, age2, sex, MI (yes/no), and population substructure.
Results: Of 95 SNPs studied here, 73 showed directionally consistent effects on BMI as reported in Europeans. Each additional BMI-raising allele of the GRS was associated with 0.04 (SE = 0.01) kg/m2higher BMI (P = 4.5 × 10⁻¹⁴). We observed nominal evidence of interactions of CLIP1 rs11583200 (Pinteraction= 0.014), CADM2 rs13078960
(Pinteraction= 0.037) and GALNT10 rs7715256 (Pinteraction= 0.048) with physical activity, and PTBP2 rs11165643 (Pinteraction= 0.045), HIP1 rs1167827 (Pinteraction= 0.015), C6orf106 rs205262 (Pinteraction= 0.032) and GRID1 rs7899106 (Pinteraction= 0.043) with smoking on BMI.
Conclusions: Most BMI-associated loci have directionally consistent effects on BMI in Pakistanis and Europeans. There were suggestive interactions of established BMI-related SNPs with smoking or physical activity.
Keywords: Obesity, Physical activity, Smoking, Genetic susceptibility, Gene-lifestyle interactions Background
Obesity and its numerous metabolic, atherogenic, osteo-arthritic, and metastatic comorbidities [1–4] place enor-mous burdens on health care systems, societies and individuals worldwide. The global prevalence of obesity has increased substantially in recent decades; in 2010, it was estimated that overweight and obesity caused 3·4 million deaths worldwide [5]. Obesity and its comorbidi-ties present major health and financial challenges in
South Asia, with Pakistan being the ninth highest-ranking country in terms of the global burden of obesity [5]. As in many other societies, the obesity epidemic in South Asians is driven by the recent, widespread adop-tion of Westernized lifestyles causing chronic positive energy balance [6]. In South Asians, however, it is widely believed that these changes in lifestyle are set against a genetic background that renders this population espe-cially susceptible to the adverse cardiometabolic conse-quences of obesity.
While the specific genetic aberrations that give rise to the high heritability estimates observed for obesity have been studied extensively in Europeans [7], few studies have been reported in indigenous South Asian populations. The identities of 97 independent loci that harbor BMI–
* Correspondence:paul.franks@med.lu.se;saleheen@mail.med.upenn.edu †Equal contributors
1
Genetic and Molecular Epidemiology Unit, Lund University Diabetes Centre, Department of Clinical Sciences, Lund University, Malmö, Sweden
2Perelman School of Medicine at the University of Pennsylvania, Philadelphia, PA, USA
Full list of author information is available at the end of the article
© 2015 Ahmad et al. Open Access This article is distributed under the terms of the Creative Commons Attribution 4.0 International License (http://creativecommons.org/licenses/by/4.0/), which permits unrestricted use, distribution, and reproduction in any medium, provided you give appropriate credit to the original author(s) and the source, provide a link to the Creative Commons license, and indicate if changes were made. The Creative Commons Public Domain Dedication waiver (http://creativecommons.org/publicdomain/zero/1.0/) applies to the data made available in this article, unless otherwise stated.
associated variants are now established in European–an-cestry populations [8]. Other studies of European-anEuropean–an-cestry populations have explored whether some of these loci interact with physical activity and smoking to affect obesity predisposition [9–15], but none has been reported in indi-genous South Asians to date.
This study was undertaken in 16,157 ethnic Pakistani adults from the Pakistan Risk of Myocardial Infarc-tion Study (PROMIS). The aim of the study was to examine genetic associations and gene-lifestyle inter-actions for BMI-associated variants previously identi-fied and replicated in European-ancestry populations [8]. We focused on comparing the direction and magnitude of the genetic association signals between European and Pakistani adults; we also sought to de-termine if smoking or physical activity modified these effects.
Methods
Study sample
PROMIS is a case–control study of acute myocardial in-farction (MI) in participants recruited from six centres in urban Pakistan. Frequency-matched controls by age (5-year strata) and sex were identified from patients at-tending the outpatient clinic for routine checkups, and visitors to the hospital (including non-blood related visi-tors of PROMIS cases). Non-fasting blood samples were collected from each participant. For MI cases data were collected within 24 h of the onset of symptoms. A detailed description of the PROMIS study, including par-ticipant selection criteria, has been published elsewhere [16–18]. The participants were enrolled from the National Institute of Cardiovascular Disorders Karachi, Karachi Institute of Institute of Heart Diseases Karachi, Red Crescent Hospital Hyderabad, Punjab Institute of Cardiology Lahore, Multan Institute of Cardiology Multan, and Faisalabad Institute of Cardiology, Faisal-abad. All participants provided written informed consent and the study was approved by the research ethics com-mittee of the Center for Non-Communicable Diseases (CNCD) Pakistan and also by regional Ethical Review committees in the different centres across Pakistan in-volved in the study. In-addition to the institutional re-view board (IRB) at CNCD, Karachi, IRBs at National Institute of Cardiovascular Disorders, Karachi, Punjab Institute of Cardiology, Lahore, and Tabba Heart Insti-tute, Karachi approved the study.
Body composition and exposure assessment
Height and weight were measured using calibrated wall-mounted stadiometers and balance-beam scales, respectively. BMI was calculated as weight in kilo-grams (kg) divided by height in meters squared (m2). Lifestyle factors including smoking and physical
activity were assessed using validated questionnaires administered by trained research medical officers [16]. We defined <18.5 kg/m2 as ‘underweight’; 18.5–22.9 kg/m2
as ‘normal weight’; 23–27.5 kg/m2 as ‘overweight’; and >27.5 kg/m2 as ‘obese’, con-cordant with the WHO recommendations for Asian populations [19].
To quantify physical activity and tobacco exposure, we first developed a pilot questionnaire. For exposure to to-bacco consumption, with the help of local dietician and physicians, we came up with list of all tobacco items that are typically consumed in the Pakistani population. Simi-larly, for physical activity, with the help of an exercise physiologist, questions pertaining to level of activity at work, at home, mode of transportation used for com-muting to work (e.g., bicycle, walking), nature of activ-ities engaged at leisure time and nature of job were assessed in the pilot questionnaire. The pilot question-naire was further used to assess the mode and frequency of tobacco consumption and nature of physical activity in 300 participants who were randomly chosen from an urban resident population in Karachi. The pilot ques-tionnaire also sought information on any other forms of tobacco consumption or physical activity through open ended questions to capture information not covered by the pilot questionnaire. Based on the responses received from the participants, the questionnaire was finalized. Exposure to tobacco consumption was divided into: “ever” or “never” or “current” and information on “smoked”, “chewable”, or “snuffed” forms of tobacco was separately sought. For physical activity, participants were categorized to have“low”, “moderate”, or “intense” phys-ical activity based on their responses. We recognize that we have not used any objective measures to quantify “physical activity” or “exposure to tobacco”; however the magnitude of the inverse association between our esti-mates of physical activity and smoking with BMI in PROMIS is comparable to what has been reported else-where for validated instruments, strongly supporting the validity of our measures. The physical activity variable was constructed by the cross-tabulation of occupational, leisure time, and commuting physical activity, such that the variable categorizes a person’s total physical activity into three levels: (i) light (ii) moderate and (iii) heavy. Participants were categorized into never-smokers, ex-smokers and current-ex-smokers [17] and for the current analyses; a binary smoking variable was created by merging the categories for ‘ex-smokers’ and ‘never-smokers’ (as smoking cessation is likely to convey dif-ferent effects on BMI than current smoking). Sensitiv-ity analyses were also conducted in current smokers vs never smokers by excluding ex-smokers partici-pants and the genetic estimates were not materially different (results not shown).
Genotyping
DNA was extracted from peripheral blood leukocytes using a phenolchloroform protocol [17]. Genotyping was performed using the Illumina Human 650 K/ Illumina Human OmniExpress 770 K. In order to minimize po-tential bias attributable to plate- or batch-specific geno-typing errors, DNA plates contained a mixture of cases and controls, including blank samples [18]. SNPs with departure from Hardy-Weinberg equilibrium (P-value = 1.0 × 10⁻⁶), call rate < 95 % or minor allele frequency <1 % were excluded from the analyses. Participants who were cryptically related or those with ambiguous re-ported sex or with a missing rate for genetic data >5 % were also dropped from the analyses. The GWAS data was subsequently imputed to the global 1000 genomes reference panel (March 2012 (v3)).
Two of the 97 BMI-associated genetic variants (NRXN3 rs10150332 and SLC39A8 rs1310732) [8], did not pass genotyping quality control, and so were ex-cluded from the present analyses. Genotype information and quality control of the remaining 95 BMI-associated variants are shown in Additional file 1: Table S1 and al-lele frequencies were consistent with those reported for GIH (Gujarati Indians in Houston, Texas) population. For the 26 SNPs not reported for GIH, allele frequencies were compared with CEU (Utah residents with Northern and Western European ancestry from the CEPH collec-tion) (http://www.ncbi.nlm.nih.gov/variation/tools/1000 genomes) in 1000 Genome (Additional file 2: Table S4). Hardy-Weinberg equilibrium for 95 BMI associated SNPs were calculated in control samples as shown in Additional file 1: Table S1.
Statistical analyses
An un-weighted genetic risk score (GRS) was calculated based upon 95 BMI-associated variants by summing the number of BMI-associated alleles [8]. We chose not to weight the GRS, as the large databases from where those weightings might be obtained are comprised predomin-antly of European–ancestry populations, which we felt might bias the comparison of our findings with previous studies in Europeans. All variables (e.g., age, BMI and GRS) were normally distributed. General linear models (GLM) were used to assess the association of genotypes (individual SNPs or GRS) with BMI assuming an addi-tive effect. All the models were adjusted for age, age2, sex, case/control status and population substructure (first ten genetic principle components; PCs). Logistic regression was used to calculate odds ratios (ORs) for the association of the GRS with obesity (BMI > 27.5 vs 18.5≤ BMI < 23). To quantify the descriminative ability of these 95 BMI-associated variants, the area under the receiver operating characteristic curve (ROC AUC) was generated from the logistic regression model and
compared using roccomp package in STATA. Generally, it is not advisable to study gene-lifestyle interactions in diseased people, especially when the lifestyle exposures of interest are commonly known risk factors for the disease; therefore we undertook the explicit tests of gene-lifestyle interactions in non-diseased PROMIS par-ticipants only. Although the main effect analyses of SNP/GRS were performed in all participants, including cases, doing so is not susceptible to response bias, as this type of analyses does not involve the use of self-reported lifestyle data. Indeed, the inclusion of these additional 7925 cases in the main effect analysis may be advantageous, as it likely increases statistical power and ensures a degree of independence in the populations studied. Interaction analyses for individual SNPs and GRS were performed by additionally introducing the product term (SNP/GRS x lifestyle exposure) along with the marginal effect terms in the model. All analyses were performed using SAS version 9.4 (SAS Institute, Cary, NC) and STATA (version 12, Stata Corp, College Station, TX, USA) and the analysis script is available from the authors on request.
Results
Participant characteristics are shown in Table 1. In total, 16,157 individuals (7925 MI cases/8232 con-trols) had baseline data available for these analyses. More men (82 %) than women (18 %) participated in this study. The GRS has a mean value of 87 risk al-leles and minimum and maximum values of 64 and 112, respectively.
Main effect of SNP/GRS on BMI
Of the 95 BMI-susceptibility SNPs, 73 showed direction-ally consistent associations with BMI as reported in the original study [8]; of which 22 loci (FLJ30838, BDNF, EHBP1, HHIP, PRKD1, TMEM18, FTO, RASA2, CBLN1, LOC646736, ETS2, KCTD15, NEGR1, C9orf93, SEC16B, ZFP64, ASB4, MC4R, NLRC3, GRID1, TCF7L2 and CALCR) reached P < 0.05 (Fig. 1, Table 2). Consistent with previous studies in European populations, the most strongly BMI-associated variant (lowest p-value) in Pakistanis wasMC4R rs6567160, β = 0.24 (SE = 0.05) kg/ m2per copy of the C allele; (P = 1.2 × 10⁻⁷) (Table 2). In total, these 95 BMI associated variants explain 1.54 % of the phenotypic variance in BMI in the PROMIS cohort, which is less than the 2.7 % reported in Locke et al. [8].
In the overall sample, each unit increase (equivalent to one effect allele) in the GRS was positively associated with BMI (β = 0.04 (SE = 0.01) kg/m2
per allele;P = 4.5 × 10⁻¹⁴) as shown in (Fig. 2). When the GRS was catego-rized into quintiles, the mean BMI difference between the highest and lowest quintile was 0.54 kg/m2(Fig. 1). Each additional GRS risk allele conveyed an odds ratio
(OR) for obesity of 1.02 (95 % CI: 1.02, 1.03;P = 1.2 × 10
−10). The association of each SNP and the GRS with
BMI were directionally consistent in control and case samples, and there was no evidence of effect modifica-tion by disease state (results not shown).
Discriminative accuracy
The discriminative accuracy (ROC AUC) for obesity [obese (N = 5079); BMI ≥27.5 kg/m2
compared with nor-mal weight (N = 3512); 18.5 kg/m2≤ BMI < 23 kg/m2
] of
the model including only the 95 SNPs was 0.590 (95 % CI: 0.549, 0.573) and the discriminative accuracy of the model including only age, age2, sex, case/control status was 0.593 (95 % CI: 0.581, 0.606); adding genotypes to the latter model increased (P <0.0001) the AUC to 0.635 (95 % CI: 0.623, 0.647) (Fig. 3).
Gene-lifestyle interactions
We tested each of the 95 BMI-associated SNPs for inter-actions with physical activity and smoking on BMI in Table 1 Characteristics of the PROMIS study participants
Trait Total sample (N = 16,157) Controls (N = 8232) Cases (N = 7925)
Sex (male/female) % 82/18 80/20 84/16
BMI (kg/m2) 25.8 ± 4.1 25.9 ± 4.3 25.8 ± 3.9
Age (years) 53.8 ± 9.6 54.1 ± 8.9 53.6 ± 10.3
Genetic risk score 87 ± 6 87 ± 6 87 ± 6
a Smoking– N (%) Never 8045 (50) 4810 (58) 3235 (41) Ex-smokers 1495 (9) 819 (10) 676 (9) Current 6537 (41) 2590 (32) 3497 (50) Physical activity- N (%) Light 5261 (39) 2749 (41) 2512 (38) Moderate 6788 (51) 3401 (50) 3387 (51) Heavy 1394 (10) 634 (9) 760 (11)
Data are means ± SD unless otherwise indicated
a
Among controls, N = 13 and N = 1448 participants miss lifestyle data on smoking and physical activity, respectively
-0,15 -0,10 -0,05 0,00 0,05 0,10 0,15 0,20 0,25 0,30 0,35 rs 100094 0 rs 101322 80 rs 101628 7 rs 101821 81 rs 107336 82 rs 109383 97 rs 109685 7 6 rs 110301 04 rs 110574 0 5 rs 111266 66 rs 111656 4 3 rs 111915 60 rs 115832 00 rs 116782 7 rs 116888 16 rs 117276 76 rs 118476 9 7 rs 122869 29 rs 124017 38 rs 124295 4 5 rs 124466 32 rs 125669 85 rs 128854 54 rs 129406 22 rs 130217 37 rs 130789 60 rs 131913 62 rs 132018 77 rs 144126 4 rs 146067 6 rs 151672 5 rs 152843 5 rs 155890 2 rs 168514 83 rs 169077 5 1 rs 169512 75 rs 170016 5 4 rs 170942 22 rs 172030 16 rs 174058 19 rs 177249 92 rs 180857 9 rs 188598 8 rs 192829 5 rs 203352 9 rs 203373 2 rs 205262 rs 207565 0 rs 208045 4 rs 211234 7 rs 212127 9 rs 217604 0 rs 217659 8 rs 220713 9 rs 224536 8 rs 228701 9 rs 236538 9 rs 265049 2 rs 282029 2 rs 283675 4 rs 29941 rs 310133 6 rs 373648 5 rs 381029 1 rs 381733 4 rs 384957 0 rs 388819 0 rs 425698 0 rs 474061 9 rs 478749 1 rs 492400 rs 543874 rs 609154 0 rs 646546 8 rs 647769 4 rs 656716 0 rs 657452 rs 680484 2 rs 713880 3 rs 714142 0 rs 716472 7 rs 723988 3 rs 724335 7 rs 758747 rs 759931 2 rs 771525 6 rs 789910 6 rs 790314 6 rs 937484 2 rs 940023 9 rs 954049 3 rs 964112 3 rs 977747 rs 991457 8 rs 992596 4 Effect Estimates PROMIS GIANT
Fig. 1 Effect estimates for the 95 BMI variants obtained in the PROMIS study (N = 16,157) in comparison to those reported by the GIANT Consortium (Locke et al. [8]) (N = 339,224)
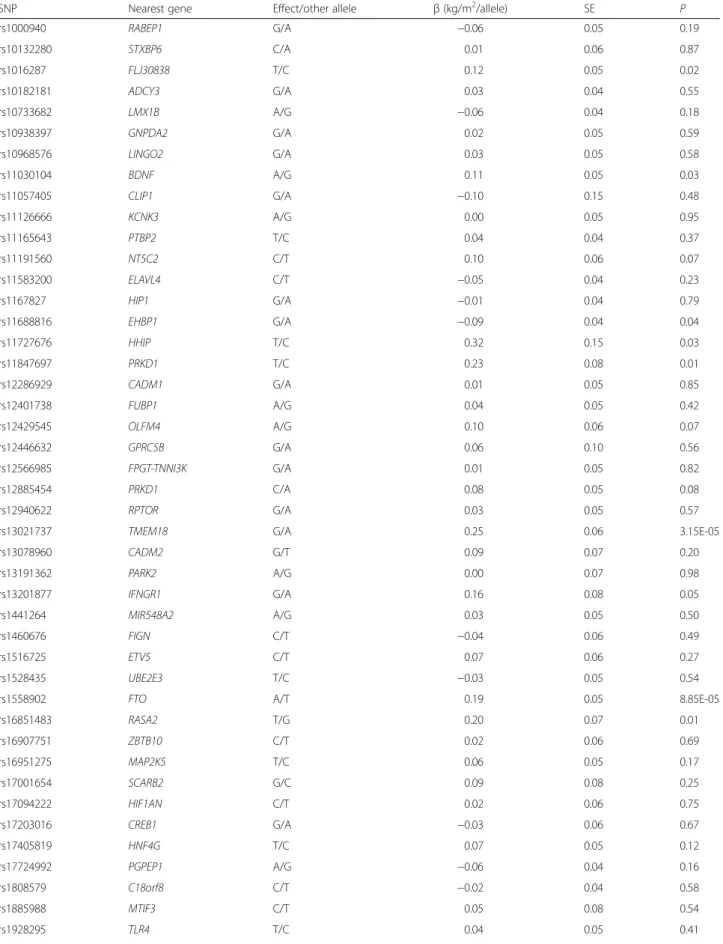
Table 2 Cross-sectional association of 95 BMI associated SNPs on BMI in the total PROMIS cohort (N = 16,157)
SNP Nearest gene Effect/other allele β (kg/m2/allele) SE P
rs1000940 RABEP1 G/A −0.06 0.05 0.19 rs10132280 STXBP6 C/A 0.01 0.06 0.87 rs1016287 FLJ30838 T/C 0.12 0.05 0.02 rs10182181 ADCY3 G/A 0.03 0.04 0.55 rs10733682 LMX1B A/G −0.06 0.04 0.18 rs10938397 GNPDA2 G/A 0.02 0.05 0.59 rs10968576 LINGO2 G/A 0.03 0.05 0.58 rs11030104 BDNF A/G 0.11 0.05 0.03 rs11057405 CLIP1 G/A −0.10 0.15 0.48 rs11126666 KCNK3 A/G 0.00 0.05 0.95 rs11165643 PTBP2 T/C 0.04 0.04 0.37 rs11191560 NT5C2 C/T 0.10 0.06 0.07 rs11583200 ELAVL4 C/T −0.05 0.04 0.23 rs1167827 HIP1 G/A −0.01 0.04 0.79 rs11688816 EHBP1 G/A −0.09 0.04 0.04 rs11727676 HHIP T/C 0.32 0.15 0.03 rs11847697 PRKD1 T/C 0.23 0.08 0.01 rs12286929 CADM1 G/A 0.01 0.05 0.85 rs12401738 FUBP1 A/G 0.04 0.05 0.42 rs12429545 OLFM4 A/G 0.10 0.06 0.07 rs12446632 GPRC5B G/A 0.06 0.10 0.56 rs12566985 FPGT-TNNI3K G/A 0.01 0.05 0.82 rs12885454 PRKD1 C/A 0.08 0.05 0.08 rs12940622 RPTOR G/A 0.03 0.05 0.57
rs13021737 TMEM18 G/A 0.25 0.06 3.15E-05
rs13078960 CADM2 G/T 0.09 0.07 0.20 rs13191362 PARK2 A/G 0.00 0.07 0.98 rs13201877 IFNGR1 G/A 0.16 0.08 0.05 rs1441264 MIR548A2 A/G 0.03 0.05 0.50 rs1460676 FIGN C/T −0.04 0.06 0.49 rs1516725 ETV5 C/T 0.07 0.06 0.27 rs1528435 UBE2E3 T/C −0.03 0.05 0.54
rs1558902 FTO A/T 0.19 0.05 8.85E-05
rs16851483 RASA2 T/G 0.20 0.07 0.01 rs16907751 ZBTB10 C/T 0.02 0.06 0.69 rs16951275 MAP2K5 T/C 0.06 0.05 0.17 rs17001654 SCARB2 G/C 0.09 0.08 0.25 rs17094222 HIF1AN C/T 0.02 0.06 0.75 rs17203016 CREB1 G/A −0.03 0.06 0.67 rs17405819 HNF4G T/C 0.07 0.05 0.12 rs17724992 PGPEP1 A/G −0.06 0.04 0.16 rs1808579 C18orf8 C/T −0.02 0.04 0.58 rs1885988 MTIF3 C/T 0.05 0.08 0.54 rs1928295 TLR4 T/C 0.04 0.05 0.41
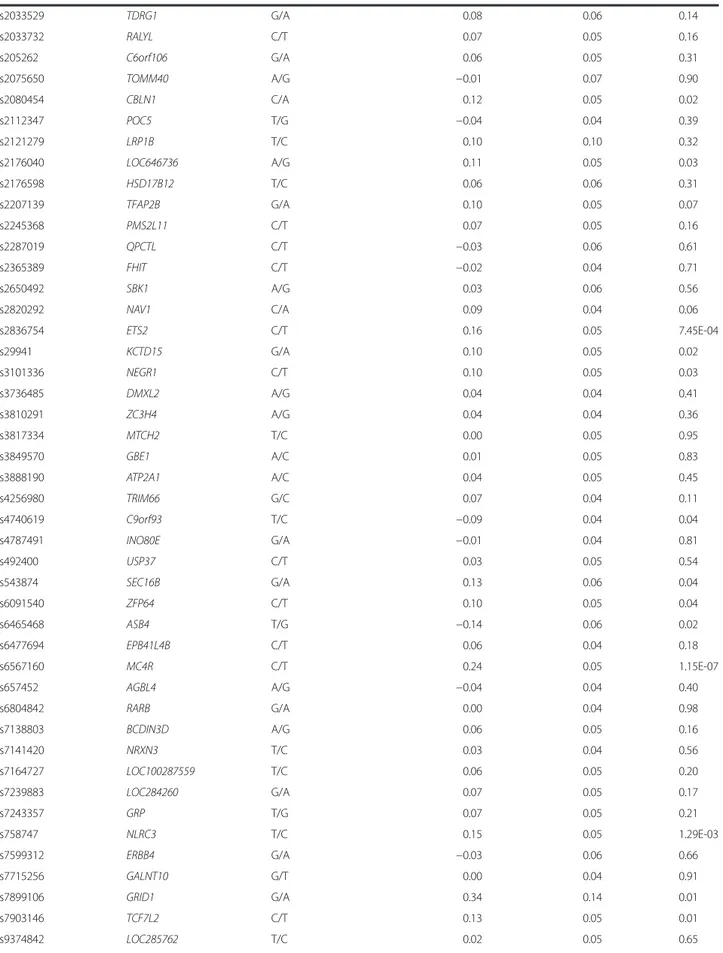
Table 2 Cross-sectional association of 95 BMI associated SNPs on BMI in the total PROMIS cohort (N = 16,157) (Continued) rs2033529 TDRG1 G/A 0.08 0.06 0.14 rs2033732 RALYL C/T 0.07 0.05 0.16 rs205262 C6orf106 G/A 0.06 0.05 0.31 rs2075650 TOMM40 A/G −0.01 0.07 0.90 rs2080454 CBLN1 C/A 0.12 0.05 0.02 rs2112347 POC5 T/G −0.04 0.04 0.39 rs2121279 LRP1B T/C 0.10 0.10 0.32 rs2176040 LOC646736 A/G 0.11 0.05 0.03 rs2176598 HSD17B12 T/C 0.06 0.06 0.31 rs2207139 TFAP2B G/A 0.10 0.05 0.07 rs2245368 PMS2L11 C/T 0.07 0.05 0.16 rs2287019 QPCTL C/T −0.03 0.06 0.61 rs2365389 FHIT C/T −0.02 0.04 0.71 rs2650492 SBK1 A/G 0.03 0.06 0.56 rs2820292 NAV1 C/A 0.09 0.04 0.06 rs2836754 ETS2 C/T 0.16 0.05 7.45E-04 rs29941 KCTD15 G/A 0.10 0.05 0.02 rs3101336 NEGR1 C/T 0.10 0.05 0.03 rs3736485 DMXL2 A/G 0.04 0.04 0.41 rs3810291 ZC3H4 A/G 0.04 0.04 0.36 rs3817334 MTCH2 T/C 0.00 0.05 0.95 rs3849570 GBE1 A/C 0.01 0.05 0.83 rs3888190 ATP2A1 A/C 0.04 0.05 0.45 rs4256980 TRIM66 G/C 0.07 0.04 0.11 rs4740619 C9orf93 T/C −0.09 0.04 0.04 rs4787491 INO80E G/A −0.01 0.04 0.81 rs492400 USP37 C/T 0.03 0.05 0.54 rs543874 SEC16B G/A 0.13 0.06 0.04 rs6091540 ZFP64 C/T 0.10 0.05 0.04 rs6465468 ASB4 T/G −0.14 0.06 0.02 rs6477694 EPB41L4B C/T 0.06 0.04 0.18 rs6567160 MC4R C/T 0.24 0.05 1.15E-07 rs657452 AGBL4 A/G −0.04 0.04 0.40 rs6804842 RARB G/A 0.00 0.04 0.98 rs7138803 BCDIN3D A/G 0.06 0.05 0.16 rs7141420 NRXN3 T/C 0.03 0.04 0.56 rs7164727 LOC100287559 T/C 0.06 0.05 0.20 rs7239883 LOC284260 G/A 0.07 0.05 0.17 rs7243357 GRP T/G 0.07 0.05 0.21 rs758747 NLRC3 T/C 0.15 0.05 1.29E-03 rs7599312 ERBB4 G/A −0.03 0.06 0.66 rs7715256 GALNT10 G/T 0.00 0.04 0.91 rs7899106 GRID1 G/A 0.34 0.14 0.01 rs7903146 TCF7L2 C/T 0.13 0.05 0.01 rs9374842 LOC285762 T/C 0.02 0.05 0.65
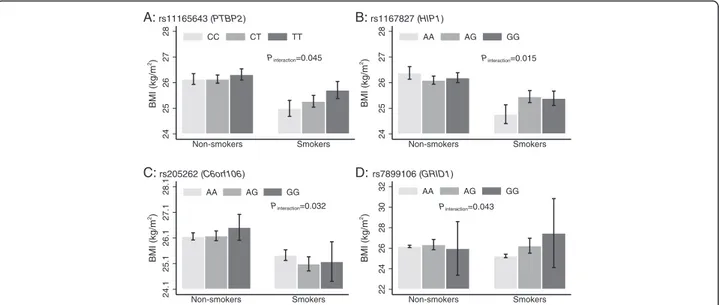
the control sample only. None of these results remained statistically significant after correction for multiple testing (P < 0.00026 = P = 0.05/190 tests). We observed nominally significant SNP x smoking inter-actions for PTBP2 rs11165643 (Pinteraction= 0.045),
HIP1 rs1167827 (Pinteraction= 0.015), C6orf106
rs205262 (Pinteraction= 0.032) and GRID1 rs7899106
(Pinteraction= 0.043) (Fig. 4). In the case of PTBP2
rs11165643, the association of the T-allele on BMI was larger among smokers (β = 0.36 kg/m2
/per allele, SE = 0.12, P-value = 0.002) compared to non-smokers (β = 0.09 kg/m2
/per allele, SE = 0.08, P-value = 0.26). A similar trend of larger effect among smokers com-pared to non-smokers was observed for HIP1 rs1167827 and GRID1 rs7899106 variants. Whereas, the effect of the G-allele at C6orf106 rs205262 on BMI was higher among non-smokers compared to smokers (Additional file 3: Table S2).
We also observed suggestive evidence of interactions between physical activity and theCLIP1 rs11057405 (P in-teraction= 0.014), CADM2 rs13078960 (Pinteraction= 0.037)
and GALNT10 rs7715256 (Pinteraction= 0.048) loci on
BMI (Fig. 5 and Additional file 4: Table S3). There was no evidence of an interaction between the GRS and physical activity or smoking on BMI.
Discussion
We examined genetic associations and gene-lifestyle inter-actions for 95 established obesity-susceptibility variants in relation to BMI in 16,157 Pakistani adults. To our know-ledge, this is the first study examining genetic associations and gene-lifestyle interactions for established obesity-susceptibility loci in an indigenous Pakistani population, and the largest and most comprehensive study of gene-lifestyle interactions conducted in non-European popula-tions to date.
The associations of most (77 %) obesity-susceptibility variants with BMI, although not all statistically signifi-cant, were directionally consistent with findings from European-ancestry populations (Fig. 1). We also ob-served comparable allele frequencies in our population with those reported in the HapMap GIH (Gujarati
Table 2 Cross-sectional association of 95 BMI associated SNPs on BMI in the total PROMIS cohort (N = 16,157) (Continued)
rs9400239 FOXO3 C/T 0.00 0.04 1.00 rs9540493 MIR548X2 A/G 0.06 0.04 0.17 rs9641123 CALCR C/G 0.10 0.05 0.02 rs977747 TAL1 T/G −0.07 0.04 0.13 rs9914578 SMG6 G/C 0.00 0.05 0.92 rs9925964 KAT8 A/G −0.05 0.06 0.41
Analyses were adjusted for age, age2
, sex, MI status, genetic principal components (first 10)
25.4 25.6 25.8 26 26.2 26.4 BMI (kg/m2) 1 2 3 4 5 GRS bmi upperci/lowerci ß±SE= 0.04 ± 0.01 kg/m2 , p= 4.5 x 10⁻¹⁴
Fig. 2 Association of the genetic risk score (GRS) based on 95 BMI-associated SNPs and BMI in the PROMIS Study (N = 16,157). Data represents mean (95 % CI) BMI per quintile of the GRS, adjusted forage, age2, sex, MI status, and principal components
Fig. 3 The discriminative power of different models to predict risk of obesity [BMI (kg/m2)≥27.5 compared with 18.5 kg/m2< BMI < 23 kg/m2]. The area under the receiver operating characteristic curve (ROC AUC) is investigated: Model 1 = age, age2, sex and case status; model 2 = all 95 single nucleotide polymorphisms; model 3 = model 1 + model 2
Indians in Houston, USA) population. The GIH is a population emanating from the western Indian state of Gujarat who migrated to Houston, Texas. The distribu-tion of the allele frequencies of most of the variants (83 out of 95) in this Pakistani population was also compar-able to that reported in populations of European origin [8], reflecting similar linkage disequilibrium patterns in the Pakistani and European genomes.
The MC4R (rs6567160) and TMEM18 (rs13021737) loci showed the strongest associations (lowest P-values)
with BMI (0.24 and 0.25 kg/m2higher BMI per risk al-lele withP = 1.1 × 10−07 and P = 3.1 × 10−05, respectively) in this study. We observed nominal interactions with smoking for the PTBP2 rs11165643, HIP1 rs1167827, C6orf106 rs205262 and GRID1 rs7899106 on BMI. We also observed nominal interactions of physical activity with CLIP1 rs11583200, CADM2 rs13078960 and GALNT10 rs7715256 on BMI. None of these interaction effects remained statistically significant after Bonferroni correction for multiple testing; hence these results
24 25 26 27 28 BMI (kg/m 2) Non-smokers Smokers CC CT TT Pinteraction=0.045 A: rs11165643 (PTBP2) 24 25 26 27 28 BMI (kg/m 2) Non-smokers Smokers AA AG GG Pinteraction=0.015 B: rs1167827 (HIP1) 24.1 25.1 26.1 27.1 28.1 BMI (kg/m 2) Non-smokers Smokers AA AG GG Pinteraction=0.032 C: rs205262 (C6orf106) 22 24 26 28 30 32 BMI (kg/m 2) Non-smokers Smokers AA AG GG Pinteraction=0.043 D: rs7899106 (GRID1)
Fig. 4 Association of PTBP2 rs11165643 (a), HIP1 rs1167827 (b), C6orf106 rs205262 (c) and GRID1 rs7899106 (d), on BMI stratified by smoking status in control participants (N = 8219) from PROMIS
24
26
28
BMI (kg/m
2)
Inactive Moderate Active
AA_AG GG Pinteraction= 0.014
A
: rs11057405 (CLIP1) 23 25 27 29 BMI (kg/m 2)Inactive Moderate Active
TT TG GG Pinteraction=0.037
B
: rs13078960 (CADM2) 24 26 28 BMI (kg/m 2)Inactive Moderate Active
TT TG GG Pinteraction=0.048
C
: rs7715256 (GALNT10)Fig. 5 Association between CLIP1 rs11057405 (a) CADM2 rs13078960 (b) and GALNT10 rs7715256 (c) on BMI stratified by physical activity in control participants (N = 6784) from PROMIS. For CLIP1 rs11057405 variant, there were only N = 7 participants are in the “active” physical activity group, so participants having genotype“AA” and “AG” were combined for the Fig. 5a
should be viewed purely as hypothesis generating and ones that will benefit from further scrutiny in independ-ent cohorts and settings. Although in previous studies of European-ancestry populations, it has been reported that physical activity can attenuate the genetic predisposition conveyed by FTO variants [9–13], no such interactions were evident within the PROMIS cohort, which suggests that the observations reported elsewhere might be population-specific or attributable to confounding fac-tors that are absent in this indigenous Pakistani cohort.
CLIP1 encodes a protein called CAP-GLY domain con-taining linker protein 1, which secures endocytic vesicles to microtubules, playing a potentially important role in athero-sclerosis via LDL transportation and in a range of cancers including Hodgkin’s lymphoma and anaplastic large cell lymphoma [20].CLIP1 is also a target of the cellular energy-sensing enzyme AMPK [21, 22], but no studies have been published to our knowledge relating this locus to energy homeostasis, exercise, smoking or diet. Cell adhesion mole-cules 2 (CADM2) gene which is also called Necl-3, IGSF4D orSynCAM 2, involves in cell aggregation and organization of functional synapses through heterophilic adhesion [23]. It has been shown thatCADM2 is expressed in nervous sys-tem of zebra fish [24], implicating that theCADM2 is a con-served evolutionarily gene and may be implicated in various physiological processes related to obesity in humans. GALNT10 (polypeptide N-acetylgalactosaminyltransferase 10) are post-translational modification of secreted and membrane-associated proteins and has important role in normal development of cellular processes [25]. PTBP2 (polypyrimidine tract binding protein 2) is an intensely studied RNA binding protein involved in several post -tran-scriptional regulatory events of gene expression including exon splicing. High levels of expression of PTBP2 gene is observed in adult brain and muscles which implicate its role in the physiology of cardiometabolic phenotypes [26]. Huntingtin interacting protein 1 (HIP1) is a component of clathrin coats which is involved in the binding to mem-brane phospholipids and these properties contribute to their ability to stimulate clathrin assembly at specific sites on the plasma membrane [27].
A strong cumulative effect of the 95 variants on obes-ity was also noted, with each additional risk allele corre-sponding to approximately 0.04 kg/m2 units, or 115 g for a person 1.70 m tall, which under a non-epistatic additive genetic model amounts to an estimated differ-ence in weight of ~4.2 kg for persons 1.70 m tall at the 75 % vs 25 % percentile of the risk allele distribution. Combined, the 95 SNPs explained 1.54 % of the pheno-typic variance in BMI suggests that many common vari-ants having small effects, with the vast majority of the heritable variance yet to be explained [7, 28].
Consistent with the findings that these SNPs explain a small proportion of variation in BMI, the 95 SNPs
combined had litle discriminative power (the ROC AUC for the model including only these 95 variants was 0.590), although adding these 95 SNPs to a model in-cluding age, age2, sex and case/control status did sig-nificantly (p < 0.0001) improve the discriminative ability of the model (Fig. 3). Li et al. [29] studied 12 of the 95 BMI susceptibility variants examined here and reported similar findings. Sandholt et al. [30] reported that the ROC AUC for 20 BMI-associated SNPs for the risk of overweight and obesity was 0.53 and 0.58. These results suggests that currently available genetic information for obesity have little discriminative ability and are too weak for clinical utility.
Our study is limited by the use of self-reported lifestyle data, which was obtained in cases soon after an MI had occurred; in principle, self-reported data for lifestyle habits that are known in the Pakistani population to be associ-ated with cardiovascular disease (such as smoking), may be prone to bias. To address this limitation, we performed analyses stratified by case and control cohorts, as well as in both combined; however, results were largely consistent between groups, suggesting that bias of this nature is un-likely to have impacted our results to a meaningful degree (results not shown). A further important limitation of this study is that with many statistical comparisons performed some of our nominally significant associations are likely to be false positive. However, because many of our analyses are replication tests, for which a Bonferroni correction is likely to be overly conservative, we elected to present the number of tests performed alongside their nominal P-values so that the reader can determine for themselves the value of these findings.
Conclusions
In conclusion, most common genetic variants for BMI identified through GWAS in Europeans have small and dir-ectionally consistent effects on obesity risk in this Pakistani population, with theMC4R and TEMEM18 loci conveying the largest effects. Smoking and physical activity may mod-ify the genetic predisposition to obesity at numerous loci in Pakistanis, but replication and extension of these findings into other South Asian populations is needed.
Availability of data and materials
“The raw data are not publicly available owing to the study’s data access policies. However, analyses in the PROMIS dataset can be requested by contacting the cor-responding author”.
Additional files
Additional file 1: Table S1. Quality control descriptive of 95 BMI associated SNPs in the PROMIS Cohort (N = 16,157). (DOCX 52 kb)
Additional file 2: Table S4. Quality control information for the included SNPs (95 published BMI-associated) that were directly genotyped and also the imputed data of the SNPs for which imputation was performed in the PROMIS Cohort (N = 16,157). (DOCX 22 kb) Additional file 3: Table S2. Associations of the 95 SNPs on BMI by different strata of smoking (non-smokers vs current smokers) in control participants from PROMIS (N = 8219). (DOCX 43 kb)
Additional file 4: Table S3. Association of individual 95 SNPs with different strata of physical activity on BMI in control (N = 6784) participants from PROMIS. (DOCX 53 kb)
Competing interest
The authors declare that there is no competing interest associated with this manuscript. Dr. Danish Saleheen has received grant from Pfizer but it has no effect on the integrity or interpretation of the research data reported herein.
Authors’ contributions
SA, WZ, FR, PWF and DS analyzed and interpreted the data, and drafted the manuscript. SA, WZ, FR, PWF and DS contributed to the conception and design of the study. All authors including SA, WZ, FR, AR, MS, MZ, NS, NYM, KSZ, MI, SZR, FM, BH, MSL, FA, SUK, PF, PWF and DS contributed to the interpretation of data, critical review and approved the final version of manuscript to be published.
Acknowledgements
We acknowledge the helpful comments provided on a draft of this manuscript by John Danesh at the University of Cambridge, UK. Authors also thank to the study participants. Genotyping for this study was funded by the Wellcome Trust, UK and Pfizer. Biomarker studies were supported by grants from the Fogarty International Center and the National Heart, Lung and Blood Institute. Danish Saleheen has received funding from the National Institutes of Health, the Fogarty International, the Wellcome Trust, the British Heart Foundation and Pfizer. Fieldwork in PROMIS was supported by funds available to investigators at the Center for Non-Communicable Diseases, Pakistan and at the University of Cambridge, UK. Shafqat Ahmad has received research and travel grants from the Swedish Heart-Lung Foundation, Swedish Society for Medical Research, and Knut and Alice Wallenberg Foundation, Sweden. Paul Franks has received research grants from the Novo Nordisk, the Swedish Research Council, the Swedish Heart Lung Foundation, and the Skåne Health Authority.
Author details 1
Genetic and Molecular Epidemiology Unit, Lund University Diabetes Centre, Department of Clinical Sciences, Lund University, Malmö, Sweden.2Perelman School of Medicine at the University of Pennsylvania, Philadelphia, PA, USA. 3Center for Non-Communicable Diseases Pakistan, Karachi, Pakistan. 4
Department of Pharmacy, COMSATS Institute of Information Technology, Abbottabad, Pakistan.5Punjab Institute of Cardiology, Lahore, Pakistan. 6
National Institute of Cardiovascular Diseases, Karachi, Pakistan.7Karachi Institute of Heart Diseases, Karachi, Pakistan.8Red Crescent Institute of Cardiology, Hyderabad, Karachi, Pakistan.9Tabba Heart Institute, Karachi, Pakistan.10Department of Cardiology, Liaquat National Hospital, Karachi, Pakistan.11Department of Microbiology, University of Karachi, Karachi, Pakistan.12Nazarbayev University, Astana, Kazakhstan.13Department of Public Health and Clinical Medicine, Section for Medicine, Umeå University, Umeå, Sweden.14Department of Nutrition, Harvard School of Public Health, Boston, MA, USA.15Department of Biostatistics and Epidemiology, University of Pennsylvania, Philadelphia, PA, USA.
Received: 22 July 2015 Accepted: 5 December 2015
References
1. Hubert HB, Feinleib M, McNamara PM, Castelli WP. Obesity as an independent risk factor for cardiovascular disease: a 26-year follow-up of participants in the Framingham Heart Study. Circulation. 1983;67(5):968–77. 2. Pischon T, Boeing H, Hoffmann K, Bergmann M, Schulze MB, Overvad K, et al. General and abdominal adiposity and risk of death in Europe. N Engl J Med. 2008;359(20):2105–20. doi:10.1056/NEJMoa0801891.
3. Sullivan PW, Morrato EH, Ghushchyan V, Wyatt HR, Hill JO. Obesity, inactivity, and the prevalence of diabetes and diabetes-related cardiovascular comorbidities in the U.S., 2000–2002. Diabetes Care. 2005;28(7):1599–603. 4. Zhou ZY, Liu YK, Chen HL, Liu F. Body mass index and knee osteoarthritis risk: a dose–response meta-analysis. Obesity (Silver Spring). 2014;22(10): 2180–5. doi:10.1002/oby.20835.
5. Ng M, Fleming T, Robinson M, Thomson B, Graetz N, Margono C, et al. Global, regional, and national prevalence of overweight and obesity in children and adults during 1980–2013: a systematic analysis for the Global Burden of Disease Study 2013. Lancet. 2014;384(9945):766–81. doi:10.1016/ S0140-6736(14)60460-8.
6. World Health Organization. Obesity: preventing and managing the global epidemic. Report of a
WHO consultation. World Health Organization technical report series. 2000;894(i-xii):1–253.
7. Bell CG, Walley AJ, Froguel P. The genetics of human obesity. Nat Rev Genet. 2005;6(3):221–34. doi:10.1038/nrg1556.
8. Locke AE, Kahali B, Berndt SI, Justice AE, Pers TH, Day FR, et al. Genetic studies of body mass index yield new insights for obesity biology. Nature. 2015;518(7538):197–206. doi:10.1038/nature14177.
9. Ahmad S, Rukh G, Varga TV, Ali A, Kurbasic A, Shungin D, et al. Gene x physical activity interactions in obesity: combined analysis of 111,421 individuals of European ancestry. PLoS Genet. 2013;9(7):e1003607. doi:10.1371/journal.pgen.1003607.
10. Ahmad T, Lee IM, Pare G, Chasman DI, Rose L, Ridker PM, et al. Lifestyle interaction with fat mass and obesity-associated (FTO) genotype and risk of obesity in apparently healthy U.S. women. Diabetes Care. 2011;34(3):675–80. doi:10.2337/dc10-0948.
11. Andreasen CH, Stender-Petersen KL, Mogensen MS, Torekov SS, Wegner L, Andersen G, et al. Low physical activity accentuates the effect of the FTO rs9939609 polymorphism on body fat accumulation. Diabetes. 2008;57(1): 95–101. doi:10.2337/db07-0910.
12. Franks PW, Jablonski KA, Delahanty LM, McAteer JB, Kahn SE, Knowler WC, et al. Assessing gene-treatment interactions at the FTO and INSIG2 loci on obesity-related traits in the Diabetes Prevention Program. Diabetologia. 2008;51(12):2214–23. doi:10.1007/s00125-008-1158-x.
13. Kilpelainen TO, Qi L, Brage S, Sharp SJ, Sonestedt E, Demerath E, et al. Physical activity attenuates the influence of FTO variants on obesity risk: a meta-analysis of 218,166 adults and 19,268 children. PLoS Med. 2011;8(11):e1001116. doi:10.1371/journal.pmed.1001116.
14. Li S, Zhao JH, Luan J, Ekelund U, Luben RN, Khaw KT, et al. Physical activity attenuates the genetic predisposition to obesity in 20,000 men and women from EPIC-Norfolk prospective population study. PLoS Med. 2010;7:8. doi:10.1371/journal.pmed.1000332.
15. Qi Q, Li Y, Chomistek AK, Kang JH, Curhan GC, Pasquale LR, et al. Television watching, leisure-time physical activity and the genetic predisposition in relation to body mass index in women and men. Circulation. 2012;126(15): 1821–7. doi:10.1161/circulationaha.112.098061.
16. Saleheen D, Zaidi M, Rasheed A, Ahmad U, Hakeem A, Murtaza M, et al. The Pakistan Risk of Myocardial Infarction Study: a resource for the study of genetic, lifestyle and other determinants of myocardial infarction in South Asia. Eur J Epidemiol. 2009;24(6):329–38. doi:10.1007/s10654-009-9334-y. 17. Saleheen D, Alexander M, Rasheed A, Wormser D, Soranzo N, Hammond N, et al.
Association of the 9p21.3 locus with risk of first-ever myocardial infarction in Pakistanis: case–control study in South Asia and updated meta-analysis of Europeans. Arterioscler Thromb Vasc Biol. 2010;30(7):1467–73. doi:10.1161/ ATVBAHA.109.197210.
18. Kooner JS, Saleheen D, Sim X, Sehmi J, Zhang W, Frossard P, et al. Genome-wide association study in individuals of South Asian ancestry identifies six new type 2 diabetes susceptibility loci. Nat Genet. 2011;43(10):984–9. doi:10.1038/ng.921. 19. WHO Expert Consultation. Appropriate body-mass index for Asian
populations and its implications
for policy and intervention strategies. Lancet. 2004;363(9403):157–63. doi:10.1016/S0140-6736(03)15268-3.
20. Delabie J, Shipman R, Bruggen J, De Strooper B, van Leuven F, Tarcsay L, et al. Expression of the novel intermediate filament-associated protein restin in Hodgkin’s disease and anaplastic large-cell lymphoma. Blood. 1992;80(11):2891–6.
21. Nakano A, Takashima S. LKB1 and AMP-activated protein kinase: regulators of cell polarity. Genes Cells. 2012;17(9):737–47. doi:10.1111/j.1365-2443.2012. 01629.x.
22. Nakano A, Kato H, Watanabe T, Min KD, Yamazaki S, Asano Y, et al. AMPK controls the speed of microtubule polymerization and directional cell migration through CLIP-170 phosphorylation. Nat Cell Biol. 2010;12(6):583–90. doi:10.1038/ncb2060.
23. Chang G, Xu S, Dhir R, Chandran U, O’Keefe DS, Greenberg NM, et al. Hypoexpression and epigenetic regulation of candidate tumor suppressor gene CADM-2 in human prostate cancer. Clin Cancer Res. 2010;16(22):5390–401. doi:10.1158/1078-0432.CCR-10-1461.
24. Pietri T, Easley-Neal C, Wilson C, Washbourne P. Six cadm/SynCAM genes are expressed in the nervous system of developing zebrafish. Dev Dyn. 2008;237(1):233–46. doi:10.1002/dvdy.21397.
25. Perrine CL, Ganguli A, Wu P, Bertozzi CR, Fritz TA, Raman J, et al. Glycopeptide-preferring polypeptide GalNAc transferase 10 (ppGalNAc T10), involved in mucin-type O-glycosylation, has a unique GalNAc-O-Ser/Thr-binding site in its catalytic domain not found in ppGalNAc T1 or T2. J Biol Chem. 2009;284(30):20387–97. doi:10.1074/jbc.M109.017236. 26. Romanelli MG, Diani E, Lievens PM. New insights into functional roles of the
polypyrimidine tract-binding protein. Int J Mol Sci. 2013;14(11):22906–32. doi:10.3390/ijms141122906.
27. Legendre-Guillemin V, Metzler M, Lemaire JF, Philie J, Gan L, Hayden MR, et al. Huntingtin interacting protein 1 (HIP1) regulates clathrin assembly through direct binding to the regulatory region of the clathrin light chain. J Biol Chem. 2005;280(7):6101–8. doi:10.1074/jbc.M408430200.
28. Maes HH, Neale MC, Eaves LJ. Genetic and environmental factors in relative body weight and human adiposity. Behav Genet. 1997;27(4):325–51. 29. Li S, Zhao JH, Luan J, Luben RN, Rodwell SA, Khaw KT, et al. Cumulative
effects and predictive value of common obesity-susceptibility variants identified by genome-wide association studies. Am J Clin Nutr. 2010;91(1): 184–90. doi:10.3945/ajcn.2009.28403.
30. Sandholt CH, Sparso T, Grarup N, Albrechtsen A, Almind K, Hansen L, et al. Combined analyses of 20 common obesity susceptibility variants. Diabetes. 2010;59(7):1667–73. doi:10.2337/db09-1042.
• We accept pre-submission inquiries
• Our selector tool helps you to find the most relevant journal • We provide round the clock customer support
• Convenient online submission • Thorough peer review
• Inclusion in PubMed and all major indexing services • Maximum visibility for your research
Submit your manuscript at www.biomedcentral.com/submit