Preprint
This is the submitted version of a paper presented at 1st Annual Eastern Africa Business and Economic
Watch Conference, Finance and Management Research in Eastern Africa Kigali, Rwanda. 5-7 May 2015.
Citation for the original published paper: Ndikubwimana, P., Berndt, A. (2015)
Financial service and customer satisfaction in commercial banks in Rwanda (Bank of Kigali). In:
N.B. When citing this work, cite the original published paper.
Permanent link to this version:
FINANCIAL SERVICE AND CUSTOMER SATISFACTION IN COMMERCIAL BANKS IN RWANDA (BANK OF KIGALI)
Mr. NDIKUBWIMANA Philippe Dr. Adele Berndt (Associate Professor)
Keywords: Financial service, service quality, service quality dimensions, customer satisfaction
1. INTRODUCTION
With globalization and fierce competition, many organizations are putting effort into sustaining and retaining a reliable customer base. In other words, they want to achieve service quality and customer satisfaction since these two concepts are at the heart of any organization‟s development and are the ultimate goals of every service provider. Many financial organizations are competing to increase their customer satisfaction and loyalty through improved service quality (Bloemer et al., 1998; Jamal and Naser, 2002; Lassar et al., 2000; Levesque and McDouglas, 1996; Zhou, 2004).
The financial services are trade and industry services provided by the finance industry, which includes different types of institutions that manage money for economic development. Besides, commercial banks as a financial institution, like many other service providers have discovered that increasing customer retention can have a substantial impact on profits. (Spreng et al., 1996; Culiberg and Rojšek, 2010). Consequently, they are changing the way they conduct business and adopt new strategies with regard to customers‟ needs and wants by introducing new financial services.
These banks, like any other businesses, in order to survive in this highly competitive world, have to ensure their customers are happy with the services and products they offer them. The more the customers are happy, the more they will tend to remain loyal, and consequently, the more the bank will have more solid ground for growth and expansion.
Some of the strategies to secure customer satisfaction are: the quality of the product or service, the quality of service delivery (good customer care), and innovation. And to become a successful innovator, Uddinet al., (2014) advise that one should have a good understanding of the customer‟s needs (wants and expectations of customers).
The introduction of these services in Rwandan banking industry has brought speed in the banking system and is playing a major role in economic growth and development (Ministry of Finance and Economic Planning, 2000). Empirical data from a study directed in 2009 by the Institute of Policy Analysis and Research-Rwanda (IPAR) which was based on different business sectors (tourism, transportation, financial institutions, immigration and water), service delivery in many private and public institutions in Rwanda was ranked low compared to their colleagues in the East African Community (Lwakabamba, 2009).
To survive in the competitive banking industry, banks have to develop new strategies which will satisfy their customers (Siddiqi, 2011). We can also hypothesize that offering quality services through new technologies will be very instrumental in securing customers‟ satisfaction, even if this is just one factor among many.
1.1. Statement of the problem
According to report done by Ecobank (2013), the ownership of bank accounts and penetration of banking services still remains low in Rwanda, compared to that of other emerging markets, including its East Africa peers. The survey conducted by FinMark Trust in 2008 showed that in general, only 14 percent of the active population use banks, 7% use Microfinance Finance Institutions, 26% are informally served and 52% are financially excluded. The ratio of total banking sector assets to GDP was approximately 22% in Rwanda in 2010 as compared to 66% and 33% in neighbouring Kenya and Uganda, respectively, implying significant possibilities for banking sector growth in Rwanda (Ecobank report, 2013). This low level of penetration of banking services and products impacts negatively on the consumers‟ access to services offered by the banks. Consequently, the customers‟ needs and wants are not met.
In 2005, the World Bank and IMF conducted an in-depth analysis of Rwanda‟s financial sector under the Financial Sector Assessment Program (FSAP), which concluded it was relatively shallow, undiversified, dominated by an oligopolistic banking sector, and characterized by relatively high lending rates, extremely low insurance penetration, and a scarcity of long-term debt, home mortgage financing and equity capital. There was also a virtual absence of regulation and supervision of pensions and insurance, and a poorly functioning payments system.
According to AFI (2014), banks‟ customers in Rwanda are facing a number of other barriers to financial services access, including:
i. Low financial literacy: Lack of awareness of financial services and other financial benefits offered by traditional financial institutions.
ii. Out-dated payment systems: Most people rely on bank books and checks.
iii. Inadequate financial products and service: Financial institutions don‟t offer products designed specifically to meet the needs of the poor.
iv. Lack of appropriate delivery models for financial services that promote financial inclusion.
v. Weak linkages between big banks and small Savings and Credits Cooperatives (SACCOs) in rural areas.
In an effort to bridge the financial services access gap and encourage local people to use formal financial institutions to save money and take out loans, the Government of Rwanda began providing assistance to establish a SACCO in every Umurenge (administrative sector) in the country; the Rwandan banking industry introduced also new financial services and products (financial innovative services), as one of the strategies to increase service delivery and customer satisfaction. This resulted in increase in the number of people who could access banking services. However, the Bank of Kigali Prospectus (2011) shows that, in recent times, “the banking activities of the clients have been reduced. The same report indicated that customers expressed challenges with transaction turnaround times and there is still much further to go to meet customers‟ expectations”.
Bank of Kigali (BK, 2014) reported that the number of its customers had increased from 6336 in 2005 to 336153 in 2011. But by 2014 the number of customers had decreased by 50% (111333 customers).
According the Chief Operations Officer (COO) of the Bank of Kigali, Lawson Naibo, “we have got a significant number of unbanked in Rwanda but also under banked, you find that even customers who have got the bank accounts do not get the right service; if you look at people with bank accounts; very few have got savings accounts”, (the New Times, 10th December 2010).
There is need to bridge the gap between service delivery and translation of customers‟ perceptions into reality (Nsengiyumva and Habumuremyi, 2009).
Furthermore, the research done by Nsengiyumva & Habumuremyi(2009); Joseph et al., (2008); Egyeyu (2010) and Lukwiya (2011), revealed that the customers complain of in
adequacy of services in the use of the banking system such as break downs of ATMs, long queues at ATM service points, retention of customers‟ cards by ATM machine, limited knowledge on the use of ATM cards, fraudulent transactions and ATM operation in just a few languages, lack of connection.
1.2. Research purpose
Rwanda has seen an increase in the number of adults having access to financial services from 21% in 2008 to 42% in 2012 (Ecobank, 2013). For commercial banks, this translates into consumers with varying expectations and perceptions of services in turn impacting their satisfactions with the financial services received. The purpose of this research is to investigate the satisfaction of banking customers in Rwanda with regard to financial services received.
In regard to the above, it is necessary to investigate the level at which the customers are satisfied with the financial services they are given by commercial banks in Rwanda becomes imperative. So far, little research has been done in Rwanda on the perception and satisfaction of customers with regard to financial services offered by commercial banks (Ecobank 2013). The researcher chose one among the largest Rwandan bank as the focus for this study. It is the leading bank in Rwanda in terms of assets, deposit, loans and shareholders‟ equity (BNR, 2014). The problem is that with more customers, BK needs to make sure customers are satisfied. But are they satisfied?
1.3. Research questions
The general hypothesis of this research to be tested is as follow: financial services given by the bank positively and significantly determine customers‟ satisfaction. There is a strong relationship between service quality dimensions and customer satisfaction in financial banking services. The leading bank provides financial services that meet customers‟ perceptions and expectations.
For this study, the following research questions have been formulated:
1. What are perceptions of customers with regard to financial banking services received?
2. Is there a relationship between service quality dimensions and customer satisfaction in financial banking services?
2. BANKING IN RWANDA
2.1 Brief history of the banking sector in Rwanda
The Rwandan financial sector started with the creation of the Central Bank, National Bank of Rwanda in April 1964. According to Dushimyumukiza (2010), before the genocide of 1994, the development of the financial sector in Rwanda was weak: only three commercial banks and two specialized banks operated with a total of less than twenty branches in the country, and one microfinance (UBPR) with around one hundred forty six branches. The genocide negatively affected the development of the banking sector and almost both physical and human capital of all banks was destroyed during the genocide. (Alson et al, 2001).
After the genocide the number of banks has increased, where in 2002 there were six commercial banks with twenty eight branches, two specialized banks and one union of financial institutions (UBPR) with one hundred forty eight branches (NBR, 2004). In 2007, commercial banks operated 38 branches, making only 7 % of all branches of financial institutions. By the end of 2008, 8 commercial banks, 2 specialized banks and 1 Microfinance bank were operating. At the end of 2012, the Rwanda‟s banking sector was composed of nine commercial licensed banks, three micro-finance banks, one development bank, and one co-operative bank (Ecobank, 2013).
During this time, the Rwandan financial services industry experienced important development, as economic strength and growth increased employment rates and the purchasing power of the Rwandan population, and this lead to more penetration of financial products and services. Although the number of adults benefiting from banking services was still relatively low (58%) in 2008, this figure rose up to 72% four years later (Ecobank report, 2013). According to BNR (2010), it is expected that banking penetration will continue to increase as a result of a relatively stable macroeconomic environment and continued economic growth.
2.2 Brief description of the Bank that is the focus of the study
Bank of Kigali LTD has its headquarter in the heart of Kigali city. By the end of May 2013 BK had 57 branches operating within Kigali city and across the country and 47 ATMs (BK prospectus, 2014).
Bank of Kigali is the leading bank in Rwanda in terms of assets, deposits, loans and shareholders‟ equity. The Bank is also the most profitable bank in Rwanda, accounting for above 50% of the total banking sector profits in each of the last three financial years. The bank is represented in all provinces and all major economic districts in Rwanda. As of 31 December 2010, the Bank had, after BPR, the second largest branch network in the country with 33 branches (Ecobank, 2013)
Founded in 1966 as a joint venture between Belgolaise S.A. and the Government of Rwanda, it is now a dominant player in the Rwandan banking sector and is widely regarded as a reliable financial institution with a highly recognised brand and strong reputation for customer focus, outstanding service and robust balance sheet.
The bank has expanded its service delivery channels and developed an array of products that ensure that customers have access to its services twenty four hours a day, seven days a week. Diverse technological driven alternative delivery channels by introducing mobile vans dubbed mobibank to serve five provinces of Rwanda and all the bank‟s ATMs and Point of Sales accept international cards (The New Times, 2013).
3. SERVICE QUALITY AND CUSTOMER SATISFACTION 3.1. Customer Satisfaction
In general, satisfaction is a person‟s feelings of pleasure or disappointment that result from comparing a product‟s or service‟s perceived performance or outcome to the expectation (Oliver, 2006). If the performance falls short of expectations, the customer is dissatisfied. If the performance matches the expectations the customer is satisfied. If the performance exceeds expectations, the customer is highly satisfied and delighted (Fournier & Mick 1999 cited in Rahman, 2014).
The concept of customer satisfaction occupies a central position in business relationships. Many have defined with reference to the customer‟s prior expectations. For instance, Cacioppo (2000) defines it as the state of mind that customers have about a company when their expectations have been met or exceeded over the lifetime of the product or service. One
can be satisfied by a product and service received, or by the company that offered it, when that product and service, or the provider, has met one‟s prior expectations. Therefore, a high level of service quality is considered as one of the most important determinant in explaining customer satisfaction, which in turn, influences on customer loyalty towards the firm (Oliva et al., 1992). That is why, in today‟s high competitive business environment, achieving success will greatly depend on customer satisfaction.
3.2 Determinants of customer satisfaction
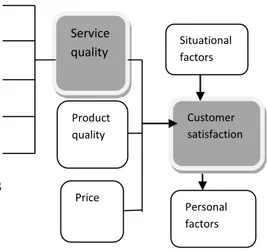
According to Zeithaml et al (2006), customer satisfaction is determined by specific services or products, perceptions of service and product quality, and price. Some other factors like personal and situational factors may influence also customer satisfaction. Although it is stated that other factors such as price and product quality can affect customer satisfaction, perceived service quality is an important component of customer satisfaction (Zeithaml & Bitner, 2003).
Arasli et al., (2005) pointed out that service quality is the result of the comparison made by customers about what they feel service firms should offer, and perceptions of the performance of firms providing the services. Customer‟s expectation serves as a foundation for evaluating service quality because, quality is high when performance exceeds expectation and quality is low when performance does not meet their expectation (Athanassopoulos et al., 2001; Sureshchandar et al., 2001).Empirical studies show that the quality of service offered is related to overall satisfaction of the customer.
Service quality is considered an important tool for a firm„s struggle to differentiate itself from its competitors (Ladhati, 2008). It is also an important tool to measure customer satisfaction (Hazlina et al., 2011). According to several researchers such as Newmna (2001), and others, service quality is a function of the customer‟s expectations (what he/she expects the organisation should offer him/her) and what he/she really get and how he/she feels about it. In order to measure the customer‟s perceptions of the service received. Parasuranaman, et al, 1985 has developed and instrument called SERVIQUAL It compares the customer‟s initial expectations and his/her perceptions of the service (or product) received.
According to the same author, service quality can be analysed into five dimensions which are: reliability, responsiveness, assurance, empathy, and tangibles. Service quality is a focused evaluation that reflects the customer‟s perception of reliability, assurance, responsiveness, empathy and tangibility, while satisfaction is more inclusive and it is
influenced by perceptions of service quality, product price and quality, also situational factors and personal factors (Zeithaml et al., 2008).
The relationship between service quality and customer satisfaction is summarised in the diagram below: Reliability Responsiveness Assurance Empathy Tangibles
Figure 1: Model of customer perceptions of quality and customer satisfaction adapted from (Zeithaml et al., 2006)
The above figure shows that customer satisfaction is linked to the quality of services offered and customer perceptions of services quality is measured by five dimensions.
These five dimensions of perceived quality are also the basis upon which expected quality is built. Once the customer chooses a commercial bank, he or she already possesses in mind a sort of ideal service that combines his or her expectations. This ideal service is the index used to evaluate service quality in terms of confirmation/disconfirmation. The expected quality is built upon the quality aspects that the customer considers to be important. Not all of the dimensions will have equal importance when a judgment of satisfaction is finally made. Some will have high priority, others will be of marginal importance, and will of course vary from customer to customer, as well as over time, and upon the occasion for the same customer (Sulieman,2011).
In addition to service quality, other researchers (namely Zeithaml and Btner, 2008) have identified that customer satisfaction is also determined by other factors such as customer specific and situational factor. Given the time and scope this study, our focus will be on the 5 dimensions above of service quality as determinants of customer satisfaction.
Service quality Product quality Price Situational factors Customer satisfaction Personal factors
Reliability is the ability of the service provider to perform the promised service dependably and accurately (Zeithaml et al., 2006).
Responsiveness reflects of the willingness to help customers and provide prompt service (Zeithaml et al., 2006). Responsiveness is the timely reaction towards the customers' needs or willingness to provide timely services to customers. In context of the Bank, this refers to the changes that have been observed in financial service like introduction of electronic banking, mobile banking, and ATM services in order to respond to the needs of customers. Assurance quality is a knowledge and courtesy of employees and their ability to inspire trust and convey confidence among customers.
Empathy is a quality which is the last dimension on SERVQUAL model. It is the ability to be approachable, and giving individual attention to the customers (Zeithaml et al., 2009).
Tangibility is a concept that measures how dependable a customer views a service provider to be based upon the quality of its most visible attributes (Zeithaml et al., 2006).
3.3 Measuring satisfaction and service quality 3.3.1 Measurement of satisfaction
The fundamental measurement of the satisfaction process is the comparison of what was expected with the product or service‟s performance – this process has traditionally been described as the „confirmation / disconfirmation‟ process (Vavra, 1997). First, customers would form expectations prior to purchasing a product or service. Second, consumption of or experience with the product or service produces a level of perceived quality that is influenced by expectations (Oliver, 1980).
“If perceived performance is only slightly less than expected performance, assimilation will occur, perceived performance will be adjusted upward to equal expectations. If perceived performance lags expectations substantially, contrast will occur, and the shortfall in the perceived performance will be exaggerated” (Vavra, 1997).
Performance exceeds expectations, satisfaction increases, but at a decreasing rate. As perceived performance falls short of expectations, the disconfirmation is more.
Satisfaction can be determined by subjective (e.g. customer needs, emotions) and objective factors (e.g. product and service features). Service quality and customer satisfaction are
distinct concepts, although they are closely related. Various researches have been done to measure customer satisfaction in service industry.
The research conducted by Atkinson (1988) found that “cleanliness, security, value for money and courtesy of staff determine customer satisfaction”. Knutson (1988) revealed that cleanliness and comfort, convenience of location, prompt service, safety and security, and friendliness of employees are key determinants of customer satisfaction. A study conducted by Akan (1995) claimed that the vital factors are the behaviour of employees, cleanliness and timeliness. On the other hand the study by Choi and Chu (2001) concluded that staff quality, property qualities, and value are the top three factors that determine customers‟ satisfaction.
3.3.2 Measuring service quality
Many service quality models exist but researchers have varying views about the models and their measurement. Service quality has diverse dimensions vis-à-vis the various service sectors (Pollack, 2009). However, service quality measurement enables managers to recognize quality problems and enhance the efficiency and quality of services to exceed expectations and reach customer satisfaction (Ghotbabadi et al., 2012)
The most widely used scales in measuring service quality in the banking sector are the SERVQUAL and SERVPERF models (Cronin &Taylor, 1992; Mesay, 2012 and Johnson et al., 1995).
Parasuraman et al., (1988, 1991) developed an instrument (SERVQUAL) that has the most support in the measurement of service quality. According to the SERVQUAL model, service quality can be measured by identifying the gaps between customers‟ expectations of the service to be given and their perceptions of the actual performance of the service. SERVQUAL instrument involves the measurement of the five dimensions. The respondent is capable to specify both perceptions and expectations that statements have of the specific dimension. Parasuraman et al., (1988) used a 7 point scale to determine both perceptions and expectations. The foundation of SERVQUAL is the conceptualization of service quality as the difference between customers‟ expectations and perceived performances.
The SERVPERF instrument was introduced by Cronin and Taylor in 1992. SERVPERF measures service quality by measuring the perceptions of customers only. Cronin and Taylor argued that measuring perceptions are sufficient for measuring service quality and therefore expectations should not be included as suggested by SERVQUAL (Petridou et al., 2007; Baumann, 2007). The SERVPERF instrument is a derivative of the original SERVQUAL instrument, only measuring performance of service quality. The improvement offered by
SERVPERF includes the absence of gap measurement issues, greater variance explained, and a smaller number of items used (Dwayne, 2004; Cronin and Taylor, 1992; Newman, 2001). In the banking sector, service quality has become more and more significant aspect for achievement and endurance (Johnson et al., 1995). The stipulation of high quality service helps in achieving numerous requirements like customer satisfaction and its outcome loyalty, profitability, market share and financial performance.
The evaluation of service quality is conceptualized as a gap between what the customer expects from banks with regards to financial services and their assessments of the performance with the Bank. The SERVPERF in this study was adapted to Rwanda banking industry to measure service quality as perceived by the customers.
4. RESEARCH METHODOLOGY
This part provides a detailed analysis of the methodology which has been used by the researcher to collect data, analyse them and the presentation of the findings. Quantitative research was used. The quantitative research is the technique that involves a large number of respondents providing descriptive evidence that cannot be simply projected on whole population (Dillon et al., 1994). This research undertakes a survey involving customers of one of leading banks in Rwanda. The questionnaire was a self-completion questionnaire: the respondent completed it without any assistance.
4.1. Study population and Sampling
The population used in this study covered the customers of the Bank. Non probability sampling was used. Non-probability sampling represents a group of sampling techniques that help researchers to select units from a population that they are interested in studying (Gates and McDaniel, 1998, Panneerselvam (2004). Collectively, these units form the sample that the researcher studies. Our respondents have been selected using convenience sampling method. This means that customers were selected due to the ease with which they could be contacted. The researcher requested permission from the bank to engage customers in the study through giving them questionnaires to fill them as they come to the bank before they went out.
4.2 Sources of data and data collection instruments 4.2.1 Sources of data
The research used both primary and secondary data. Primary data were selected for respondents using questionnaires. Secondary data were obtained by reviewing existing
published literature, grey literature such as lecturer‟s notes and internet searches (Gilbert, 1992; Grinnell and Williams 1990).
4.2.2. Data collection instruments
The instrument of this study was constructed on the basis of research objectives and research questions where a bibliographical section was to obtain information about the respondents. Information gathered through questions related to the customers‟ gender, age, occupation and the time which they have been customer of the Bank. The SERVPERF instrument was adapted to the Rwandan commercial bank situation and was translated into Kinyarwanda.
4.3. Data processing and analysis 4.3.1. Data processing
The researcher closely examined the relationship between the questions and their respective responses in order to ensure consistency, accuracy and uniformity. Quantitative techniques were used to process and analyse the collected data. Using these techniques, the presentation and organization of findings made it very easy to comprehend and draw conclusions based on the findings.
Data collected have been categorized in different categories by which answers to each question in a completed data collection instrument, is categorized and each category given an identification code (for convenience for the computer). Answers were also codified using numbers. The numerical codes were particularly useful when the data or responses were being entered into computer for further processing and/or analysis. This is because they are easier to enter as opposed to words and take less storage in computer memory (Bakkabulindi, 2004). After entering data or responses into computer, they were presented or summarized or condensed into tables and graphs, so that they can be analysed.
4.3.2. Data analysis
Once the data have been prepared, the researcher usually goes further to analyse or interpret them (Abas, 2009). Quantitative data analysis was used, which were based on variables measured with numbers and analysed with statistical procedures.
To analyse our data, we used T-test, Levene‟s test, F statistic test and SERVQUAL dimensions. The Cronbach's Alpha was used for comparing the internal reliability
5. FINDINGS
The items chosen to measure five dimensions of service quality and customer satisfaction are: bank‟s physical facilities, bank uses state of the art technology and equipment in their service delivery, the neatness of employees, whether the bank always honours its promises, the staff‟s sincerity to solve the customers „problems, delivering services promptly and on time, bank‟s employees tell customer exactly when services will be performed, employees are always willing to help customer, bank‟s employees instil confidence in customer, customer feels safe in transactions with the bank, BK‟s employees are consistently courteous with the customer, bank‟s employees are knowledgeable, bank‟s employees give me individual attention, bank has the customer best interest at heart and understand customer‟s specific needs. And bank operating hours and location are convenient to customer. The customers have been asked to rate the above variables at a seven point scale.
5.1. Demographic findings
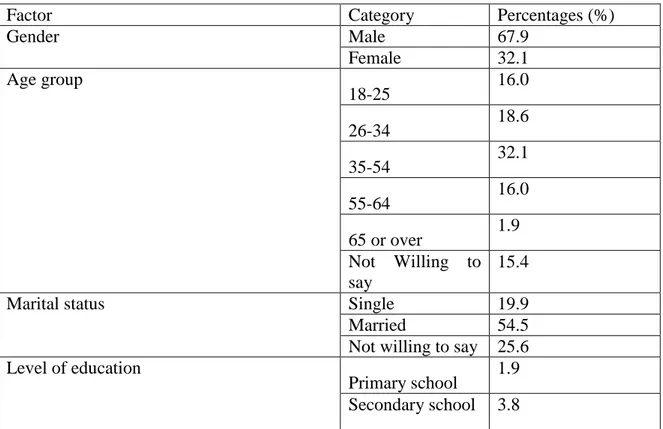
Table 1 provides basics results on demographic characteristics of the respondents: their age, gender, educational level, branches of customer, frequency of use of BK‟s facilities.
Table 1: Demographic characteristics of the respondents
Factor Category Percentages (%)
Gender Male 67.9 Female 32.1 Age group 18-25 16.0 26-34 18.6 35-54 32.1 55-64 16.0 65 or over 1.9 Not Willing to say 15.4
Marital status Single 19.9
Married 54.5
Not willing to say 25.6 Level of education
Primary school 1.9 Secondary school 3.8
Factor Category Percentages (%) Some university level 23.1 Technical diploma/degree 7.1 University completed 53.8
Not will to say 10.3
Branches of clients Kigali City 50.0
Northern Province 9.6 Eastern Province 14.1 Southern Province 19.2 Western Province 7.1
Time spent as BK client 1-12 Months 12.2
1-3Years 42.3
4-7years 19.2
8-11Years 11.5
12 Years and
above 14.7
BK facilities used often ATM 39.1
Visa card 13.5
Mobile Banking 32.1 Cheque Booklet 8.3
Others 7.1
Usage of ATM per month Never 44.9
1 - 2 Times 30.8 3 - 4 Times 15.4 5 - 6 Times 5.1
More 3.8
Usage of internet Banking per month Never 7.7 1 - 2 Times 15.4 3 - 4 Times 26.3 5 - 6 Times 42.3
More 8.3
The sample included 156 customers of BK. It included more males (67.9%) than females (32.1%). A third of respondents (32.1%) are aged between 35 and 54. There were more married (54.5%) respondents, and the majority of the respondents had completed university (53.8%). More respondents have been BK‟s customer for 1 to 3 years (42.3%). Regarding the
frequency of use BK‟s facilities, the majority of them were using ATM and Mobile banking (39.1% and 32.1%) respectively.
The results of study show that BK‟s physical environments and facilities are conducive to delivering good service, and the customers are satisfied with the physical environments and facilities.
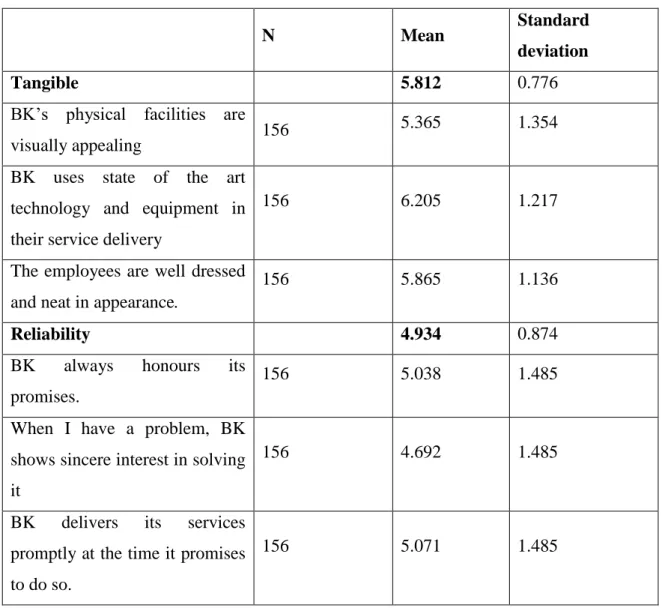
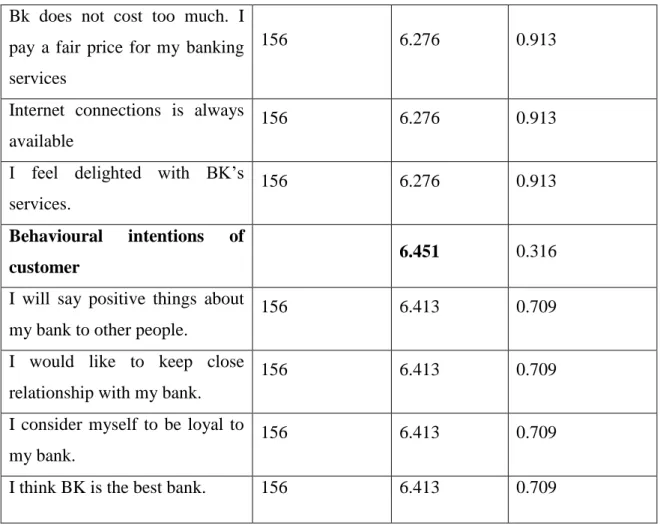
5.2. Customer perceptions of service quality in BK
The perceptions of service quality of BK‟s customers are shown in table 2. It includes five dimensions and items used to determine customer‟s satisfaction with respect to financial services offered by BK in seven scales that show the customer‟s perceptions about the bank. The respondent showed the extent to which he/she believes the BK has the features described in the statements.
Table 2: Customer perception of BK’s service quality
N Mean Standard
deviation
Tangible 5.812 0.776
BK‟s physical facilities are
visually appealing 156
5.365 1.354
BK uses state of the art technology and equipment in their service delivery
156 6.205 1.217
The employees are well dressed and neat in appearance.
156 5.865 1.136
Reliability 4.934 0.874
BK always honours its promises.
156 5.038 1.485
When I have a problem, BK shows sincere interest in solving it
156 4.692 1.485
BK delivers its services promptly at the time it promises to do so.
Responsiveness 5.131 1.117 BK‟s employees tell me exactly
when services will be performed.
156 5.122 1.336
BK‟s employees are always willing to help me.
156 5.141 1.336
Assurance 5.473 .478
BK‟s employees instil confidence in me.
156 5.885 1.053
I feel safe in transactions with the bank.
156 6.279 1.053
BK‟s employees are consistently courteous with me.
156 5.365 1.053 BK‟s employees have knowledge to answer my questions. 156 4.361 1.053 Empathy 4.962 .627 BK‟s employees give me individual attention. 156 4.85 1.359 BK‟s employees understand my specific needs. 156 5.01 1.205
BK operating hours and location are convenient to me.
156 5.03 1.056
Overall service quality 5.949
The services offered by BK are of high quality.
156 5.949
Customer satisfaction 6.030 0.395
I am satisfied about the use of electronic banking services (eg: ATM-Internet-Mobile
Banking).
Bk does not cost too much. I pay a fair price for my banking services
156 6.276 0.913
Internet connections is always available
156 6.276 0.913
I feel delighted with BK‟s services.
156 6.276 0.913
Behavioural intentions of
customer 6.451 0.316
I will say positive things about my bank to other people.
156 6.413 0.709
I would like to keep close relationship with my bank.
156 6.413 0.709
I consider myself to be loyal to my bank.
156 6.413 0.709
I think BK is the best bank. 156 6.413 0.709
According to above table, the tangible dimension has the highest mean score (5,812), followed by assurance and responsiveness service quality dimensions respectively (5,473; 5,131). The lowest dimensions of service quality are reliability and empathy 4,962; 4, 934). The overall service quality has mean score of 5.949. In 15 items of five dimensions of service quality 61, 67% of respondents strongly agree that BK‟s tangibility determines customer satisfaction. 64.74% of respondents strongly agree that BK uses state of the art technology and equipment in their service delivery (see annexure 2). The overall mean behavioural intentions of customers towards banking services offered by BK are 6,451 while overall customer satisfaction is 6.030. These two last statements also have a low standard deviation which means that results of respondents are not scattered. Respondents had agreed and strongly agreed that
Table 3: ANOVA age group test
The table below illustrates the differences between the age group of study. The results show that it was a different with respect to the age groups. We are interested in comparing the
mean scores of more than two groups of age. In this situation we would use analysis of variance (ANOVA). One-way analysis of variance involves one independent variable (referred to as a factor), which has a number of different levels. These levels correspond to the different groups of age. One-way ANOVA tells us whether there are significant differences in the mean scores on the dependent variable across the groups of age.
ANOVA Sum of Squares Df Mean Square F Sig.
The services offered by BK are of high quality.
Between
Groups 1.117 5 .223 .585 .711
Within Groups 56.468 148 .382
Total 57.584 153
Average Tangibles Between
Groups 17.545 5 3.509 7.057 .000
Within Groups 73.596 148 .497
Total 91.141 153
Average Reliability Between
Groups 9.413 5 1.883 2.601 .028
Within Groups 107.132 148 .724
Total 116.545 153
Ave Responsiveness Between
Groups 11.367 5 2.273 1.852 .106
Within Groups 181.654 148 1.227
Total 193.021 153
Ave Assurance Between
Groups 3.880 5 .776 3.657 .004
Within Groups 31.411 148 .212
Total 35.291 153
Ave Empathy Between
Groups 10.603 5 2.121 6.317 .000
Within Groups 49.686 148 .336
Total 60.289 153
Ave Customer satisfaction Between
Groups 1.207 5 .241 1.560 .175
Within Groups 22.911 148 .155
Total 24.119 153
Ave Behavioral Intentions Between
Groups .486 5 .097 .965 .442
Within Groups 14.899 148 .101
Total 15.385 153
Significant differences between the age groups with respect to Tangibles (p=0.000); Reliability (p=0.028) and Empathy (p=0.000).
The Sig. value is less than or equal to .05 (tangibles, reliability, assurance and empathy), then there is a significant difference somewhere among the mean scores on these variables your for the different groups of age.
ANOVA age group test shows that the value of sig is above the required P-value of .05, there is not a statistically significant difference in the means behaviours intentions, average customer satisfaction and average responsiveness scores for these groups of age.
Table 4: Gender T test
The table below includes the results from gender t-test.
Independent Samples Test
Levene's Test for Equality of
Variances t-test for Equality of Means
F Sig. t Df Sig. (2-tailed) Mean Difference Std. Error Difference 95% Confidence Interval of the Difference Lower Upper Updated empathy Equal variances assumed .434 .511 -3.277 154 .001 -.47849 .14601 -.76694 -.19004 Equal variances not assumed -3.314 98.913 .001 -.47849 .14438 -.76497 -.19201 Ave Customer satisfaction Equal variances assumed 2.532 .114 2.323 154 .021 .155 .067 .023 .287 Equal variances not assumed 2.461 111.441 .015 .155 .063 .030 .280 Ave Behavioural Intentions Equal variances assumed 3.237 .074 .187 154 .852 .010 .054 -.097 .118 Equal variances not assumed .178 85.213 .859 .010 .057 -.104 .124
Ave Assurance Equal variances assumed 3.883 .051 -.607 154 .545 -.050 .082 -.212 .112 Equal variances not assumed -.632 106.754 .529 -.050 .079 -.206 .106 Ave Responsiveness Equal variances assumed .971 .326 -.756 154 .451 -.145 .192 -.524 .234 Equal variances not assumed -.720 85.514 .473 -.145 .201 -.546 .255 Average Reliability Equal variances assumed .711 .400 -1.507 154 .134 -.225 .149 -.520 .070 Equal variances not assumed -1.412 82.258 .162 -.225 .159 -.542 .092 Average Tangibles Equal variances assumed 1.917 .168 1.240 154 .217 .16478 .13293 -.09782 .42738 Equal variances not assumed 1.334 116.138 .185 .16478 .12352 -.07986 .40942
The table 4 presents results on gender variables and it shows that gender‟s impact on customer satisfaction. The Levene‟s test for equality of variances has been used to check the significance of mean difference (the significance value for F is greater than .05). The confidence level at 95% has been established. Significant differences were also found between the genders with regard to empathy (Males=4.80; Female=5.28; p=0.001) and Customer satisfaction (Males=6.08; Female=5.93; p=0.021).
The results from these tests show that the value of sig. is equal and less than the required cut-off of .05, we conclude that there is a statistically significant difference in the means of assurance, customer satisfaction and empathy scores for males and females. The t-test for equality of means in the means of tangible, reliability, responsiveness and behaviour intentions shows that the value of sig (2-tailed) is above the required cut-off of .05, there is not a statistically significant difference in the means scores of these variables for two groups.
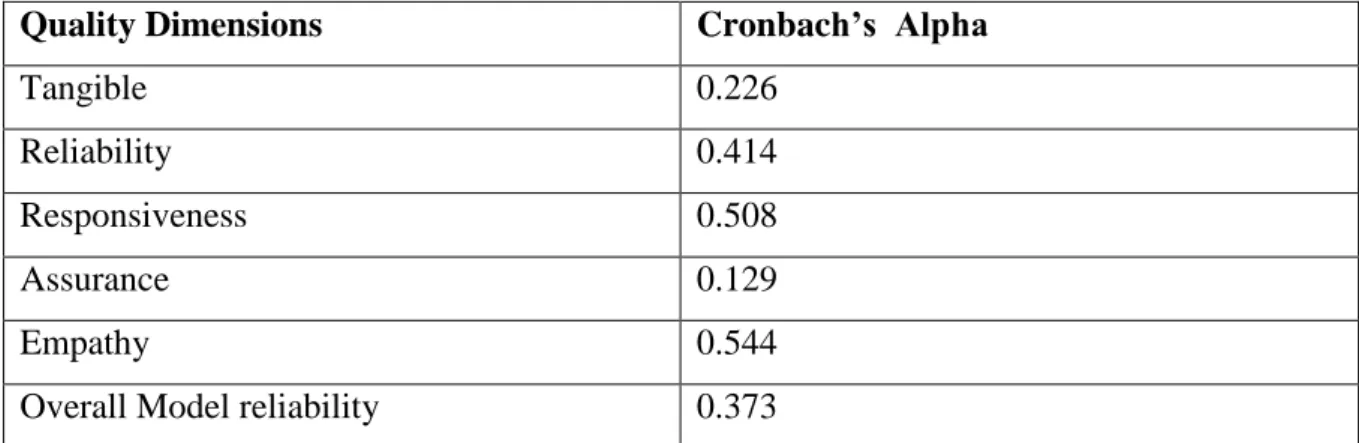
5.3 Reliability of overall Model and Quality Dimensions
To test reliability between variables, Cronbach‟s Alpha has been used (it varies between 0 and 1). Cronbach‟s Alpha has been used to measure internal consistency, which means that all items within the model should measure the same thing.
The closer the Alpha is to 1.0, the greater the internal consistency of items in the model being assessed. A model is reliable if items used produce similar results regardless of whom administer them and regardless of which forms are used (Briggs & Cheek, 1986).
Nunnally (1978) recommends a minimum level of .7. Cronbach alpha values are dependent on the number of items in the scale (Pallant, 2005).
Table 5: Overall model reliability
Quality Dimensions Cronbach’s Alpha
Tangible 0.226
Reliability 0.414
Responsiveness 0.508
Assurance 0.129
Empathy 0.544
The reliability of this study is to measure customer satisfaction with regards to service quality offered by the bank. The Alpha coefficient shows that the reliability of empathy and responsiveness as quality dimensions are 0.544 and 0.508 respectively. The Cornbrash‟s Alpha of reliability, tangible and assurance dimensions is .414, .226 and .129 respectively. As has been calculated in the above table showing the reliability of overall model and quality dimensions is 0.373. The results above show that both overall model and reliability dimensions can be considered as to have low reliability. High low levels of reliability were obtained on particularly 2 dimensions. This low reliability may due to reason that some words for certain concepts did not exist in Kinyarwanda and the resulting smaller number of items. This meant we had 3 (rather than more) items. Therefore, limits the ability to conduct statistical analysis (and hypothesis testing).
6. Discussion
The purpose of this research was to investigate the satisfaction of banking customers in Rwanda with regard to financial services received.
Based on the study, it was revealed that, BK employees had skills and knowledge in the performance of the services to customers. Customers feel respected and have generated feelings of security with bank.
Bank‟s uses state of the art technology and equipment in their service delivery and the way clients consider themselves to be loyal to their bank have been chosen by majority and have the highest mean. This implies how customers perceive services given by BK. Considering the quality dimensions, the largest perceptions of Bank of Kigali were in terms of the behaviour intentions of customers. The overall customer satisfaction with BK‟s services is that customer fell delighted with bank‟s services, especially the use of electronic banking services. Moreover, Assurance and empathy aspects require improvement when compared to the other dimensions.
7. Managerial implications
The perception of service quality among Bank of Kigali customers remains an important characteristic, and bank‟s management needs to take attention on perceptions and expectations of their clients. Specific strategies needs to be developed in order to retain customers, one of the strategies is to increase number of bank‟s outlets during taxes payment
periods. Having a good recovery process for a dissatisfied customer or service failure is a very important and necessary process for Bank of Kigali‟s management.
8. Limitations
The study was conducted in one commercial bank in Rwanda, which cannot be regarded as representative of other commercial banks in Rwanda. This means that the results of this study cannot be generalized. The research instrument was adapted and translated in Kinyarwanda and some words for certain concepts did not exist in Kinyarwanda. The perception of service differs from one person to the another; hence there is a possibility of cultural bias playing a role in the outcome of the study. There are many determinants of customer satisfaction, only service quality factor will was considered in this study.
9. Further research
For further research, little research has been published regarding service quality and customer satisfaction in commercial bank sector in Rwanda. Research needs to be done in customer satisfaction with other factors including personal factors, price, product quality, situational factors and in other financial service industry of Rwanda. Further research also needs to be done into use of the applicability of other service quality and customer satisfaction instruments. Future research needs to be done into other aspects impacting satisfaction.
REFERENCES
Akan, P. (1995). Dimensions of Service Quality: A Study in Istanbul. Managing Service Quality. 5(6): pp. 39-43.
Alison, T., Geda, A., Le Billon, P., Murshed, S.M. (2001). Financial Reconstruction in Conflict and Post-Conflict Economies. Paper presented at the Conference of the Finance and Development Research Programme, pp. 5-6.
Anderson, E.W., Fornell, C. and Lehmann, D.R. (1994), “Customer satisfaction, market share, and profitability: findings from Sweden”, Journal of Marketing, Vol. 58 No. 3, pp. 53-66
Arasli, H., Mehtap-Smadi, S. & Katircioglu, S. T. (2005). Customer service quality in the Greek Cypriot banking industry. Managing Service Quality, 15 (1), 41-56.
Arasli, H., Smadi, S. M., and Katircioglu, S. T. (2005). Customer Service Quality in the Greek Cypriot banking industry. Managing Service Quality, 15(1), 41-56.
Athanassopoulos, A., & Iliakopoulos, A. (2003). Modeling customer satisfaction in telecommunications: assessing the effects of multiple transaction points on the perceived overall performance of the provider. Production and Operation Management, 12(2), 224-245.
Baumann, C. (2007). Predication of Attitude and Behavioral Intentions in Retail Banking, Int. J. Bank. Mark. 25(2): 102 – 11.
Bloemer, J., De Ruyter, K. & Peeters, P. (1998). Investigating drivers of bank loyalty: the complex relationship between image, service quality and satisfaction. International Journal of Bank Marketing, 16 (7), 276-286.
Briggs, S. R., & Cheek, J. M. (1986). The role of factor analysis in the development and evaluation of personality scales. Journal of Personality, 54, 106–148.
Cacioppo, K. (2000). Measuring and Managing Customer Satisfaction. Quality Digest http://www.qualitydigest.com/sept00/html/satisfaction.html.
Cronin, J.J., and Taylor, S.A. (1992). Measuring service quality: a re‐examination and extension. Journal of Marketing, Vol. 56, pp. 55‐68
Cui, C. C., Lewis, B. R., and Park, W. (2003). Service quality measurement in the banking sector in South Korea. The International Journal of Bank Marketing, 21(4/5), 191-201.
Culiberg, B., and Rojšek, I. (2010) Identifying service quality dimensions as antecedents to customer satisfaction in retail banking. Economic and business review, vol. 12, no. 3,151– 166
De Ruyter, K., Wetzels, M., and Bloemer, J. (1998). On the Relationship between Perceived Service Quality, Service Loyalty and Switching Costs. International Journal of Service Industry Management, Vol.9, pp. 436-53.
Dushimyumukiza, D. (2010). Financial development and economic growth in Rwanda. Memoire Published.
Ecobank. (2013). Ecobank research: Banking in Rwanda, Middle Africa insight series.
Egyeyu, H. (2010). Information technology & electronic banking in commercial banks in Uganda. Gulu University.
Hazlina. (2011). Impacts of service quality on customer satisfaction: Study of Online banking and ATM services in Malaysia, Int. J. Trade. Econ. Fin. 2(1).
Jamal, A. & Naser, K. (2002). Customer satisfaction and retail banking: an assessment of some of the key ante- cedents of customer satisfaction in retail banking. International Journal of Bank Marketing, 20 (4), 146-160.
Jamal, A., & Naser, K. (2003). Factors influencing customer satisfaction in the retail bankingsector in Pakistan. InternationalJournalofCommerce &Management, Vol. 13 No.2, pp.29-53
Johnson, R.L., Tsiros, M., and Lancioni, R.A. (1995). Measuring service quality: a system approach. Journal of services marketing, Vol 9(5): 6-19
Joseph et al. (2003). Service quality in the banking sector: the impact of technology on service delivery. International Journal of Bank Marketing, Vol. 17 No. 4, pp. 182-91.
Ladhari, R. (2009). Assessment of the psychometric properties of SERVQUAL in the Canadian banking industry. Journal of Financial Services Marketing, 14(1), 70-82.
Lassar, W., Manolis, C. & Lassar, S. (2005). The relationship between consumer innovativeness, personal characteristics, & online banking adoption, International Journal of Bank Marketing, 23(2), 176-99.
McDougall, G., and Levesque, T. (1996). Determinants of customer satisfaction in retail banking. International journal of Bank Marketing, Vol.14 lss 7 pp12-20
Mesay, S.S. (2012). Bank Service Quality, Customer Satisfaction and Loyalty in Ethiopian Banking Sector. Journal of Business Administration and Management Sciences Research Vol. 1(1), pp. 001-009
MINICOFIN. (2000), Annual report of Ministry of Finance and Economic Planning, Kigali, Rwanda
Newman, K. (2001). Interrogating SERVQUAL: a critical assessment service quality measurement in a high street retail bank. International Journal of bank marketing, Vol 19(3), 126-139
Nsengiyumva, A., & Habumuremyi E.(2009). A Review of Telecommunications Policy Development and Challenges in Rwanda. (Johannesburg: Association for Progressive Communications. (http://www.apc.org/en/pubs/research/review- telecommunications-policy-and challenges-rw)
Oliva, T.A., Oliver, R.L. and MacMillan, I.C. (1992). A catastrophe model for developing service satisfaction strategies. Journal of Marketing, Vol. 56, pp. 83‐95
Oliver, R. (1980). A cognitive model of the Antecedents and consequences of satisfaction decisions. Journal of Marketing Research, 17(4), 460.
Oliver, R.L. (1997). Satisfaction: A behavioural perspective on the consumer. Irwin/ McGraw-Hill. NY.
Parasuraman, A., Zeithaml, V. A. & Berry, L. L. (1985). A conceptual model of service quality and its implications for future research. Journal of Marketing, 49, 41-50.
Parasuraman, A., Zeithaml, V. A. & Berry, L. L. (1988). SERVQUAL: A multi item scale for measuring consumer perception of service quality. Journal of Retailing, 64, 12-40.
Petridou E., Charalambos S., Niki G., Chris L., (2007). Bank service quality: empirical evidence from Greek and Bulgarian retail customers. International Journal of Quality & Reliability Management, Vol. 24 Iss 6 pp. 568 – 585
Rahman, M. H. 2014. Factors affecting customer satisfaction in mobile telecommunication industry in Bangladesh, Business, Management and Education 12(1): 74–93.
Ravichandran, K. (2010). Influence of Service Quality on Customer Satisfaction, Application of SERVQUAL Model, Int. J. Bus. Manage. 5: 117-124.
Siddiqi, K. O. (2011). Interrelations between service quality attributes, customer satisfaction and customer loyalty in the Retail banking sector in Bangladesh. International Journal of Business and Management, Vol. 6, No. 3
Siu NYM, Mou JCW (2005). Measuring Service Quality in Internet Banking: The Case of Hong Kong, J. Int. Consumer. Mark. 17(4): 99 – 116.
Spreng, R.A. and Mackoy, R.D. (1996). An empirical examination of a model of perceived service quality and satisfaction. Journal of Retailing, Vol. 72, pp. 201‐14
Sulieman (2011). Banking Service Quality Provided by Commercial Banks and Customer Satisfaction. American Journal of Scientific Research, ISSN 1450- 223X Issue 27(2011), pp. 68-83
Sunny, B., & Gupta, N. (2013). Customer Perception of Services Based on the SERVQUAL Dimensions: A Study of Indian Commercial Banks. Services Marketing Quarterly, 34:1, 49-66, DOI: 10.1080/15332969.2013.739941
Sureshchandar, G.S., Rajendran, C. and Kamalanabhan, T.J. (2001). Customer perceptions of service quality – a critique. Total Quality Management, Vol. 12, pp. 111‐24
Sureshchandar,G., Rajendran,C. and Anantharaman, R. (2002). The relationship between service quality and consumer satisfaction – a factor specific approach. Journal of Services Marketing, Vol. 16 No. 4.
Surprenant, C., and Churchill, G. (1982). An investigation into the determinants of customer satisfaction. Journal of Marketing Research, 19(4), 491.
Uddin, M. M., Khan, M. A., & Farhana, N. (2014). Banking services and customer perception in some selected commercial banks in Bangladesh. Indonesian Management and Accounting Research, 13(1), 1-15.
Vavra Terry G. (1997). Improving Your Measurement of Customer Satisfaction: A Guide to Creating, Conducting, Analyzing, and Reporting Customer Satisfaction Measurement Programs. American Society for Qualit. p.47.
Zeithaml, V, A. &Bitner, M, J. (2009) Service Marketing: Integrating Customer Focus Across the Firm, New York: McGraw-Hill Higher Education.
Zeithaml, V. A., Wilson, A., and Bitner, M. J. (2008). Services Marketing. 4th ed. New Delhi: The McGraw-Hill Companies.
Zeithaml, VA, Bitner, M.J (2003), Service marketing: Integrating customer focus across the firm, 4th Edition, Boston: McGraw-Hill
Zeithaml, VA, Bitner, M.J and Gremler, D.D. (2006), Service marketing: Integrating customer focus across the firm, 4th Edition, Boston: McGraw-Hill
Zhou, L. (2004). A dimension specific analysis of performance-only measurement of service quality and satisfaction in China„s retail banking. Journal of Services Marketing, 18 (7), 534-546. 2005
Zhou, Y., Ho, T., Y. Park, (2005), Incorporating Satisfaction into Customer Value Analysis: Optimal Investment in Lifetime Value. Journal of Marketing, 18 (7), 534-546.
ANNEXURES
Annex 1: Number of customers of BK (2005-2014)
Year Number of customers
2005 6336 2006 7085 2007 7613 2008 9829 2009 20264 2010 69193 2011 133063 2012 336153 2013 160163 2014 111333 Source: BK 2014
Annex 2: Dimensions of service quality
Dimensions Items Frequency
1 2 3 4 5 6 7 Tangible BK‟s physical facilities are visually appealing 156 (0%) 2 17 26 23 53 35 BK uses state of the art technology and equipment in 156 (0%) (0%) 6 15 21 13 101
their service delivery The employees are well dressed and neat in appearance 156 156 (0%) 11 9 19 68 49 Reliability BK always honours its promises. 156 0 0 37 20 36 26 37 When I have a problem, BK shows sincere interest in solving it 156 0 0 35 22 70 14 15 BK delivers its services promptly at the time it promises to do so. 156 0 0 20 26 46 51 13 Responsive ness BK‟s employees tell me exactly when services will be performed. 156 0 (0%) 18 43 30 32 33 BK‟s employees are always willing to help me. 156 0 0 22 39 26 33 36 Assurance BK‟s employees instil confidence in me. 156 0 0 2 17 33 49 55 I feel safe in transactions with the bank.
156 0 0 2 4 22 48 80 BK‟s employees are consistently courteous with me. 156 0 0 0 32 49 61 14 BK‟s employees have knowledge to 156 0 0 19 70 60 7 0
answer my questions. Empathy BK‟s employees give me individual attention. 156 0 0 27 51 22 31 25 BK‟s employees understand my specific needs. 156 0 0 24 25 48 44 15 BK operating hours and location are convenient to me. 0 0 0 60 55 17 24