ALTERATION OF THE BOOTSTRAP LIMESTONE, NORTHERN CARLIN TREND, ELKO COUNTY, NEVADA
by
School of Mines in partial fulfillment of the requirements for the degree of Master of Science (Geology). Golden, Colorado Date ___________ Signed: _____________________________ Catherine E. Morgan Signed: _____________________________ Dr. John D. Humphrey Thesis Advisor Golden, Colorado Date ___________ Signed: _____________________________ Dr. John D. Humphrey
Professor and Interim Head
Department of Geology and
Geological Engineering
The Silurian-Devonian Bootstrap limestone unit hosts Carlin-type gold deposits. Although the structural controls for Carlin-type gold deposits can vary significantly, ore bodies located in the Bootstrap limestone occur predominately in silicified breccias. The objectives of this study were to describe in detail the alteration in the Bootstrap
limestone, determine paragenesis of the different alteration events, and identify the pattern of alteration surrounding Bootstrap-hosted deposits. The objectives were met through detailed logging of drill-hole cores, as well as standard petrography,
cathodoluminescence microscopy, and stable isotopic analysis.
The study area focuses on the northern Carlin trend, located approximately 27 miles (43 km) northwest of Carlin, NV. This area includes the deposits of Meikle, Ren, Dee-Rossi (Storm), and South Arturo. The relevant stratigraphy in the area consists of the massive Bootstrap limestone platform unit and the time-equivalent Roberts Mountains Formation and slope and basinal facies of the Popovich Formation.
Six major carbonate components of the Bootstrap limestone were recognized in the study area: limestone, diagenetic-planar dolomite, saddle dolomite, ferroan dolomite, zebra texture dolomite, and calcite. The limestone experienced pervasive early diagenetic calcite cementation that sharply lowered porosity and permeability of the unit. The resulting restriction of fluid flow resulted in a condensed sequence of later hydrothermal dolomitization.
The diagenetic-planar dolomite represents a regional dolomitization event that was localized along the lower contact of the Bootstrap limestone. The fluids necessary for dolomitization were probably sourced from compaction of the adjacent mud-rich Roberts
Meikle to the Ren area.
Non-planar saddle, ferroan, and zebra texture dolomites are the result of hydrothermal dolomitization. Curved boundaries of the dolomite crystals, associated sulfides, and calculated temperatures from isotopic data, support a hydrothermal source for these dolomites. Through cross cutting relationships between diagenetic planar dolomite and non-planar dolomites were not observed, the available evidence suggests non-planar dolomite post date planar dolomite. Non-planar, commonly ferroan dolomite at Meikle is spatially associated with a Paleozoic age base-metal mineralization event. Non-planar, generally non-ferroan at Storm and Dee-Rossi are spatially associated with Jurassic to Eocene intrusions suggesting they formed due to much later hydrothermal events. Thus, there are two possible generations of hydrothermal dolomite, one in the Paleozoic and another associated with Jurassic to Tertiary igneous activity.
In the study area, the complex nature of the breccia bodies and/or the permeability of the host rock limit the lateral extent of the carbonate alteration. However, based on the samples analyzed in this study, and recognition of the processes that form dolomite, a pattern of dolomitization can be predicted for Carlin-type deposits in this study area. Extending away from a fluid pathway, ferroan dolomite forms first, followed by saddle dolomite, which is in contact with unaltered limestone. Zebra texture dolomite forms at the transition between ferroan and saddle dolomites, or it can extend throughout the zone of ferroan dolomite. The dolomite zonation pattern, as well as the different generations of dolomite, should be considered in the exploration for Carlin-type deposits hosted in massive limestone units. Each dolomite generation may reflect the potential for gold
favorable host.
ABSTRACT... iii
LIST OF FIGURES ... viii
LIST OF TABLES... xi ACKNOWLEDGMENTS ... xii INTRODUCTION ...1 Objectives ... 3 Methods...3 GEOLOGIC BACKGROUND...5 Tectonic History...5 Stratigraphy...8 Structure...17
Paleozoic Mineralization Event ...18
Cretaceous Mineralization Event...19
Tertiary Mineralization Event...20
Alteration ...24 RESEARCH RESULTS ...26 Limestone...26 Diagenetic-Planar Dolomite...31 Saddle Dolomite...41 Ferroan Dolomite ...46 Zebra Dolomite ...52 Calcite ...59 vi
Limestone Interpretation...67
Dolostone Interpretation ...68
Saddle Dolomite and Ferroan Dolomite Interpretation ...75
Zebra Texture Dolomite Formation ...84
Calcite Generations...86
Generations of Silica Deposition ...91
Hydrocarbon Migration ...94
Paragenesis...94
Pattern of Dolomitization...97
SUMMARY AND CONCLUSIONS ...104
REFERENCES CITED...109
APPENDIX A—GEOLOGIC MAP...117
APPENDIX B—DATA ...118
APPENDIX C—CORE LOGS ...127
APPENDIX D—STABLE ISOTOPE DATA ...133
Figure 1: Location map of the Carlin trend ...2
Figure 2: Summary of the tectonic history for western North America ...6
Figure 3: Tectonostratigraphic column of the northern Carlin trend...9
Figure 4: Facies distribution map for the Bootstrap limestone...11
Figure 5: Cross section B-B’ through the Bootstrap limestone shoal facies ...12
Figure 6: Location of the study area along the northern Carlin trend...14
Figure 7: Cross sections across the Storm, Meikle, and South Arturo deposits ...16
Figure 8: Genetic model for Carlin-type deposits...17
Figure 9: Map with the locations of drill holes...27
Figure 10: Core photo of Bootstrap limestone shoal facies...29
Figure 11: Photomicrographs of limestone...30
Figure 12: Cathodoluminscence photomicrograph of limestone ...32
Figure 13: Isotopic data for limestone samples ...33
Figure 14: Location map of drill holes with diagenetic-planar dolomite ...34
Figure 15: Core photo of limestone and diagenetic-planar dolomite contact...35
Figure 16: Photomicrographs of diagenetic-planar dolomite ...38
Figure 17: Cathodoluminscence photomicrographs of diagenetic-planar dolomite ...39
Figure 18: Isotopic data for diagenetic-planar dolomite...40
Figure 19: Map with the locations of drill holes with saddle dolomite ...42
Figure 20: Hand sample photos of saddle dolomite...43
Figure 21: Photomicrographs of saddle dolomite...44
Figure 22: Cathodoluminscence photomicrographs of saddle dolomite...45
Figure 24: Location map of drill holes with ferroan dolomite...48
Figure 25: Hand sample photographs of ferroan dolomite ...49
Figure 26: Photomicrograph of ferroan dolomite ...50
Figure 27: Cathodoluminscence photomicrographs of ferroan dolomite ...51
Figure 28: Isotopic data for ferroan dolomite ...53
Figure 29: Location map of drill holes with zebra dolomite ...54
Figure 30: Hand sample photographs of zebra dolomite ...55
Figure 31: Photomicrographs of zebra dolomite ...57
Figure 32: Cathodoluminscence photomicrographs of zebra dolomite ...58
Figure 33: Isotopic data for zebra dolomite...60
Figure 34: Hand sample photograph of late calcite ...61
Figure 35: Photomicrographs of late calcite ...63
Figure 36: Cathodoluminscence photomicrographs of late calcite...65
Figure 37: Isotopic data for zebra texture dolomite...66
Figure 38: Isotopic data and associated photomicrographs for limestone ...69
Figure 39: Burial compaction model for dolomitization ...72
Figure 40: Schematic cross section of the dolostone horizon...75
Figure 41: Isotopic data and associated photomicrographs for diagenetic-planar dolomite...77
Figure 42: Isotopic data and associated photomicrographs for saddle dolomite ...82
Figure 43: Isotopic data and associated photomicrograph for ferroan dolomite ...83
Figure 44: Hand sample photo of Ex-21c, 1024’, with saddle dolomite vein crossing ferroan dolomite ...87
Figure 46: Photomicrographs of the white band in zebra dolomite...90
Figure 47: Isotopic data and associated photomicrographs for late calcite ...93
Figure 48: Paragenetic sequence of the carbonate types ...96
Figure 49: Map of the occurrences of different carbonate types ...98
Figure 50: Schematic diagram of the pattern of hydrothermal dolomitization...100
Figure 51: Isotopic data averages for each carbonate type ...102
Table 1: Table of drill holes sampled and deposit descriptions for
Meikle, Ren, Dee-Rossi, and South Arturo ...28 Table 2: Summary of the three generations of dolomite and the common
properties used for distinguishing each type...108
I would like to thank the following individuals and companies for all the time and support they gave to me and this research:
• Dr. John D. Humphrey, my advisor, who not only taught me carbonate geology, but also how to enjoy graduate school, balance work and life, and that Friday afternoons are for postre.
• Dr. Murray W. Hitzman, my other advisor/committee member, thank you for setting up this project, your time in Nevada, and enthusiasm in working with students.
• Dr. Jeffrey W. Hedenquist, thank you for serving on my committee, your edits and comments greatly improved the final conclusions of this project.
• Barrick Gold Exploration, Inc. and Barrick Goldstrike Mines, Inc., without whose financial support and access to data, this project would not have been possible. In particular, I thank Paul Dobak for supporting this project and taking the time to get me started out at the mine, as well as Richard Hipsley, Bob Leonardson, John Katseanes, Al Lander, and Robert Malloy.
• Centerra Gold for providing access to core from the Ren deposit.
• Society of Economic Geologists, Hugh Exton McKinstry Fund, for providing financial support.
• The Department of Geology and Geological Engineering for financial assistance as well as an education beyond my expectations and to all the staff, including Debbie Cockburn, Marilyn Schwinger, Charlie Rourke, and John Skok.
everyone who made graduate school fun.
• My parents for never questioning why I stayed in college 8 years and for giving me constant support.
• And especially Sean Horigan, whose friendship and love both aided and hindered my progress, but ultimately is the reason I finished.
INTRODUCTION
The Carlin trend is a 60 km-long, northwest-trending linear alignment of
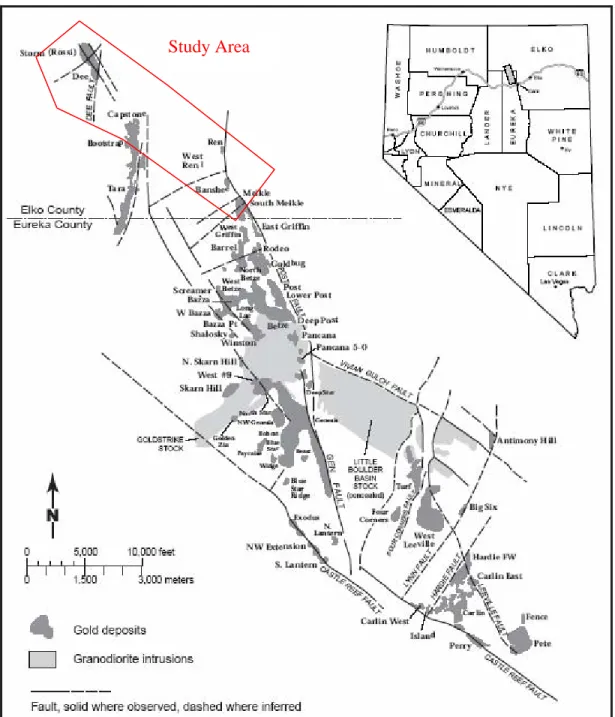
approximately 42 disseminated gold deposits located in northeastern Nevada (Figure 1). The trend contains 5,000 Mt of gold and contributes ~9% of the world’s annual gold production, with annual production of 4 M oz (Hofstra and Cline, 2000).
“Carlin-type” refers to sedimentary rock-hosted disseminated gold deposits. Though some deposits were mined in the early 1900s, this deposit type was first recognized with the 1961 discovery of the Carlin deposit. The deposits have a range of characteristics, including differing structural and stratigraphic controls. The variance between individual deposits in the trend results in varying Au tonnages and grades ranging from 100 t Au to >250 t Au (at >30 g/t), but Au deposits are also as small as 1 t Au or less (and grades as low as 1 g/t) (Cline et al., 2005).
There is evidence of three separate mineralization events in the northern Carlin trend, including a Paleozoic base-metal event with possible Au deposition, a Cretaceous porphyry related event, and the primary gold event that occurred from ~42 to 36 m.y. ago (Hofstra et al., 1999; Ressel et al., 2000; Arehart et al., 2003; Emsbo et al., 2003).
In the northern Carlin trend, calcareous rocks that comprise the Devonian-Silurian Roberts Mountains Formation and the Devonian Popovich Formation are the primary deposit hosts. Gold is typically associated with disseminated arsenic-rich pyrite. The alteration that extends laterally from these deposits through the carbonate host rocks is visually subtle. The intensity of the Au-bearing fluid interaction and porosity of the host rock control the extent of alteration (Cline et al., 2005).
Figure 1: Location map of the Carlin Trend, Nevada showing deposit locations and fault occurrences. The study area is in Elko County and includes the Meikle, Ren and Dee-Rossi deposits (from Teal and Jackson, 2002).
The objective of this project is to describe the alteration associated with the pre- and syn-gold mineralization of the Bootstrap limestone subunit of the Roberts Mountains Formation, continuing the work on the Meikle deposit by Evans (2000). This project consists of detailed petrographic descriptions and isotopic analysis to describe and determine extent of the carbonate alteration in the Bootstrap limestone unit.
Objectives
The objectives of this research are as follows:
• Describe the carbonate alteration in the Silurian-Devonian Bootstrap limestone (e.g., cementation, dolomitization, calcite precipitation, silicification)
• Determine the paragenesis of different alteration events and separate the Paleozoic and Tertiary events
• Identify alteration vectors for Carlin-type gold deposits in the Bootstrap limestone
Research Methods
A combination of field and laboratory studies was used to meet the objectives of this project. Two summer field seasons, 2005 and 2006, were spent in the Barrick Exploration office in Elko, Nevada and at the Barrick Goldstrike Mine.
The fieldwork portion of this project involved the selection of drill holes that intersected Bootstrap limestone exhibiting varying alteration intensities. This included samples of Bootstrap limestone that were relatively fresh and unaltered, diagenetically dolomitized, and hydrothermally dolomitized. Seventeen drill holes were logged in detail and hand samples were collected for later petrographic analysis. Logging focused on identifying and sampling different areas of limestone and dolomite from the Bootstrap.
Carbonate staining of the core was employed to make field-based observations of carbonate composition.
The laboratory portion of the research consisted of petrographic and isotopic analysis. Ninety-seven thin sections were prepared and examined. Detailed petrographic descriptions utilizing standard transmitted light and cathodoluminescence microscopy were conducted. The detailed descriptions focused on the percentage, type, and texture of dolomite in the samples. Classification of the samples followed the carbonate rock
classification scheme of Dunham (1962), and dolomite crystal fabrics were described using terminology of Sibley and Greg (1987).
Isotopic study was conducted on 78 samples from 11 drill holes. The samples represented limestone, diagenetic-planar dolomite, saddle dolomite, ferroan dolomite, light and dark bands of zebra texture dolomite, and late calcite. The isotopic data were used to separate and distinguish each carbonate phase. Approximately 90 µg of carbonate was reacted on-line at 90°C and analyzed using traditional dual-inlet techniques on a GV Instruments IsoPrime mass spectrometer in the Colorado School of Mines Stable Isotope Laboratory. Standard ion corrections were made and data are reported as a per mil difference from the VPDB standard reference. External precision, based on blind duplicate samples is 0.05‰ for carbon and 0.08‰ for oxygen.
GEOLOGIC BACKGROUND
Tectonic History
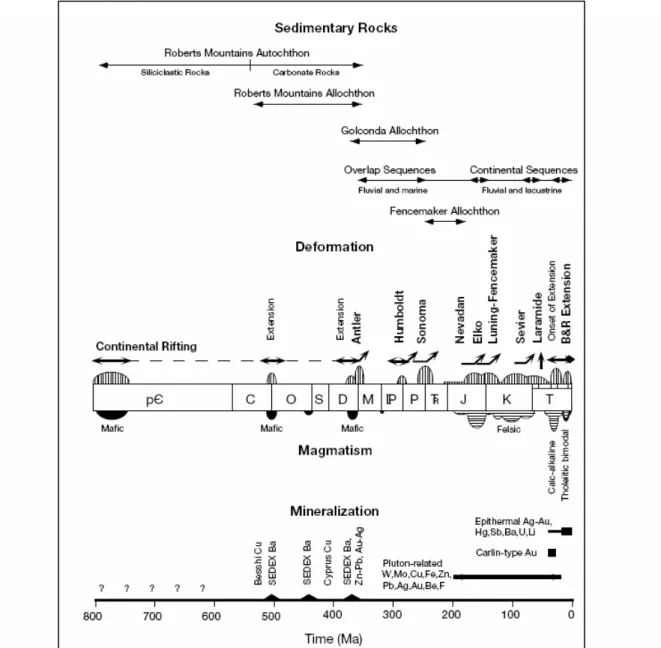
The Carlin trend sits in an area with a complex geologic history. The tectonic events that occurred from the Proterozoic to Eocene (Figure 2) were responsible for developing the necessary fluid pathways and traps to form subsequent gold deposits in the region.
The early tectonic history includes rifting of the Archean and Proterozoic basement in the late Proterozoic (John et al., 2003). This rifting produced significant basement faults that served as the major controls on the north-northwest direction of the trend. Archean crust currently underlies the deposits in the northern Carlin trend (Tosdal et al., 2000).
A period of late Proterozoic rifting was followed by several compressional events associated with an east-dipping subduction zone from the middle Paleozoic to early Tertiary. The compressional events were related to the Antler, Humbolt, Sonoma, Nevadan, Elko, Sevier, and Laramide orogenies (John et al., 2003; Cline et al., 2005).
The late Devonian through early Mississippian Antler orogeny was responsible for forming the Roberts Mountains thrust. Eugeoclinal sedimentary rocks were thrusted eastward onto sedimentary rocks of the continental shelf from the west (Roberts et al., 1958; Stewart, 1980), leading to the development of a foreland basin. The foredeep of the basin was filled with early Mississippian and Pennsylvanian sedimentary rocks (Poole et al., 1992).
Thrust faults are an important control on the location of deposits in the Carlin trend. Most giant deposits in the trend are found within 100 m of a thrust or its projection
Figure 2: Summary of the tectonic history for western North America. Opposing arrows indicate periods of rifting and bent arrows indicate compressional events (from John et al., 2003).
(Cline et al., 2005). Synsedimentary faults that developed during the Paleozoic are probably a reactivation of earlier basement faults. These faults sometimes spatially control abrupt facies changes. They also appear to have formed significant fluid conduits that were sporadically utilized by diagenetic and hydrothermal fluids from the Paleozoic to the recent. Normal faulting uplifted the platform margin during deposition, creating shallow-water conditions resulting in carbonate sediments/rocks being exposed to
dolomitization in a sabkha environment under arid conditions, or to karsting and collapse under more humid conditions. This exposure would have led to increased permeability and porosity, which are necessary for later fluid flow and mineralization (Armstrong et al., 1998; Cline et al., 2005).
The Humbolt and Sonoma orogenies occurred during the Pennsylvanian to early Triassic, resulting in shortening, extension and the emplacement of the Golconda allochthon (Ketner, 1977; Theodore et al., 2004).
By the middle Triassic, an east-dipping subduction zone was located along the western margin of North America, resulting in the beginning of volcanic activity in north-central Nevada (Stewart, 1980). As calc-alkaline, back-arc volcanic complexes and lamprophyre dikes were emplaced in the middle Jurassic, the Elko orogeny produced east-verging folds and thrusts (Thorman et al., 1991). Magmatism continued until 65 Ma and plutons evolved from I-type granitoids to S-type peralumininous granites in the late Cretaceous. The late Cretaceous Sevier and Laramide orogenies resulted in overall thickening of the crust (Barton, 1990).
Beginning in the late Eocene, extensional deformation was the dominant tectonic regime in the region. The direction of extension shifted from northwest-southeast in the
late Eocene to middle Miocene, to west-southeast-east-northeast in the middle Miocene. These changes were followed by another shift to the northwest-southeast in the late Miocene to present (Zoback et al., 1994).
High K calc-alkaline magmatism began ~42 Ma as the Farallon plate retreated and the hot asthenosphere mantle regained contact with the base of the North American lithosphere (Armstrong and Ward, 1991; Seedorff, 1991; Henry and Boden, 1998). This last extensional period resulted in the current Basin and Range province, as well as the crustal fluid flow responsible for the majority of gold mineralization in the Carlin trend between ~42 and 36 Ma (Evans, 1980; John et al., 2003).
Stratigraphy
Sedimentary rocks located in the northern Carlin trend can be divided into two main sequences separated by the Roberts Mountains thrust: 1) the lower plate
autochthonous rocks; and 2) the upper plate allochthonous rocks. The autochthonous rocks are the main hosts of gold deposits and include the Roberts Mountains Formation, the Popovich Formation, and the Rodeo Creek unit (Figure 3).
The Silurian-Devonian Roberts Mountains Formation ranges in thickness from 1100 to 1500 ft. (340 to 460 m) and has several members and units. The members include a Laminated Micritic Limestone member and an Apron Facies member (Furley, 2001).
The Laminated Micritic Limestone member consists of a thick sequence of alternating light and dark, laminated silty limestone to calcareous siltstone with the laminations ranging in thickness from less than one inch (2.5 cm) to several inches. The Apron Facies contains three units similar to the Laminated Micritic Limestone member
Figure 3: Tectonostratigraphic column of the northern Carlin trend illustrating the time-equivalent Bootstrap limestone unit and the Roberts Mountains and Popovich Formations (from Emsbo et al., 2003).
described above, but with increasing occurrence of thin to thick debris flows containing reef, shoal, and slope-derived sediments, along with interbedded wispy textures due to bioturbation and eventual loss of laminations (Furley, 2001).
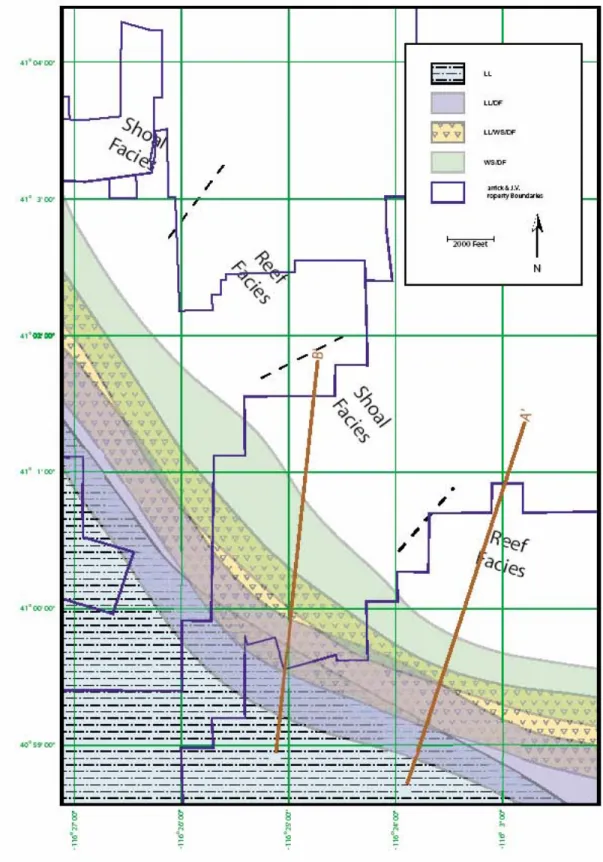
The Bootstrap subunit, a massive, shallow-water limestone, is contemporaneous with the upper part of the Roberts Mountains Formation (Upper Silurian) and the Popovich Formation (Middle Devonian) (Jory, 2002). The Bootstrap limestone is composed of two facies representing deposition along a platform margin: a massive limestone with visible crinoids and ooids (shoal facies), and a massive light to dark gray limestone with visible crinoids, corals, bryozoans, mollusks, gastropods and algae (reef facies) (Figures 4 and 5) (Furley, 2001). The Bootstrap limestone is up to 2000 feet (610 m) thick at the northern end of the Carlin trend and thins to the south (Jory, 2002).
This project focuses on the Bootstrap limestone, with samples collected from around four deposits (Figure 6). This unit can be a significant ore host as the Meikle, Bootstrap-Capstone, Storm (Dee-Rossi) and recently discovered South Arturo deposits are all hosted in a silicified breccia within the Bootstrap limestone or at the upper contact of the Bootstrap (sections, Figure 7).
The Bootstrap was chosen for study because of its low original porosity and permeability that should have restricted the flow of hydrothermal fluids. Such restricted flow should have resulted in a condensed sequence of hydrothermal alteration in
comparison to coeval units with higher porosities and permeabilities (i.e., Roberts Mountains and Popovich Formations).
The Devonian Popovich Formation is a 500 to 800 foot (150 to 250 m) thick unit containing several members. Overall, the unit is a dark gray to black mudstone to
Figure 4: Distribution map of shoal and reef facies illustrating facies changes within the Bootstrap limestone (shown as white area on map) (from Furley, 2001).
Figure 5: Cross section B-B’ thr
ough the shallow sloping Bootstrap
shoal f
acie
s illus
tr
ating the rela
tion
ship between the Bootstra
p
lim
estone unit and the Roberts Mo
untains Form
ation (from Furley,
2001). The m
ajority of sam
p
les in this study com
e from
the shoal
facies.
B
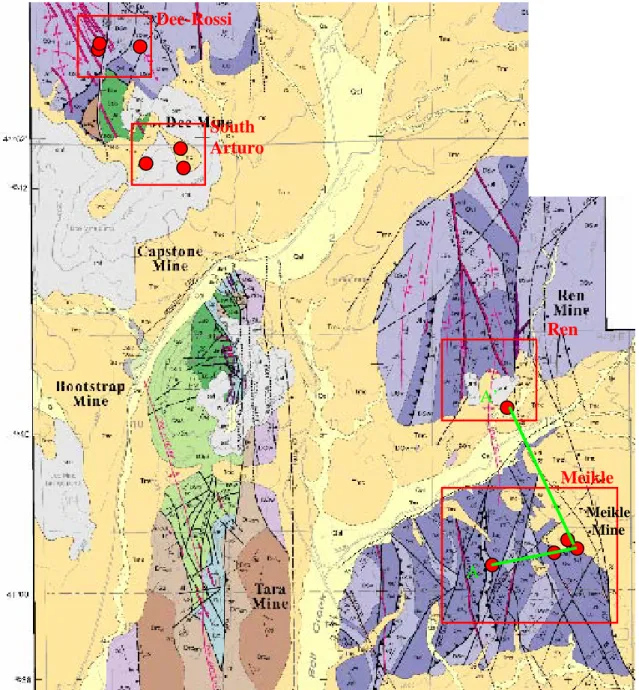
Figure 6: Geological map of the Carlin trend with an enlarged area indicating the study area and a simplified map illustrating deposit locations (Moore, 2002; Barrick Gold Corporation, 2005). Purple circles on the geologic map show the locations of drill holes logged for this study. Main units of the geologic map include Miocene Carlin
Formation (tan), Devonian Slaven Chert and Silurian Elder Formation (light purple), and Ordovician Vinini Formation (purple). This study focuses on the region near the deposits of Meikle, Ren, South Arturo, and Dee-Rossi (Storm).
Meikle Ren Rossi Storm Dee S. Arturo Rodeo North Post North Pit Betze-Post 4 miles 6.5 km Study Area Figure 6 Meikle Mine
Figure 7: Cross sections from three deposits near which samples were collected. Cross sections show the relationship of the Bootstrap limestone unit relative to mineralization (a) Storm deposit (modified from Dobak et al., 2002); (b) Meikle deposit (modified from Emsbo et al., 2003); (c) South Arturo deposit (modified from Barrick Gold Corporation, 2005).
? 500 m No vertical exaggeration 60 m No vertical exaggeration 150 m No vertical exaggeration Silurian-Devonian Bootstrap limestone Ferroan dolomite
Devonian Popovich Formation Ordovician Vinini Formation Tertiary Carlin Formation
Jurassic lamprophyre dike Jurassic monzonite dike Devonian Rodeo Creek Formation
Silicified breccia Silica-Sulfide breccia
Au orebody/intercepts Tertiary volcanic rocks
(b)
(c) (a)
siltstone with textures varying from wispy to thinly interbedded with debris flows containing fossil hash to soft-sediment deformation to very common thinly laminated units. The sequence of units indicates deepening throughout deposition (Furley, 2001).
Conformably overlying the Popovich is the dark gray Devonian Rodeo Creek unit composed of gray siltstone, mudstone, chert and argillite along with upper units
composed of siliceous mudstone, siltstone and calcareous siltstone. The unit is 800 feet (250 m) thick, although there are areas where the entire upper part of the unit has been removed by the Roberts Mountains thrust (Teal and Jackson, 1997).
Above the thrust, the allochthonous sequence is primarily composed of the 5,000 foot (1500 m) thick Vinini Formation consisting of Lower Ordovician to Middle Silurian sedimentary chert, mudstone, siliceous mudstone, and minor greenstone. This unit hosts small, fault-controlled, vein deposits (Jory, 2002).
Structure
The north-northwest trend in mineralization reflects the young north-trending Basin and Range topography intersecting a pre-existing zone of crustal weakness. These structures controlled mineralization throughout the Carlin trend in various forms. The dominant controlling structures are northwest faults, northeast faults, anticlinal folds, and collapse breccia bodies.
In the Carlin trend, northwest-striking, high-angle structures are the dominant feature and served as primary fluid conduits for the Tertiary hydrothermal systems. Lamprophyric and monzonitic dikes commonly fill these faults (Teal and Jackson, 2002). In the study area, the Ren, Post, Dee, and Hinge structures are the main faults.
Northeast-striking faults are particularly important where they intersect northwest-striking faults, as they acted as structural fluid traps, focusing gold mineralization. Dikes rarely fill these faults (Teal and Jackson, 2002).
The general trend of folds in the region is northwest, although some are north- or northeast-trending (Volk et al., 1996; Teal and Jackson, 2002). The north-south trending faults are less common and are related to thrust faulting. Folds have broad to moderate amplitudes with mesoscopic northwest-southeast-trending hinges. These folds are well developed in the Rodeo Creek and Vinini Formations, possessing intensely fractured and veined fold hinges (Volk et al., 1996). These mesoscopic folds are associated with northwest-trending anticlines and synclines that acted as traps for migrating fluid on a regional scale (Teal and Jackson, 2002).
Collapse breccia bodies have various interpretations, but mainly are responsible for an increase in permeability for gold-bearing fluids, regardless of the formation mechanism for the breccia (Teal and Jackson, 2002). Evans (2000) explored progressive brecciation events at the Meikle deposit, where five separate brecciation events occurred, including brecciation related to early karsting of the massive limestone by meteoric water, followed by hydrothermal dissolution and subsequent collapse.
Paleozoic Mineralization Event
Following initial diagenesis and brecciation of the Bootstrap limestone, a
Paleozoic mineralization event resulted in early ferroan dolomitization and silicification of the limestone. The base-metal event at Meikle is fault controlled and is interpreted as
being a Mississippi Valley-type deposit. This alteration was followed by late base-metal mineralization and barite precipitation (Evans, 2000).
Ferroan dolomite alteration occurred with minor disseminated pyrite ± sphalerite along with silicification of the early dolomite. Zebra texture, alternating white and black bands of dolomite, formed during this event. The black bands are typically ferroan and the white bands can range from non-ferroan to ferroan. Silicification was pervasive during this stage, replacing the majority of limestone with quartz. The location of this jasperoid indicates that silicification was peripheral to dolomite alteration (Evans, 2000).
Base-metal mineralization preferentially replaced ferroan dolomite with
sphalerite, minor galena, chalcopyrite, and pyrite. Following base-metal mineralization, the formation of veins of barite ± dolomite, calcite, quartz, and honey-colored sphalerite veins occurred (Evans, 2000).
The base-metal event was followed by silicification, hydrocarbon migration, and stylolitization. Veins that contain bitumen, quartz and/or calcite cross-cut massive limestone, dolomitized limestone, and jasperoids. The timing of these brecciation and mineralization events are constrained by cross-cutting relationships with Jurassic dikes (Evans, 2000).
Cretaceous Mineralization Event
During the late Jurassic there was a period of igneous activity, polymetallic
mineralization and alteration of intrusive rocks. Mineralization included quartz veins with galena, bournonite, freibergite, pyrite, sphalerite, chalcopyrite, covellite, minor
The alteration associated with this event is principally preserved in the intrusive rocks. Alteration in the monzonite dikes was most pervasive, and included feldspar altering to illite and kaolinite, quartz precipitation, and replacement of sphalerite by pyrite. Lamprophyre dikes contain calcite, dolomite, magnesite, chlorite, quartz, illite, and talc as alteration products (Evans, 2000; Emsbo et al., 2003).
A second Cretaceous hydrothermal event is more common in southern portions of the Carlin trend and is characterized by Cu mineralization and sericitic alteration (Arehart et al., 1993; Drews-Armitage et al., 1996; Teal and Branham, 1997).
Tertiary Mineralization Event
Gold in the Carlin trend occurs primarily in the lattices of pyrite and arsenian pyrite as submicron particles with concentrations as high as ~9,000 ppm (Wells and Mullens, 1973; Emsbo et al., 2003; Palenik et al., 2004; Reich et al., 2005). The gold-bearing pyrite and marcasite typically occur as discrete grains a few micrometers in diameter or as rims on earlier-formed pyrites. The types of deposits in the trend vary greatly with structural controls to lithologic controls to breccias with great range in terms of grade and deposit size (Emsbo et al., 2003).
The mineralizing fluids that precipitated gold were probably low to moderate temperature (180-240ºC), low salinity (~2-3 wt % NaCl equivalent), aqueous fluids containing CO2 (<4 mol %) and CH4 (<0.4 mol %), and 10-1-10-2m H2S (Cline and
Hofstra, 2000; Hofstra and Cline, 2000; Lubben, 2004). Precipitation of Au and
formation of pyrite are considered to have been controlled by the reaction of sulfur in the fluid with Fe in the host rocks. Though sulfidation is commonly described as the most
important control on Au mineralization, the presence of bitumen in high-grade ore indicates a reaction between the bitumen and Au-bearing fluids (Kuehn and Rose, 1992; Stenger et al., 1998; Hofstra and Cline, 2000; Fortuna et al., 2003). However, alternate possibilities for the precipitation mechanism are necessary because the sulfidation of Fe-rich host rocks does not produce enough acid to be responsible for the intense
mineralization in high-grade ore (Emsbo et al., 2003).
Varying δDH20 values of the ore fluid indicate three possible origins. Possible
sources include meteoric, magmatic or metamorphic fluids (Hofstra et al., 1999; Cline and Hofstra, 2000; Emsbo et al., 2003; Lubben, 2004). The range of values may be explained by mixing among all three or that different regions of the trend have different sources. Sulfur in the ore-stage fluid has a broad range of isotopic values, indicating a sedimentary source that utilized several pathways to derive H2S (Hofstra and Cline, 2000;
Emsbo et al., 2003). H2S could have been produced by dissolution of pyrite, destruction
of organosulfur compounds, thermochemical sulfate reduction, and/or desulfidation of pyrite to pyrrhotite. As the principle transporter of Au in fluid, the source of S could give insight to the source of Au (Cline et al., 2005).
The timing of mineralization has been cautiously agreed upon as Eocene (~42 Ma to 36 Ma), although constraining the age has been a subject of debate (Ressel et al., 2000; John et al., 2003; Cline et al., 2005). Some authors suggest that the varying ages from the region indicate multiple periods of gold mineralization (Teal and Jackson, 1997).
The lack of evidence for fluid boiling and ore-fluid phase-equilibria parameters constrain the possible depth for ore deposition. Depth of gold deposition is thereby
constrained to a minimum depth between ~1.7 km and 6.5 km and a maximum depth no greater than 5 to 8 km (Hofstra and Cline, 2000).
The multiple possibilities for the origin of the ore-bearing fluid and source of gold create several possible genetic models. These include a meteoric water model with lateral flow of meteoric water or deep crustal meteoric convection (Ilchik and Barton, 1997; Emsbo et al., 2003); an epizonal intrusion model that relates Carlin deposits to epizonal plutons (Sillitoe and Bonham, 1990; Johnston and Ressel, 2004); and a deeply sourced ore-fluid model that requires a magmatic or metamorphic water source (Seedorff, 1991; Hofstra and Cline, 2000). Although still debated, the genetic model for these deposits probably consists of a combination of elements from the previously mentioned three models (Cline et al., 2005).
Cline et al. (2005) suggested a genetic model for Carlin-type deposits that
involves hydrothermal fluids exsolved from lower crustal melts formed by mafic magmas injected into the lower crust during the Eocene. This hydrothermal fluid, along with possible metamorphic fluids, scavenged Au and other trace metals from the
Neoproterozoic rocks as it moved upward.
Aqueous hydrothermal ore fluids became enriched in H2S through interactions
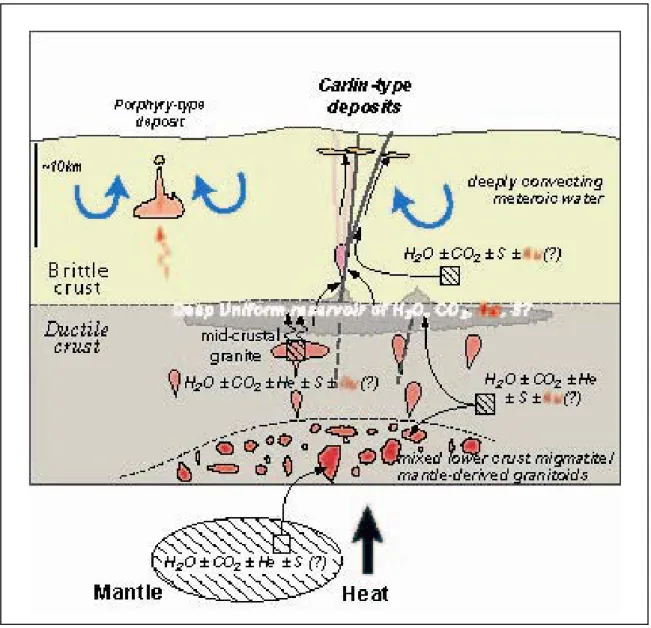
with wall rocks as they flowed along faults, causing the scavenging of Au. These ore fluids were then diluted by deeply convecting meteoric waters (Figure 8). The ore fluids collected along the boundaries of stocks and in structural traps. The fluids increased permeability through decarbonatization and argillization of wall rocks through which they flowed. This interaction with the wall rocks also exposed available Fe, which led to
Figure 8: Genetic model for Carlin-type deposits combining elements from magmatic and meteoric models to explain how hydrothermal fluids evolve to become ore fluids and possible sources for Au (from Cline et al., 2005).
sulfidation and pyrite precipitation. Precipitation of pyrite decreased the aH2S in the ore
fluids and Au was co-precipitated with pyrite.
The final stages of fluid flow in the Carlin trend included a reduction in ore fluids and mixing and cooling of fluids caused by the collapse of unexchanged meteoric fluids into the system (Cline et al., 2005).
Alteration
Characteristic alteration of Carlin-type deposits includes decarbonatization, argillization, silicification, and sulfidation. Alteration of the carbonate host rocks includes dolomitization, ferroan dolomitization, cement precipitation, and silicification.
Decarbonatization is common for all deposits in the trend and the degree of
decarbonization was controlled by the fluid acidity, the amount of cooling, and the degree of fluid-rock interaction (Hofstra and Cline, 2000; Cline et al., 2005). Dissolution of carbonate host rocks possibly led to collapse breccias prior to gold mineralization to form high-grade ore in some deposits (Emsbo et al., 2003).
Assemblages of kaolinite ± dickite ± illite formed where older alumino-silicate minerals and acidic ore fluids interacted. Argillization is uncommon in the carbonate rocks, but is intense in basalts, lamprophyres, and other igneous rocks (Hofstra and Cline, 2000).
Silicification is widespread in the form of jasperoids and drusy quartz-lined vugs. The occurrence of jasperoids appears to be associated with the presence of ore, although jasperoids can range from barren to high-grade ore (Bakken and Einaudi, 1986; Ye et al., 2002). The vugs that are later lined by quartz formed by dissolution of the carbonate host
rocks. The lack of quartz as an ore-stage mineral probably reflects the low temperature of mineralizing fluids, given that quartz precipitation is inhibited below ~180 ºC (Rimstidt, 1997; Cline et al., 2005).
RESEARCH RESULTS
This study compiled detailed hand specimen, petrographic, cathodoluminescent (CL), and isotopic descriptions of carbonate alteration occurring within the Bootstrap limestone formation. Samples from 11 drill holes throughout the study area were used in the descriptions (Figure 9; Table 1). Six carbonate phases were found to be important variations in the Bootstrap limestone. This included original limestone, diagenetic-planar dolomite, saddle dolomite, ferroan dolomite, zebra texture dolomite, and late calcite.
Limestone
Two facies are recognized within the Bootstrap limestone unit: a shoal facies and a reef facies. Samples for this study came from a large area, but are predominantly from the shoal facies. The best samples of least-altered limestone are from near the Meikle deposit. Completely unaltered limestone was unavailable in the study area because of the presence of early diagenetic cementation.
In core, the Bootstrap limestone shoal facies is a massive, light- to medium-gray limestone with visible ooids and crinoids (Figure 10). The reef facies is also medium-gray, but with visible crinoids, corals and reported mollusks, bryozoans, and gastropods (Furley, 2001).
Thin-section analysis shows the shoal facies is dominated by coarse-grained, well-sorted oolitic to peloidal grainstone with low porosity (<3%), 3-5% early dolomite, and rare stylolites. The matrix is a coarsely crystalline equant calcite spar cement (Figure 11).
South Arturo Ren Meikle Dee-Rossi A A’ Meikle Mine
Figure 9: Locations of the 11 drill holes sampled are marked by green circles (modified from Moore, 2002). The drill holes were selected for their intervals of Bootstrap
Deposit Description Logged Drill Holes Meikle
Silicified breccia-hosted deposit (Emsbo et al., 2003) Ex-21c; MST-1; GA-65c; U17-M05-3 Ren Active exploration: possible breccia-hosted similar to Meikle, historically, mineralized dike, stratabound mineralization in Popovich Formation (Farquharson et al., 2004) RU-8 Dee-Rossi (Storm) Silicified heterolithic breccia-hosted (Dobak et al., 2005) D2-100-2; D0-100-1 South Arturo Active exploration:
Breccia-hosted, oxide gold deposit (Hipsley et al., 2007)
BD-131; BD-181; BD-177; BD-178
Table 1: Deposit areas, type of deposit, and drill holes that were used in this study. The four deposits are similar in that they are hosted in breccia bodies within or at the top contact of the Bootstrap limestone. South Arturo and Ren deposits are still being actively explored and deposit types are not fully established.
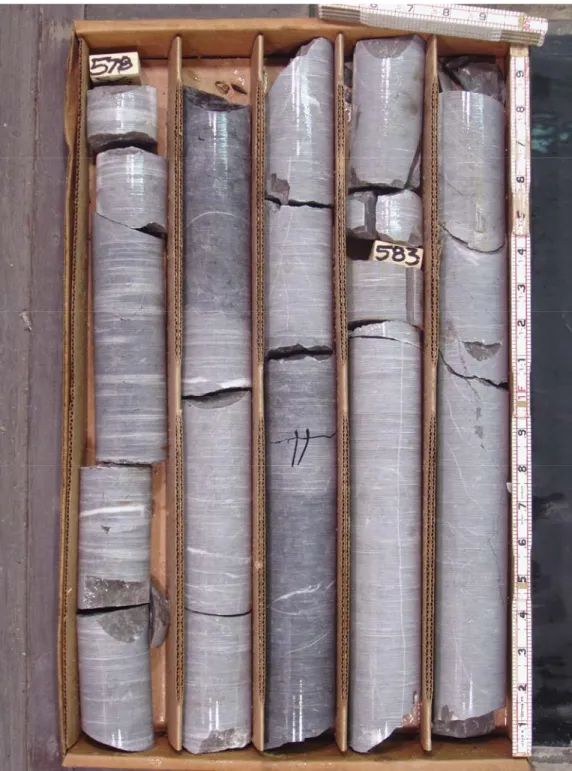
Figure 10: Core of the massive, gray, oolitic grainstone with calcite veining from the shoal facies of the Bootstrap limestone.
(a)
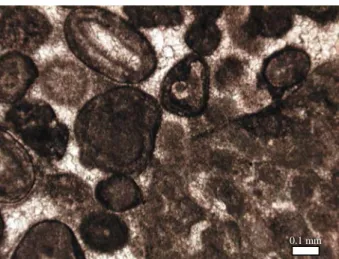
(b)
Figure 11: Typical limestone samples from the Bootstrap limestone. (a) Sample from Evans (2000), Photomicrograph showing a peloidal grainstone with micritized peloidal grains and early equant calcite cement; plane-polarized light. (b) U17-M05-3, 382’, Photomicrograph of an oolitic grainstone with early calcite cement; plane-polarized light.
0.1 mm 0.1 mm
The reef facies is a coarse-grained, moderately sorted oolitic grainstone to fossiliferous boundstone with possible skeletal grains including crinoids, bryozoans, gastropods and brachiopods (Furley, 2001).
Cathodoluminescence imaging shows dully luminescent grains with locally brightly luminescent rhombohedral dolomite crystals along the edges of grains, dull early calcite cement, and destructive, brightly luminescent calcite veins (Figure 12).
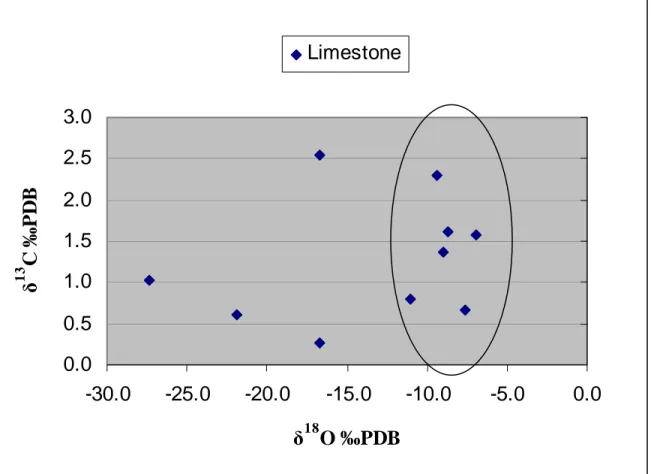
Stable isotopic data for limestone samples mainly fall between δ18O values of -11.0 to -6.7 ‰PDB (mean -8.8 ‰PDB) and δ 13C values of 0.7 to 2.3 ‰PDB (mean 1.4 ‰PDB) (Figure 13).
Diagenetic-Planar Dolomite
Complete replacement of the limestone by diagenetic-planar dolomite only is seen in the deeper drill holes near the Meikle and Ren deposits (Figure 14). These drill holes do not intersect any degree of mineralization, but do extend through a thick section of the Bootstrap limestone unit. In vertical drill holes GA-65c, U17-M05-3, and RU-8, the top of the Bootstrap is limestone with the percentage of dolomite increasing with depth. In GA-65c diagenetic-planar dolomite begins at an elevation of ~2450 ft, in U17-M05-3 at ~2950 ft., and in RU-8 at ~1950 ft.
In core, there is very little variation between the appearance of limestone and diagenetic-planar dolomite (Figure 15). Diagenetic-planar dolomite is typically non-mimetic, although locally ooids are still visible in hand specimens. Overall, diagenetic-planar dolomite is medium-gray, giving it a slightly darker appearance than the
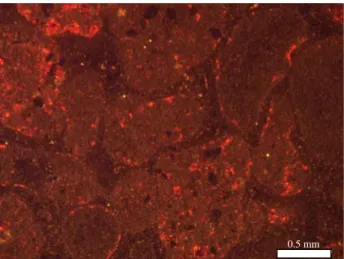
Figure 12: U17-M05-3, 6’, Cathodoluminescence image of limestone showing dully luminescent calcite cement and peloids, and brightly luminescent dolomite crystals.
0.0
0.5
1.0
1.5
2.0
2.5
3.0
-30.0
-25.0
-20.0
-15.0
-10.0
-5.0
0.0
δ
18O ‰PDB
δ
13C ‰
P
DB
Limestone
Figure 13: Plot of isotopic data for limestone samples. Samples representing the end-member limestone values are circled.
Figure 14: Location map for drill holes with diagenetic dolomite occurrences marked by blue circles (modified from Moore, 2002). Notice that diagenetic dolomite is not encountered near South Arturo or Dee-Rossi.
Meikle Mine
Figure 15: Core of the contact between limestone and diagenetic dolomite in U17-M05-3. There is a slight color change to darker gray, but otherwise limestone and diagenetic dolomite look very similar in core.
Contact Limestone
limestone. The dolomite is also commonly stylolitic. In hand sample, use of HCl is the easiest way to distinguish between limestone and diagenetic-planar dolomite.
The dolomite that occurs in these holes is rhombohedral (planar-e) with cloudy to clear centers, and is medium to finely crystalline with low porosity (2-3%), and stylolites occurring locally to commonly (Figure 16). Most limestone samples have at least a small, scattered occurrence of dolomite crystals that do not have a preference to replace grains or cement. The dolomite also occurs as very finely crystalline replacement in the original grains. Overall, this dolomite replacement is destructive of the original fabric, but sample U17-MO5-3, 820.5’ is completely dolomitized with the ooid structure clearly preserved (Figure 16c).
Cathodoluminescence imaging reveals consistently brightly luminescent dolomite. In limestone that has not been completely replaced by dolomite, dolomite rhombs are concentrated primarily around the edges of original grains as seen in limestone samples discussed above (Figure 17).
Diagenetic-planar dolomite isotopic data have a moderate range for δ18O from -11.8 to -4.2 ‰PDB (mean -8.4 ‰PDB) and δ13C from -0.4 to 1.6 ‰PDB (mean 0.8 ‰PDB). There are three apparent groupings in the data. The three clusters of data have similar δ13C values, and δ18O averages for each group are about -5.0 ‰PDB, -8.0 ‰PDB, and -11.0 ‰PDB (Figure 18). These clusters reflect, respectively, samples with complete recrystallization, partial recrystallization and those trending towards saddle dolomite.
Figure 16: Photomicrographs of diagenetic samples illustrating partial (a, b, d) and complete replacement (c, e) of limestone. (a) U17-M05-3, 785’, Photomicrograph of planar-e diagenetic dolomite with cloudy centers filling space occupied by calcite cement (stained pink); plane-polarized light; (b) GA-65c, 3703’, Photomicrograph of planar-e dolomite rhombs with cloudy centers in limestone with original grains and calcite cement (stained pink); plane-polarized light; (c) U17-M05-3, 820’,
Photomicrograph of mimetic, planar-s to planar-e dolomite replacing oolitic grainstone, with dead oil in pore space; plane-polarized light; (d) RU-8, 3502’, Photomicrograph of a contact between finely crystallized, planar-s to planar-e dolomite and calcite (stained pink); plane-polarized light; (e) U17-MO5-3, 1380’, Photomicrograph of complete replacement of limestone with medium to finely crystalline, planar-s to planar-e dolomite; plane-polarized light.
(d) (e) (a) (b) (c) 0.1 mm 0.1 mm 0.1 mm 0.1 mm 0.1 mm 0.1 mm Figure 16
(a) (b)
(c) (d)
Figure 17: Cathodoluminescence images of uniformly, brightly luminescent diagenetic dolomite. (a) U17-M05-3, 382’, CL image showing diagenetic dolomite brightly
luminescent crystals along the edges of peloids and calcite cement as dully luminescent; (b) U17-M05-3, 820’, CL image of mimetic dolomite brightly luminescent and dead oil in the center of a relic ooid; (c) U17-M05-3, 785’, CL image of planar-e dolomite rhombs moderately to brightly luminescent; (d) RU-8, 3502’, CL image of dolomite brightly luminescent; calcite dully luminescent.
Calcite
0.5 mm 0.5 mm
0.5 mm 0.15 mm
-0.5
0.0
0.5
1.0
1.5
2.0
-15.0
-10.0
-5.0
0.0
δ
18O ‰PDB
δ
13C ‰
P
DB
Diagenetic-Planar Dolomite
Figure 18: Isotopic data for diagenetic dolomite samples with three clusters of values circled. Circle (a) are samples with complete replacement of limestone; circle (b) are
samples with partial replacement of limestone and circle (c) are samples with curved crystal boundaries (saddle-type dolomite).
(a) (b)
Saddle Dolomite
Saddle (or baroque) dolomite occurs in drill holes near the Dee-Rossi, Meikle, and South Arturo deposits (Figure 19). The amount of saddle dolomite observed in each drill hole increases in brecciated areas and areas proximal to Jurassic igneous intrusions. Saddle dolomite can occur as cement or as a replacement of precursor carbonate.
In core, coarse saddle dolomite ranges in color from white to gray to light pink. Core containing saddle dolomite is pervasively fractured or occurs in breccias with thin (<1 mm wide) black, sooty sulfide fracture fill or 1 mm wide calcite veins with vugs common in the center of the veins (Figure 20). Saddle dolomite occurs commonly in close proximity to igneous clasts.
In thin-section, samples of saddle dolomite from the study area range from clear to light brown in plane-polarized light, and contain polymodal, non-planar, saddle dolomite with strong sweeping extinction, to planar-s saddle dolomite with weak sweeping extinction. Rock samples with abundant saddle dolomite display low porosity (~5%) and very few stylolites (Figure 21).
Cathodoluminescence analysis shows dissolution areas of the saddle dolomite and moderately to brightly luminescent saddle dolomite with common calcite veining (Figure 22).
Isotopic data for saddle dolomite shows values from the Dee-Rossi area in ranges of δ18O from -14.1 to -9.5 ‰PDB with a mean of -11.2 ‰PDB and δ 13C from 0.3 to 1.1 ‰PDB with a mean of 0.6 ‰PDB. Outliers on the plot are from near Meikle and Ren
Figure 19: Locations of saddle dolomite are marked by blue circles proportionally sized to amount of saddle dolomite recognized in the core (modified from Moore, 2002). The largest circles are closest to structures and/or ore bodies with the smallest circles
representing occasional occurrences in drill holes that are not near structures or ore bodies.
Meikle Mine
Figure 20: Hand samples of saddle dolomite occurring as a vein (a) or pervasively fractured (a) Core of GA-65c, 1825’, massive, gray styolitic limestone with white saddle dolomite vein; (b) Core of U17-M05-3, 116’, intensely fractured saddle dolomite with the beginning of zebra texture and sooty fracture fill.
(a)
(b)
Saddle dolomite vein
Early zebra texture development?
(a) (b)
(c)
Figure 21: Photomicrographs illustrating the texture of saddle dolomite. (a) U17-M05-3, 116’, Photomicrograph of non-planar, polymodal saddle dolomite with strong sweeping extinction; crossed-polarized light; (b) U17-M05-3, 116’, Photomicrograph of weak development of coarse and finely crystalline bands of saddle dolomite occurring with sulfides; plane-polarized light; (c) D2-100-2 150.3’, Photomicrograph of planar-s to non-planar, polymodal saddle dolomite with weak sweeping extinction; Typical example from Dee-Rossi area; crossed-polarized light.
0.1 mm 0.1 mm
Figure 22: Cathodoluminescence microscopy reveals dissolution textures and intense calcite veining of saddle dolomite. (a, b) U17-M05-3 116’, CL images showing
dissolution texture and veining in a moderately to brightly luminescent saddle dolomite; (c) U17-M05-3, 150.3’, Moderately luminescent saddle dolomite with bright calcite veining; (d) MST-1 1214: CL image of moderately to brightly luminescent saddle dolomite and dull calcite, which is replacing the saddle dolomite.
(c) (a) (b) (d) 0.5 mm 0.5 mm 0.5 mm 0.5 mm
and have δ18O ‰PDB values averaging -16.4 ‰PDB and light δ 13C values average -2.7 ‰PDB (Figure 23).
Ferroan Dolomite
Ferroan dolomite occurs in drill holes intersecting or near the Meikle or Dee-Rossi deposits (Figure 24). Ferroan dolomite is discontinuous in the drill holes sampled for this study and most occurs in or within several feet of brecciated zones. Such breccia zones can be one or two hundred feet in vertical extent.
In core, ferroan dolomite is similar in texture and in color to saddle dolomite. However, ferroan dolomite is most common in rocks with quartz flooding. Zones containing ferroan dolomite are commonly intensely fractured with sooty black sulfide fracture fill. Ferroan dolomite in these zones is white to pink in color and is commonly intergrown with quartz (Figure 25).
Thin-section analysis shows the ferroan saddle dolomite is texturally very similar to saddle dolomite. Ferroan dolomite is non-planar, polymodal and has sweeping
extinction, but tends to occur with quartz (up to 60% quartz) more commonly than non-ferroan saddle dolomite. Rocks containing non-ferroan dolomite have 5-10% porosity and few stylolites (Figure 26).
Cathodoluminescence images for ferroan dolomite are almost identical to CL images taken of saddle dolomite. Ferroan dolomite is moderately luminescent with pervasive dissolution and corroded crystal edges (Figure 27).
Ferroan dolomite isotopic data show most samples clustering between δ18O values -10.2 and -13.5 ‰PDB (mean -12.9 ‰PDB) and δ 13C values 2.0 to 1.6 ‰PDB (mean
--4.0
-3.0
-2.0
-1.0
0.0
1.0
2.0
-20.0
-15.0
-10.0
-5.0
0.0
δ
18O ‰PDB
δ
13C ‰
P
DB
Saddle Dolomite
Figure 23: Plot of values for saddle dolomite isotopic data illustrating the close clustering of the majority of samples with a trend towards depleted δ13C values.
Figure 24: Locations of ferroan dolomite occurrences recognized in this study are marked by blue circles proportional to amount of ferroan dolomite observed (modified from Moore, 2002). Similar to saddle dolomite, ferroan dolomite only occurs near structures or ore bodies.
Meikle Mine
Figure 25: Hand samples of various ferroan dolomite samples. The samples vary significantly in color from gray to pink to white and in fracture intensity. (a) Ex-21c, 1024’, Core of finely crystalline, dark ferroan dolomite, coarse, white quartz, and gray to white saddle dolomite vein; (b) D0-100-1, 109’, Core of fractured ferroan dolomite with iron oxidation of the fractures; (c) D2-100-2, 266.4’, Core of off-white ferroan dolomite with calcite veining; (d) D2-100-2, 4’, core of fractured, stylolitized, breccia ferroan dolomite with muddy clasts and silica flooding (blue coloring is stain).
(a) (b) (c) (d) Quartz Ferroan dolomite Saddle dolomite Pyrite
Figure 26: An example of the fabric and texture of ferroan dolomite. D0-100-1, 109’, Photomicrograph of planar-s to non-planar, polymodal ferroan saddle dolomite; cross-polarized light.
Figure 27: Cathodoluminescence analysis illustrates the dissolution and fracturing of ferroan dolomite. (a) D2-100-2, 4’, CL image of ferroan dolomite, moderately luminescent, brightly luminescent material is calcite; (b) BD-52, 1238’, CL image of moderately luminescent ferroan dolomite with dissolution vugs; (c) D0-100-1, 109’, CL image of moderately luminescent ferroan dolomite with quartz vein (nonluminescent)
(b) (c) (a) Qtz 0.5 mm 0.5 mm 0.5 mm
0.8 ‰PDB) (Figure 28). A few samples from the Meikle area show depleted values for both δ 13C and δ18O.
Zebra Dolomite
Zebra dolomite is not well represented by the samples in this study. Only two samples were collected: one from the Dee-Rossi area and the other from Meikle (Figure 29). In these samples, zebra texture is not particularly well developed. To supplement isotopic data, samples from Dane Evans’ master’s thesis (Evans, 2000) on the Meikle deposit were used.
The alternating white and gray bands that characterize zebra dolomite are
typically irregular and vary in width. The dolomite is coarse, non-planar saddle dolomite in the white bands, and is fine, non-planar dolomite occurring with sulfides and organic matter in the gray bands. In the sample with poorly developed zebra texture, the bands are thin and irregular (gray bands <0.5 mm; white 1 mm wide), and the saddle dolomite is finer, planar-s with weak sweeping extinction. The zebra dolomite that is better
developed has thicker bands (gray up to 4 mm; white up to 5 mm wide) and is non-planar with strong sweeping extinction and void space associated with the white bands. Rocks containing zebra dolomite samples have 10% quartz, ~3% porosity and typically have few stylolites, although stylolites are common in the poorly developed zebra texture from Dee-Rossi (Figures 30 and 31).
Cathodoluminescence images show the gray bands with gray, non-luminescent material and the white bands as brightly luminescent with bright crystal edges on the dolomite filling the vugs (Figure 32).
-4.0
-3.0
-2.0
-1.0
0.0
1.0
2.0
-20.0
-15.0
-10.0
-5.0
0.0
δ
18O ‰PDB
δ
13C ‰
P
DB
Ferroan Dolomite
Figure 28: Isotopic data for ferroan dolomite samples showing a trend from more enriched δ13
Figure 29: Location of zebra dolomite in drill hole core indicated by blue circles proportional to amount of zebra texture observed (modified from Moore, 2002). Zebra texture is only observed in drill holes directly penetrating ore bodies.
Meikle Mine
Figure 30: Hand samples of zebra texture dolomite samples illustrate the variation in band thickness and continuity. (a) D0-100-1, 312’, Core of poorly developed zebra texture bounded by stylolites with iron oxides, (b) Ex-21c, 1065’, Core of zebra texture with irregular banding, (c) Sample from Evans (2000), Core of zebra dolomite with thick gray and white bands of saddle dolomite.
(b)
(c) (a)
Figure 31: Photomicrographs of zebra textures illustrate the range of fabric and texture seen between poorly developed zebra texture (a, b) and well-developed zebra texture (e, f). (a, b) D0-100-1, 312’, Photomicrograph of poorly developed zebra dolomite with coarse, planar-s saddle dolomite and finely crystalline planar-s saddle dolomite occurring with sulfides; (a) plane-polarized light; (b) crossed-polarized light; (c,d) Ex-21c, 1065’, Photomicrograph of zebra dolomite with non-planar, coarsely and finely crystalline saddle dolomite; (a) plane-polarized light, (b) cross-polarized light; (e,f) Sample from Evans (2000), photomicrograph of well-developed bands of coarse and fine, non-planar, saddle dolomite with high percentages of sulfides and bitumen
0.1 mm 0.1 mm 0.1 mm 0.1 mm 0.1 mm 0.1 mm (c) (d) (e) (f) (b) (a)
Gray band White band Gray band White band
Gray band
White band White band Gray band
Gray band White band Gray band White band
Figure 32: Ex-21c, 1065’, CL images of zebra dolomite: white bands are moderately luminescent with bright edges on the saddle dolomite crystal as the crystals extend into void spaces. The gray bands are the non-luminescent gray areas.
0.5 mm
Isotopic data for each zebra dolomite sample are divided between light and dark bands. The data for each band of one sample plot very closely to each other (Figure 33). The range of δ18O values is small (-15.9 to -11.9, mean -14.2 ‰PDB), but the values for δ 13
C have a wide range from -3.8 to -0.09 ‰PDB (mean -2.2 ‰PDB). Depleted δ 13C values correspond to the samples with well-developed zebra texture.
Calcite
There are several calcite precipitation events evident from petrographic
observations and isotopic data. The earliest calcite is related to early cementation of the limestone, with bladed to equant calcite cementation of grains; this is discussed under the limestone section.
Two more calcite generations are recognized following the early cementation event, and both consist of coarsely crystalline sparry calcite. These generations of calcite occur throughout the study area, although calcite veining is most common in limestone as compared to the dolomites.
In core, calcite fills vugs with crystals up to 5 mm in size, forms large veins several mm wide, and can be the matrix of breccia where coarse calcite supports clasts of limestone (Figure 34).
Thin-section analysis shows that calcite can occur as a cement of coarsely crystalline calcite spar overprinting or destroying original grains. The calcite can also form in veins, fill void spaces and replace skeletal grains (Figure 35a). However, there is significant variation in appearance of calcite veins at this scale. In some samples, the calcite spar is twinned or has clearly defined crystal edges (Figure 35d). In other calcite
-4.5 -4.0 -3.5 -3.0 -2.5 -2.0 -1.5 -1.0 -0.5 0.0 -20.0 -15.0 -10.0 -5.0 0.0 δ18O ‰PDB δ 13 C ‰ P DB
Dark Zebra Dolomite Band Light Zebra Dolomite Band
Figure 33: Zebra texture dolomite isotopic data plot illustrates that the samples with the most developed zebra texture have the most depleted δ18O and δ13C values. For each sample, there is a value for white (light) bands and for gray (dark) bands, which plot directly next to each other.
Figure 34: Hand sample illustrating the void-filling late calcite event. U17-M05-3, 122’, Core of vug filling late calcite in gray limestone. Calcite is also replacing the crinoid fossils in the limestone.
Figure 35: Late calcite photomicrographs show a wide range of fabrics. (a) BD-178, 1436’, Photomicrograph of an edge of a fossil replaced by sparry calcite; crossed-polarized light; (b) GA-65c 3703, Photomicrograph of crossing veins of sparry calcite stained pink; plane-polarized light; (c) U17-M05-3, 122’, Photomicrograph of a calcite vein stained pinked and the surrounding fine-grained quartz; cross-polarized light; (d) U17-M05-3, 580’, Photomicrograph of twinned sparry calcite filling space between grains as well as destroying original limestone texture; cross-polarized light; (e) D2-100-2, 266’, Photomicrograph of a calcite vein stained purple and saddle dolomite; plane-polarized light; (f) BD-178, 1318’, Photomicrograph of a calcite vein (stained purple) and quartz; crossed-polarized light.
0.1 mm Calcite Saddle 0.1 mm Calcite Quartz Calcite (c) (a) (b) (d) (e) (f) Calcite Calcite Quartz 0.1 mm Figure 35 0.1 mm 0.1 mm 0.1 mm
samples, the veins of calcite appear to have undergone partial dissolution that has created irregular crystal shapes (Figure 35c). Calcite can also occur as a replacement of saddle dolomite (Figure 22d).
Cathodoluminescence images of calcite samples show a great variation in CL appearance of individual samples. Calcite is present as brightly to dully luminescent, and can vary from red to yellow in color. CL analysis reveals compositionally zoned cavity-filling calcite, zoned veins, and dissolution features (Figure 36).
Calcite isotopic data show two clusters of values (Figure 37). The first cluster ranges in δ18O values from -13.6 to -4.7 ‰PDB (mean -10.0 ‰PDB) and δ13C values from -0.9 to 2.2 ‰PDB (mean 0.5 ‰PDB). The second cluster has more depleted values with δ18O values from -28.7 to -21.0 ‰PDB (mean -24.5 ‰PDB) and δ13C from 0.4 to 3.3 ‰PDB (mean 0.9 ‰PDB). The cluster of enriched values represents a cement that is commonly twinned. The depleted group of calcite samples appears to have undergone more dissolution or is vug-filling.
Figure 36: CL images show a wide range of luminescence colors and zoning patterns, reflecting the fabric variations seen in plane-polarized light. (a) GA-65c 3703’, CL image of brightly luminescent red and yellow late calcite; (b) BD-177, 1133’, CL image of void filling late calcite with compositional zoning; (c) D2-100-2, 266.4’, CL image of late calcite vein with zoning; (d) D2-100-D2-100-2, 266.4’, CL image of the edge of a late calcite vein (yellow) and saddle dolomite; (e) BD-178, 1318’, CL image of late calcite vein with possible zoning that is now destroyed.
(e) (d) (c) (a) (b) Saddle dolomite 0.5 mm 0.5 mm 0.5 mm 0.5 mm 0.5 mm
-3.0
-2.0
-1.0
0.0
1.0
2.0
3.0
4.0
-40.0
-30.0
-20.0
-10.0
0.0
δ
18O ‰ PDB
δ
13C ‰
P
DB
Late Calcite
DISCUSSION
The detailed petrographic and analytical work described in the previous section provides insight to the formation of Carlin-type gold deposits. Most notably, data from this study indicate that (1) the majority of the limestone was not altered to a dolostone before hydrothermal dolomitization and precipitation, (2) there may be two hydrothermal dolomitization events within the area: a Paleozoic dolomitization event at Meikle and a Jurassic-Tertiary hydrothermal dolomitization event at Dee-Rossi, and (3) a pattern of hydrothermal dolomitization can be predicted for Carlin-type deposits.
Limestone Interpretation
Field and laboratory studies show that samples of the Bootstrap limestone are not truly unaltered because of the occurrence of early cementation. The oolitic grainstones have bladed calcite on the surfaces of grains and a blocky, equant calcite cement between grains. These calcite cements are interpreted to represent precipitation from marine fluids penecontemporaneous with deposition, and precipitation in the meteoric phreatic zone or shallow burial environment shortly after deposition, respectively (James and Choquette, 1990; Tucker and Wright, 1990). These early cements would have significantly reduced porosity and permeability in the Bootstrap limestone unit.
Authigenic quartz and dolomite are also present in the limestone. The quartz and dolomite occur as disseminated crystals in the limestone, crosscutting both grains and cement. These disseminated dolomite crystals were likely precipitated deep in the subsurface by formation fluids (e.g., Cantrell and Walker, 1985).
Isotopic data from limestone samples (Figure 38) reflect early cementation of the oolitic grainstones and subsequent calcite precipitation events. These subsequent calcite events caused slightly depleted δ18O values because of precipitation under higher
temperatures or from depleted meteoric waters. Using the calcite equation from Friedman and O’Neil (1977), a Devonian seawater range of 0 to -1‰ SMOW Gao (1993), and assuming a normal temperature range for the seawater (20-30 ºC), the limestone δ18O values before calcite cementation range from -4.0 to -0.9 ‰PDB.
Four isotope samples have δ18O values of -15.0 ‰PDB or lower, and have either been recrystallized and/or have contamination from a later sparry calcite event (Figure 38). Recrystallization and late sparry calcite events would be related to higher
temperature fluids which are reflected by the depleted δ18O values.
Dolostone Interpretation
Diagenetic-planar dolomite occurs in two distributions in the Bootstrap limestone: (1) as disseminated dolomite rhombs as described in the previous section, and (2) as medium-crystalline replacement of limestone.
Dolomite is formed by the addition of Mg2+ into CaCO3.
2CaCO3 + Mg2+ = CaMg(CO3)2 + Ca2+ (Tucker and Wright, 1990).
The formation of dolomite is not well understood mainly because ordered dolomite is slow growing, making it difficult to precipitate in laboratory studies at surface
temperatures and one atmosphere pressure. The main discussions regarding
dolomitization models focus on the source of Mg2+. Seawater is Mg2+-rich, but kinetic parameters prevent dolomite precipitation in normal marine environments (Tucker and
Figure 38: Isotopic plot with associated photomicrographs illustrating the textural differences between samples with varying δ18O values. Two samples (a) and (b) have depleted values reflecting a late calcite event and recrystallization, respectively. The third sample (c) is a typical calcite cemented, peloidal limestone. (a) D0-100-1, 358.5’, Photomicrograph of destructive late calcite spar (stained pink); plane-polarized light; (b) U17-M05-3, 291’, recrystallized limestone (stained pink) surrounding a saddle dolomite rhomb, plane-polarized light; (c) Sample of Evans (2000). Photomicrograph of peloidal grainstone with equant, blocky calcite cement, plane-polarized light.