JOURNAL OF
ENVIRONMENTAL HYDROLOGY
The Open Access Electronic Journal of the International Association for Environmental Hydrology
On the World Wide Web at http://www.hydroweb.com
VOLUME 22
2014
TRACE METALS IN WATER AND SEDIMENTS OF THE TIGRIS RIVER,
BAGHDAD CITY, IRAQ
Thair Al-Ani 1 Nadhir Al-Ansari 2
Anwer H. Dawood 3
Dmytro Siergieiev 4
Sven Knutsson 5
1 Geological Survey of Finland, Espoo, Finland 2,4,5 Department of Civil, Environmental and Natural
Resources Engineering, Luleå University of Technology, Lulea, Sweden
3 Koya university, Koya, Erbil, Iraq
Industrial, agricultural and rural activities may result in pollution of watercourses with elevated trace metal concentrations and implications for water supply and ecosystem functioning. The concentration of the trace metals Fe, Mn, Zn, Co, Pb, Cu, and Cd in the water and clay fractions (<2µm) of the bank sediments of River Tigris in Baghdad city were determined. Dissolved trace metals concentrations were far below the upper permissible limits during 2012-2013. There was no consistent pattern between element concentrations and river discharge. Seasonal interrelations between water and sediments were most obvious for Fe that decreased in both environments with rising flows during autumn. Although independent of discharge, Mn in water and sediments often followed each other at all stations. Zinc, however, increased in the sediments and decreased in the water with discharge. The clay fractions were slightly to strongly enriched in trace metals with the gradient Co > Fe > Zn > Mn > Cu suggesting absorption of the metals on sediment substrate.
INTRODUCTION
Water discharge from anthropogenic activities has long been recognized as a significant contributor of pollutant loads to natural waters (Förstner and Salomons, 1980). Depending on the river morphology and hydrological conditions, particles with associated trace metals settle along a watercourse and become part of the bottom sediments (Viers et al, 2009). Elevated amount of trace metals in river water and sediments create health problems and endanger wild life, drinking and irrigation water supply thus becoming an issue of increasing environmental concerns. Sediments are important sinks for trace metals and play a considerable role in their remobilization in aquatic systems under suitable conditions. The chemical mechanisms that must be considered in studying the transport of trace elements in rivers involve: dissolution of ionic species and inorganic associations; adsorption on solids and organic material, precipitation or incorporation in crystalline structure (Gibbs, 1973). In general, Cu and Cr are transported in the crystalline solids, Mn in coating and Fe and Co are distributed equally between precipitated metallic coating and crystalline solids (Gibbs,1973). As redox sensitive elements, Fe and Mn hydroxides undergo reductive dissolution upon burial, whereas pore water Fe(II) and Mn (II) once produced in the anaerobic substrate may adsorb onto sediment surfaces (van Cappellen and Wang, 1996). Overall, trace metals show high affinity to Fe, Mn and organic matter which, together with clay minerals, are considered the most important adsorption phases in natural waters (Muller and Sigg, 1990).
Trace metal contaminations in the Tigris River were studies previously along different stretches. In Turkey, the proximity to Cu mineralization areas and related mining activity in the upstream river catchment showed elevated concentrations of Co, Cu, Pb and Zn in the river sediments with, however, low concentrations of these metals in the water (Gumgum et al, 1994). A decrease of dissolved Cu concentrations was noticed recently and attributed to reduced capacity of copper plants in the area (Karadede-Akin and Unlu, 2007), although river sediments were still contaminated in regards to Co, Cu, Mn, Pb and Zn (Varol, 2011). Due large amount of suspended loads in the Tigris River, the spread of trace elements along the watercourse is often related the suspended solids transport, which in turn is driven by the river discharge (Al-Ansari and Ali, 1986). Relatively low concentrations of Fe and Mn in the sediments of the Tigris Rivers were observed by Sabri et al (1980) at Samarra (north of Baghdad). At the same time, Mutlak et al (1980) showed that dissolved trace metals concentrations in the Tigris River at Baghdad City were far below the permissible level for irrigation. As the Tigris River discharge was modified due to damming and irrigation projects along the watershed, the transport of suspended solids can be expected to be also altered. Moreover, there is a lack of seasonal geochemical assessments of the Tigris River water and sediment composition in regards to trace metals.
This study was conducted in an effort to determine concentration levels of trace metals (Fe, Mn, Zn, Co, Pb, Cu and Cd) in the water and clay fractions (<2 µm) of the bank sediments of the Tigris River during 2012-2013. The aim of the study is to investigate the extent of trace metals pollution of the river on one hand and to provide background values for the future environmental assessment on the other hand.
STUDY SITE
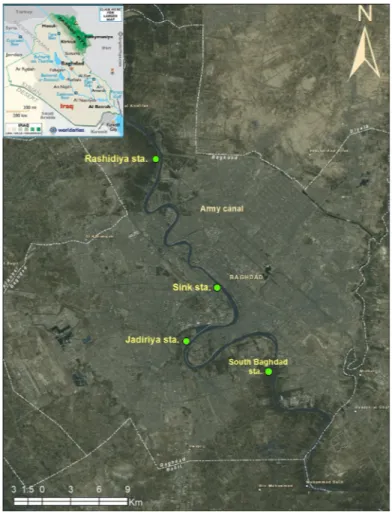
The catchment area of River Tigris is 473,103 km2 (Figure 1) and is distributed between Turkey,
2014a). River Tigris bisects Baghdad city into two parts from the north to the southeast for a distance of 60 km, of which 50 km are located within the urban areas, and the rest is in rural parts (Figure 1). Tigris River reach within Baghdad has compound meanders, single channel and alluvial plain characteristics with 10 islands and 17 side and point bars (Figure 1) (Ali et al., 2012, 2014). These islands and bars are affecting the hydraulic performance of the river which includes changing of the river cross sections that reduces the flooding capacity of the river, decreasing water depth at the intakes of water pumping stations, approaching the river bed from the intakes mouths, the impossibility of navigation along the whole reach and limitation to discrete zones and threating the banks protection stability at some locations due to deep eroding incisions in the river bed near these protections at the meanders. Furthermore, these obstacles are also affecting the environment and aesthetic (e.g. increasing the turbidity, growing of reeds, water hyacinth and ceratophyllum demersum at stagnant locations), as well as the disfiguration of aesthetic view over the river and its banks (Ali et al., 2012, 2014).
Water flow of Tigris River entering Iraq was decreased dramatically during the last two decades due to the huge water projects constructed across the river in Turkey and Iran (Al-Ansari and Knutsson, 2011; Al-Ansari 1998 and 2013). The recent dry climatic period in Iraq and the region increased the severity of the problem. As a result, the average monthly discharge of Tigris River at Baghdad dropped
Figure 1: Map of Iraq with Tigris and Euphrates Rivers with island and side bars along the Tigris River inside Baghdad (red borders).
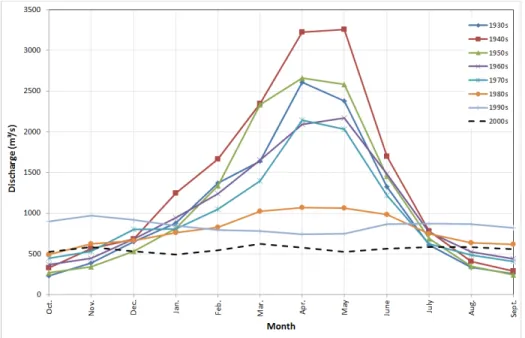
from 1207 m3/s (1931-1960) to 927 m3/s (1960-1999) to about 520 m3/s (2000-2012) (Ali, 2013). Tigris River hygrograph at Sarai Baghdad gauging station (Figure 2) showed that the maximum flow takes place during April and May. The period extending from October to February is referred to as variable flood period where discharges in the river fluctuate depending on intensity and duration of rainfall at its basin. This period is usually followed by what is known as steady flood period extending from March to April. As a result of dam construction and diversion of the valleys along River Tigris the yearly flood peak was substantially a reduced since 1990 (Figure 2). The mean drop of the average monthly discharges was 22.5 m3/s/yr for the last 24 years with more than 50% reduction during the last decade (Al-Ansari et al., 2014b, 2014c). The flood discharge was reduced almost 4 times from 4480 to 1314 m3/s in 1971 and 2005, respectively.
The bed of the river reach was mainly covered by sand while silt and clay cover small portions of the studied reach and the sand:silt:clay ratio was 90.74:6.86:2.40 (Al-Ansari et. al, 2014). The changes in the river cross sectional area decreased at Sarai gauging station since 1971 as did the average annual sediment discharge from 4.6 Mt during 1969-1970 and 1974-1975 (Al-Ansari et al, 1979) to 2.36 Mt during 1958-1985 (Al-Ansari and Toma, 1985). During March, April and May 66% of the load is usually transported (Al-Ansari and Toma, 1984, 1985, Al-Ansari and Ali, 1986, Al-Ansari et al, 1986). It should be mentioned however, that the average mean daily discharge at that period was 1140 m3/s and it dropped to 522 m3/s today (Al-Ansari et. al, 2014a). This implies that the load being transported now is less than it used to be especially before 1999 after the construction of Adhaim dam (Al-Ansari et. al, 2014a).
Figure 2. Hydrographs of River Tigris at Sarai Baghdad for the period 1930-2013.
MATERIAL AND METHODS
Sampling and analysis
Monthly water and sediment samples were collected from four stations along Tigris River in Baghdad city (Rashidiya, Sink, Jadiriya, South Baghdad station) (Figure 3) during the period from May
2012 to April 2013. The sampling sites were chosen to avoid disturbance from activities such as riverbank transportation as well as direct sources of pollution. Thus a total of 48 water and 48 sediment samples were collected and analyzed.
Water samples were collected using plastic bottles cleaned with 10% HCl and rinsed with distilled water. Each bottle was rinsed again with the water of the river in the field immediately before collecting the sample. The samples were stored in 4 °C in the laboratory till the chemical analysis was performed. The separation between suspended, colloidal and dissolved fraction was done by centrifuging and water concentrations were determined by atomic absorption spectroscopy (AAS) (Fetter, 1980; Perhac, 1972).River sediment samples were collected from the upper layer of alluvial river channel using clean plastic scoop and stored in polyethylene bags. The clay fraction <2 µm was separated for further analysis. The fine fraction has stronger adsorption ability of elements than the coarse fractions and the data obtained from the fine fraction can provide a useful comparative basis for detecting trace metals pollution (Rickert et al., 1977; Forstner and Patchineelaan, 1980 and UNESCO, 1983). The procedure followed for the digestion and analysis of the fraction is outlined by Al-Kufaishi (1975). The samples were treated with 10 ml of 40% HF, 5 ml of 1:1 HNO3 solutions and 5
ml of 1:4 perchloric acid solutions and evaporated to almost dryness on a sand bath (150°C). The residue was treated with further 10 ml of concentrated HCl and 5 ml of deionized water on a sand bath (100°C). After cooling the solution was transferred to 100 ml volumetric flask and 10 ml of lanthanum
solution and deionized water (to correct the volume to 100 ml) were added. The concentration of the elements in the solution was determined by AAS.
Multivariate statistical analysis
Multi-dimensional, systematic variation of data can be displayed using principal component analysis (PCA), which is a multivariate projection method. PCA is a statistical multivariate technique used to describe covariance between variables in a large dataset by transforming initial variables into their linear correlations. The relationships between the temporal changes in river discharge and trace metal concentrations were interpreted by converting them into linear combinations, or principal component scores. Principal components (PCs), that had eigenvalues larger than 1, described the major part of the total data variance and were taken into consideration. The coefficients, or eigenvector loadings, obtained indicated the relative importance of individual variables within PCs.
RESULTS AND DISCUSSION
The concentration of the trace elements (Fe, Mn, Pb, Zn, Co, Cu, Cd) in the surface water of the Tigris River at the four sampling stations during May 2012-April 2013 are given in Table 1. These were compared with the recommended averages given by the American Standard of trace elements in drinking water (Fairbridge,1972). Concentrations of Pd, Cd, Co and Cu were below the detection limit in all samples and are not discussed further on.
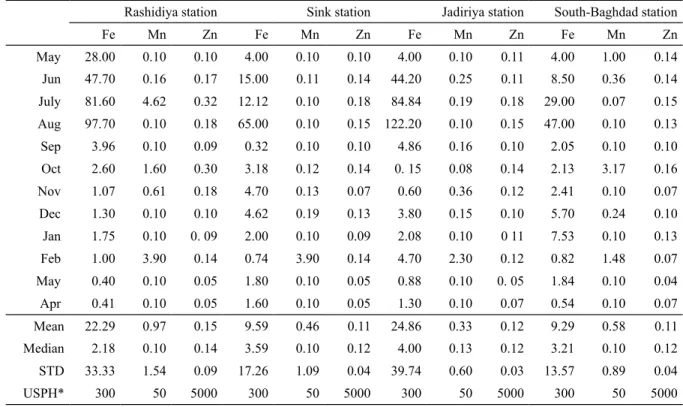
Table 1. Trace elements concentrations (ppb) in Tigris River during 2012-2013 from North to South. Baghdad city.
Rashidiya station Sink station Jadiriya station South-Baghdad station
Fe Mn Zn Fe Mn Zn Fe Mn Zn Fe Mn Zn May 28.00 0.10 0.10 4.00 0.10 0.10 4.00 0.10 0.11 4.00 1.00 0.14 Jun 47.70 0.16 0.17 15.00 0.11 0.14 44.20 0.25 0.11 8.50 0.36 0.14 July 81.60 4.62 0.32 12.12 0.10 0.18 84.84 0.19 0.18 29.00 0.07 0.15 Aug 97.70 0.10 0.18 65.00 0.10 0.15 122.20 0.10 0.15 47.00 0.10 0.13 Sep 3.96 0.10 0.09 0.32 0.10 0.10 4.86 0.16 0.10 2.05 0.10 0.10 Oct 2.60 1.60 0.30 3.18 0.12 0.14 0. 15 0.08 0.14 2.13 3.17 0.16 Nov 1.07 0.61 0.18 4.70 0.13 0.07 0.60 0.36 0.12 2.41 0.10 0.07 Dec 1.30 0.10 0.10 4.62 0.19 0.13 3.80 0.15 0.10 5.70 0.24 0.10 Jan 1.75 0.10 0. 09 2.00 0.10 0.09 2.08 0.10 0 11 7.53 0.10 0.13 Feb 1.00 3.90 0.14 0.74 3.90 0.14 4.70 2.30 0.12 0.82 1.48 0.07 May 0.40 0.10 0.05 1.80 0.10 0.05 0.88 0.10 0. 05 1.84 0.10 0.04 Apr 0.41 0.10 0.05 1.60 0.10 0.05 1.30 0.10 0.07 0.54 0.10 0.07 Mean 22.29 0.97 0.15 9.59 0.46 0.11 24.86 0.33 0.12 9.29 0.58 0.11 Median 2.18 0.10 0.14 3.59 0.10 0.12 4.00 0.13 0.12 3.21 0.10 0.12 STD 33.33 1.54 0.09 17.26 1.09 0.04 39.74 0.60 0.03 13.57 0.89 0.04 USPH* 300 50 5000 300 50 5000 300 50 5000 300 50 5000 * Fairbridge (1972)
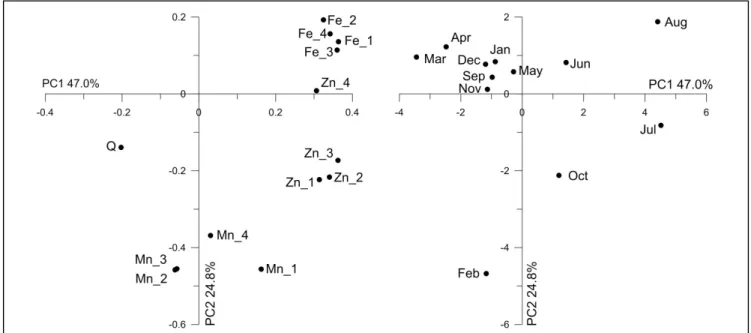
As there was no clear relationship between river discharge and trace element concentrations principal component analysis (PCA) was used to look for linear correlations. The first three resultant components were sufficient to describe 87% of the total data variance. Individual variance explained by the components was 47.0% by PC1, 24.8% by PC2 and 15.0% by PC3. PCA showed that Fe concentrations demonstrated similar pattern at all stations with less uniformity between the sampling stations for Mn and Zn (Fig 4). A negative relation with river discharge was observed for Fe and Zn, while Mn was mainly unaffected by discharge fluctuations. There was very little seasonal consistency in river water trace element composition based on the entire dataset. Nevertheless, it seems that winter and spring months (September – May) feature certain similarity (Fig 4).
Figure 4. Loadings (left) and scores (right) plots of Fe, Mn, Zn and river discharge (Q) at Rashidiya (1), Sink (2), Jadiriya (3) and South Baghdad (4) stations plotted in coordinates of the first two principal components
(explained portion of the data variance is stated).
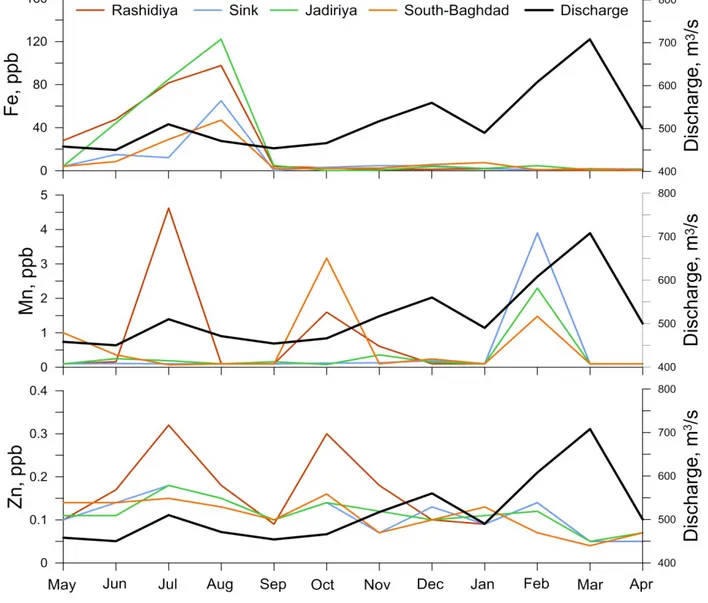
The dissolved Fe concentrations were generally low, ranging from 0.4 to 122.2 ppb with average values of 22.3±33.3 ppb, 9.6±17.3 ppb, 24.8±39.7 ppb and 9.3±13.6 ppb in Rashidiya, Sink, Jadiriya and South Baghdad stations, respectively (Table 1). The Fe concentration in the Tigris River water increased during the dry months reaching the maximum concentration in August (Fig 4). There was no significant relation between Fe, Mn and Zn (Fig 5). Iron showed weak but consistent relation to Mn during May-August (distinct negative R2=0.15) and September-April (slight negative R2=0.22).
Manganese was at or below the detection limit of 0.1 ppb in 26 samples. The concentration in rest of the samples ranged between 0.11 and 4.62 ppb with average values of 0.97±1.54 ppb, 0.15±0.09 ppb, 0.33±0.60 ppb and 0.58±0.89 ppb in Rashidiya, Sink, Jadiriya and South Baghdad stations, respectively (Table. 1). Examination of the data showed that Mn concentration in the Tigris River water increased in February at all stations, in October at Rashidiya and Sink stations and in July at Rashidiya station (Fig 4).
The concentration of dissolved Zn in surface water of the Tigris River ranged from 0.05 ppb to 0.30 ppb with average values of 0.15±0.09 ppb, 0.11±0.04 ppb, 0.12±0.03 ppb and 0.11±0.04 ppb in
Rashidiya, Sink, Jadiriya and South Baghdad stations, respectively (Table 1). The highest Zn concentrations were in July, August and October and followed the water level decreases (Fig 5). A positive correlation between Mn and Zn concentrations suggests common geochemical pathways for Mn and Zn in the dissolved phase in this system and that these elemental should be considered together because of their chemical similarities (Fig 5).
Figure 5: Discharge (m3/s) and dissolved concentrations (ppb) of Fe, Mn and Zn in the Tigris River during 2012-2013.
In general, during the high water level period, the concentration of all examined metals decreases largely (Table 1; Fig 5). This is mainly due to the dilution effect and partly due to the adsorption of the metal ions by the dense suspended material that are present in water during this period. Suspended sediments are well known for their high ability to adsorb the metal ions from solution and concentrate them on their outer surfaces because of their fine size and larger surface areas (Hawkes and Webb, 1962; Muller and Sigg, 1990). A distinct seasonal pattern was observed only for Fe with a peak in May-July and decreased concentrations during the rest of the year, whereas Mn and Zn showed less consequent variation (Fig 5).
A comparison of the results from the Tigris River with water standards given by U.S. public Health for drinking water (Fairbridge, 1972) shows that the heavy metal concentration of the Tigris water at Baghdad city is far below the upper permissible limits (Table 1), i.e. the Tigris River water is fresh and suitable for drinking and irrigation. This result is consistent with other studies conducted in the Tigris River (e.g. Hamad et al, 2012)
THE GEOCHEMISTRY OF THE SEDIMENTS
At the high flows (winter) accompanied by increased suspended sediment load, a blanket of sediment is deposited over the major area of the river channel causing an increase in the clay and silt concentration relative to sand (Al-Ansari and Toma, 1984). In the present study, the <2 µm sediment fraction represents a significant factor for the transportation of heavy metals originating from various urban areas to rivers of the Tigris Plain. It is particularly significant as heavy metals enriched stream sediments settle out on river’s flood plains and channel bars and interact with river’s local environment. The concentration of the trace elements (Fe, Mn, Pb, Zn, Co, Cu, Cd) in the sediments of the Tigris River at the four sampling stations during May 2012-April 2013 are given in Table 2. These were compared with the recommended averages given by the American Standard of trace elements in drinking water (Fairbridge,1972).
Principal component analysis showed that the sediment data can be described using six significant PCs that together explain 88% of the total data variance. Individual variance explained by the components was 25.0% by PC1, 18.7% by PC2, 17.1% by PC3, 11.0% by PC4, 9.5% by PC5 and 6.7% by PC6. The analysis showed that Fe concentrations had similar pattern at all stations and was negatively related to the river discharge (Fig 6). High relation was also observed for Co and Cu in all samples demonstrated by their high uniformity within the first two PCs. Manganese and Zn showed no significant raltion to any of the elements in the sampled elements during the observation period. There was very little seasonal consistency in river water trace element composition based on the entire dataset. However, it seems that winter and spring months (January-February and May-July) feature certain similarity (Fig 6).
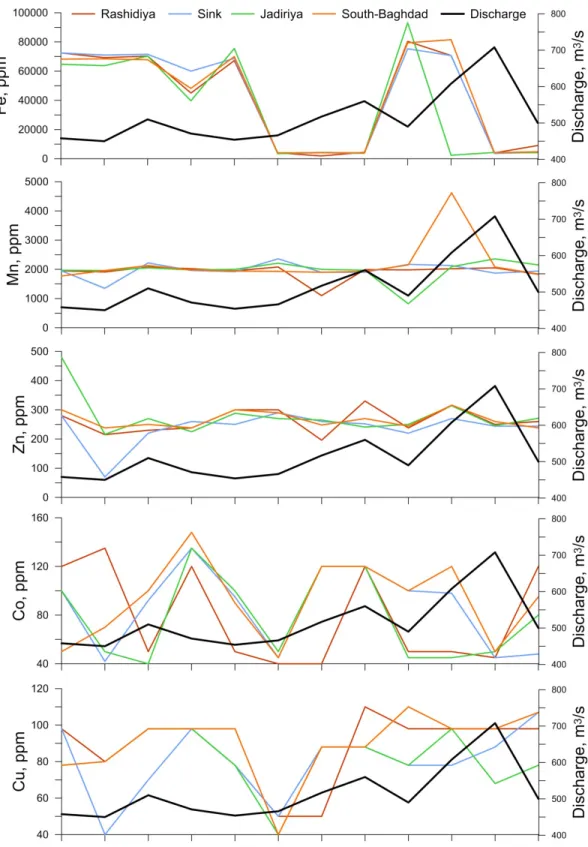
The concentration of Fe in channel sediments of the Tigris River was ranging from 1930 to 93200 ppm with average values of 41572±32150 ppm, 42437±32767 ppm, 35813±33983 ppm and 42078±32864 ppm in Rashidiya, Sink, Jadiriya, South Baghdad stations, respectively (Table 2). The data showed that the highest Fe values were encountered during January and February (75300-93200 ppm). During the dry months (May-September), almost the entire sediments have Fe concentration within the range of 39700-75000 ppm. Furthermore, it could be noticed that Fe had concentration within the range between 1930-4780 ppm during October-December and March-April (wet months). It seems that as the volume of water increases, Fe concentration is diluted (Fig 7) which is also consistentwith PCA (Fig 6) and indicates the wash-out of Fe due to high interstitial flow during increased discharge occasions. Examination of the data showed that the concentration of Fe in the Tigris River sediments is due to adsorption by clay minerals and local contamination. The correlation coefficients between Fe and heavy metal elements Mn, Zn, Co, and Cu, gave no evident relationship. This suggests that the degree of association of Fe with these elements is very low in the channel sediments of the river.
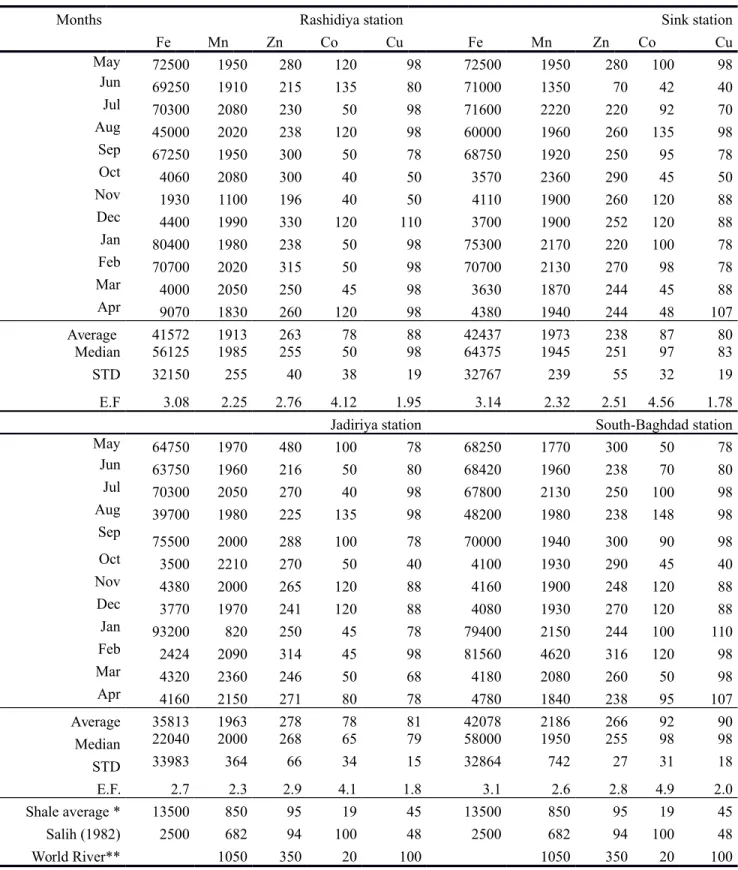
Table 2. Monthly concentration of trace elements (ppm) in Tigris River sediments for the year (2012-2013) from North to South Baghdad city.
Months Rashidiya station Sink station
Fe Mn Zn Co Cu Fe Mn Zn Co Cu May 72500 1950 280 120 98 72500 1950 280 100 98 Jun 69250 1910 215 135 80 71000 1350 70 42 40 Jul 70300 2080 230 50 98 71600 2220 220 92 70 Aug 45000 2020 238 120 98 60000 1960 260 135 98 Sep 67250 1950 300 50 78 68750 1920 250 95 78 Oct 4060 2080 300 40 50 3570 2360 290 45 50 Nov 1930 1100 196 40 50 4110 1900 260 120 88 Dec 4400 1990 330 120 110 3700 1900 252 120 88 Jan 80400 1980 238 50 98 75300 2170 220 100 78 Feb 70700 2020 315 50 98 70700 2130 270 98 78 Mar 4000 2050 250 45 98 3630 1870 244 45 88 Apr 9070 1830 260 120 98 4380 1940 244 48 107 Average 41572 1913 263 78 88 42437 1973 238 87 80 Median 56125 1985 255 50 98 64375 1945 251 97 83 STD 32150 255 40 38 19 32767 239 55 32 19 E.F 3.08 2.25 2.76 4.12 1.95 3.14 2.32 2.51 4.56 1.78
Jadiriya station South-Baghdad station
May 64750 1970 480 100 78 68250 1770 300 50 78 Jun 63750 1960 216 50 80 68420 1960 238 70 80 Jul 70300 2050 270 40 98 67800 2130 250 100 98 Aug 39700 1980 225 135 98 48200 1980 238 148 98 Sep 75500 2000 288 100 78 70000 1940 300 90 98 Oct 3500 2210 270 50 40 4100 1930 290 45 40 Nov 4380 2000 265 120 88 4160 1900 248 120 88 Dec 3770 1970 241 120 88 4080 1930 270 120 88 Jan 93200 820 250 45 78 79400 2150 244 100 110 Feb 2424 2090 314 45 98 81560 4620 316 120 98 Mar 4320 2360 246 50 68 4180 2080 260 50 98 Apr 4160 2150 271 80 78 4780 1840 238 95 107 Average 35813 1963 278 78 81 42078 2186 266 92 90 Median 22040 2000 268 65 79 58000 1950 255 98 98 STD 33983 364 66 34 15 32864 742 27 31 18 E.F. 2.7 2.3 2.9 4.1 1.8 3.1 2.6 2.8 4.9 2.0 Shale average * 13500 850 95 19 45 13500 850 95 19 45 Salih (1982) 2500 682 94 100 48 2500 682 94 100 48 World River** 1050 350 20 100 1050 350 20 100
Figure 6. Loadings (left) and scores (right) plots of Fe, Mn, Zn, Co and Cu and river discharge (Q) at Rashidiya (1), Sink (2), Jadiriya (3) and South Baghdad (4) stations plotted in coordinates of the first two
principal components (explained portion of the data variance is stated).
The concentration of Mn in channel sediment of the Tigris River ranged from 820 to 4620 ppm with average values of 1913±255 ppm, 1973±239 ppm, 1963±364 ppm, and 2186±742 ppm in Rashidiya, Sink, Jadiriya and South Baghdad stations, respectively (Table 2). The concentration of Mn increased with water level during October and February at South Baghdad and Jadiriya (Fig. 7). When the water level increased during these months, the surrounding cultivated areas are inundated by flood waters. The flooding of the Tigris River during winter and spring has an effect on the distribution of Mn concentration which normally originates from weathering, being elevated in groundwater and possibly high in the agricultural soil (Al-Ansari et al., 1986a, b). Manganese concentrations were often associated with Zn in Rashidiya (R2=0.50), Sink (R2=0.74) and South Baghdad (R2=0.50) stations and
showed no relation to Zn at Jadiriya sampling location.
The concentration of Zn in channel sediment of the Tigris River ranges from 70 to 480 ppm with average values of 263±40 ppm, 238±50 ppm, 278±66 ppm, and 266±27 ppm in Rashidiya, Sink, Jadiriya and South Baghdad stations, respectively (Table 2). The concentration of 75% of the sediment samples ranged between 260-280 ppm. The maximum value of Zn concentration was encountered in Jadiriya station during May 2012, while the minimum value was recorded in Sink station during June 2012 (Fig 7). In general, the increase in Zn concentration in some samples is likely due to local contamination.
The concentration of Co in the clay fraction of the channel sediment of Tigris River ranged from 40 to 148 ppm with average values of 78±38 ppm, 87±32 ppm, 78±34 ppm, and 92±31 ppm in Rashidiya, Sink, Jadiriya and South Baghdad stations, respectively (Table 2). The highest concentration of Co was recorded during August and December 2012 in all stations (Fig 7). The cause of high concentration of Co is mainly attributed to adsorption, structural incorporation or ion exchange uptake by clays and the
Figure 7: Discharge (m3/s) and concentrations (ppm) of Fe, Mn, Zn, Co and Cu in the sediments of the Tigris River during 2012-2013.
presence of plants in the course of the river (Hirst, 1962; Zielinski, 1982). At the same time, relation of Co to secondary hydrous oxides of Fe and Mn can be rules out due their insignificant correlation in the sampled sediments.
The concentration of Cu in channel sediment of the river ranged from 40 to 110 ppm with average values of 88±19 ppm, 80±19 ppm, 81±15 ppm, and 90±18 ppm in Rashidiya, Sink, Jadiriya, and South Baghdad stations, respectively (Table 2). The lowest concentration of Cu in the fine sediment was recorded during October 2012, while the highest concentration was recorded during August 2012. Copper normally tends to concentrate in < 2µm grain-size fraction of sediments, however, in the sampled material was sporadically associated with Mn, Zn and Co.
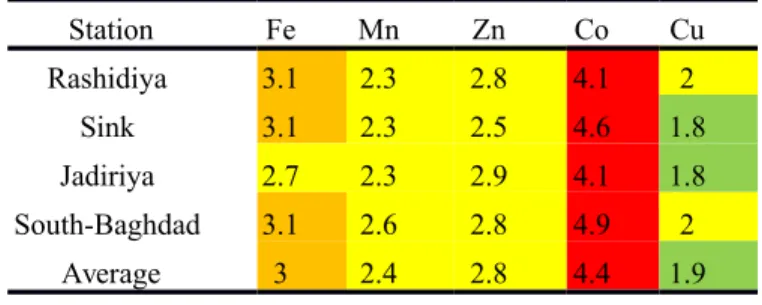
The quantification of pollution has been calculated by using an enrichment factor with respect to average shale (Turekian & Wedepohl 1961). Table 3 shows the metal enrichment factors (E.F) for Tigris River sediments. The table also indicates higher factors for Co (4.1-4.8), followed by Fe (2.7-3.1), Zn (2.5-2.9), Mn (2.2-2.6) and Cu (1.8-2.0). The average shows the input relation between the selected stations along the river. Cu average enrichment factor in the rivers remains within the natural background, characterized by lower average (1.9), whereas Co, Fe, Zn and Mn averages reflect anthropogenic inputs in studied environments (4.4 for Co, 3.0 for Fe, 2.8 for Zn and 2.4 for Mn). Salih (1982) studied the sediments of the Tigris River from Baghdad to Qurna, under high urban influence, and detected a lower enrichment factors for these metals (1.85 for Fe, 0.80 for Mn, 0.99 for Zn and 1.07 for Cu), while higher enrichment factors 5.3 for Co (Fig. 10b). Comparing the geochemical data of Tigris River with the average chemical composition of major world rivers (Martin and Meybeck 1979), showed that River Tigris is enriched with Co and Mn but depleted with Zn and Cu relative the world rivers sediments. The present work suggests that the clay and heavy minerals may form an important source for the natural pollution by the heavy metals in recent sediments of the Tigris River. The enrichment factors of the trace elements depend on several factors such as adsorption on the surface of the fine clay particles and organic matter of the sediments, chemical factors (solubility of minerals) and biological factors (uptake by vegetation, degradation by bacteria), redox potential, and pH (Santschi et al., 1990; van Chapelle and Wang, 1996; Fuller and Harvey, 2000). Regarding heavy metal pollution, generally, it can be stated that the studied metals are higher than their natural geochemical background (Table. 3). Nevertheless, the enrichment factor values are relatively low in some samples during the high level water period and it also indicate that the river has been subjected to small-scale natural and industrial discharges.
Table 3. The metal enrichment factors for the Tigris River sediments (color indicates the enrichment state),
Station Fe Mn Zn Co Cu Rashidiya 3.1 2.3 2.8 4.1 2 Sink 3.1 2.3 2.5 4.6 1.8 Jadiriya 2.7 2.3 2.9 4.1 1.8 South-Baghdad 3.1 2.6 2.8 4.9 2 Average 3 2.4 2.8 4.4 1.9
CONCLUSIONS
Sediment (48) and water (48) samples were collected on monthly intervals from 4 stations from the River Tigris for the period between 12th May 2012 and 15th April 2013 and analyzed for Fe, Mn, Zn,
Co, Pb, Cu, and Cd. The analyses of these samples indicated that:
(I) The concentrations of the studied trace metals in waters of the Tigris River at Baghdad were lower the upper permissible limit (for drinking and other purposes). The concentration of the trace metals is generally enriched during the dry season and diluted during the wet season when the volume of water is increased.
(II) Geochemistry of clay fraction showed that the heavy metals concentrations are slightly or sometimes strongly enriched compared to the concentration in average shale, and the enrichment percentages of heavy metals due to human effects could be arranged as: Co > Fe > Zn > Mn > Cu. Comparison with average chemical composition of major world rivers showed enrichment in Co and Mn and depletion in Zn and Cu.
(III) Seasonal interrelations between water and sediments were most obvious for Fe that decreased in both environments with rising flows during autumn to further increase solely in the sediments. Although independent of discharge, Mn in water and sediments often followed each other at all stations. Zinc, however, often increased in the sediments and decreased in the water with discharge.
(IV) Generally, it was difficult to find a relation between river water trace metal composition and that of the sediment due to unknown sources and seasonality of these metals in other end-members. Availability of geochemical data on trace element cycling in groundwater and contribution from artificial sources would improve the interpretation. Principal component analysis was a powerful tool to operate with data complexity by transforming initial co
ACKNOWLEDGMENT
The authors are very grateful to Professors Professor Rafid Alkaddar (Liverpool JM University, UK), Professor Mustafa Alshawi (Salford University) and Kadhium Almuqdadi (Arab Academy at Denmark) for their fruitful comments, discussion and suggestions. The authors would like to present their thanks and gratitude to Luleå University of Technology, Sweden and by Swedish Hydropower Centre - SVC” established by the Swedish Energy Agency, Elforsk and Svenska Kraftnät together with Luleå University of Technology, The Royal Institute of Technology, Chalmers University of Technology and Uppsala University. Their support is highly appreciated.ncentrations into their linear correlations.
REFERENCES
Al-A.nsari, N.A. and Toma, A.Y., l984. Bed characteristics of the River Tigris within Baghdad, Jour. of water Resources, v3, pp.l-23.
Al-Ansari, N. A., Ali, S. H., and Taqa, A., 1979, Sediment discharge in the River Tigris at Baghdad (Iraq), International Congress in Hydrological Science, Canberra, Australia, IAHS Pub.No.128, 399-407.
Al-Ansari, N. A., and Toma, A., 1985. Suspended Sediment waves in the River Tigris at Sari station for the year 1982. Inter. Symp. on Erosion, Debris flow and Disaster Prevention Keynote, Japan,
157-162.
Al-Ansari, N. A., and Ali, J. L., 1986. Suspended load and solute discharge in River Tigris within Baghdad, J. Water Res., V. 5, 35-50.
Al-Ansari, N. A., Sayfy, A., Al-Sinawi, G.T., and Ovanessian, A. A., 1986a, Evaluation of the water quality for the lower reaches of River Tigris using multivariate analysis, J. Water Res., V. 5, No. 2, 173-187.
Al-Ansari, N. A., Sayfy, A., Ovanessian, A.A., and Al-Sinawi, G.T., 1986b, Water Quality of the River Tigris north of Baghdad using multivariate analysis, J. Water Res., V. 5, No. 2, 148-172.
Al-Ansari, N.A., 2013. Management of Water Resources in Iraq: Perspectives and Prognoses, J. Engineering, V.5, 8, 667-68.
Al-Ansari, N., 1998. Water Resources in the Arab countries: problems and possible solutions, UNESCO International Conference on World Water Resources at the Beginning of the 21st Century 3-6 June, Paris, 1998.
Al-Ansari, N.A. and Knutsson, S., 2011. Toward Prudent management of Water Resources in Iraq, J. Advanced Science and Engineering Research, V. 1,53-67.
Al-Ansari, N.A., Abdellatif, M.,Ezeelden, M.,Ali, S. and Knutsson, S., 2014a Climate Change and Future Long Term Trends of Rainfall at North-eastern Part of Iraq, J. Civil Engineering and Architecture,8, 6,790-805.
Al-Ansari, N.A., Abdellatif, M.,Ali, S. and Knutsson, S., 2014b Long Term Effect of Climate Change on Rainfall in Northwest Iraq, Accepted Central European Journal of Engineering.
Al-Ansari, N.A., Ali, A. and Knutsson, S., 2014c. Present conditions and Future Challenges of Water Resources Problems in Iraq. J. Water Resources and Protection.6 (12), 1066-1098.Al-Ansari and Toma 1985
Ali, A.A., 2013, Morphology of Tigris River inside Baghdad City. Licentiate Thesis, Lulea University of Technology, Sweden, 118.Ali et al, 2013
Ali,A., Al-Ansari, N.A. and Knutsson, S., 2012, Morphology of Tigris River within Baghdad City, J. Hydro. Earth Syst. Sci., V. 16, 1-8.
Ali,A., Al-Suhail, Q.,Al-Ansari, N.A. and Knutsson, S., 2014, Evaluation of Dredging Operations for Tigris River within Baghdad, Iraq, J. Water Resources and Protection, 6, 4,202-213.
Al-Kufashi, F.A.M., 1975.Digestion of Geological Materials, BuJl. Col. Sci. v.6, N.2, pp.339-348. Banat, K.M., l980. Principle of clay mineralogy, Baghdad Univ., Press, Baghdad, 138p.
Barshad. I. 1966. Factor affecting the frequency distribution of clay minerals in soils, days and day minerals, v.26, pp.208-220.
Brooks, R.A. and Ferrell. E. 1970. The lateral distribution of clay minerals in lakes pontehartrain and manropes, Louisiana. J. sed. pet., v.40, pp.855-863.
Brown, G., l961. The X-ray identification and crystal structures of clay minerals, Mineralogical Society, Clay Minerals Group, 544p.
Carroll. D., 1970. Clay minerals: A guide to their X-ray identification, Geol. Soc. Am., special paper 126, 80p.
Deer, W.A., Howie, R.A., and Zussman, J., l966. An introduction to the rock forming minerals, Longham, London, 528p.
ESCWA (Economic and Social Commission for Western Asia) (2013) Inventory of Shared Water Resources in Western Asia. SalimDabbous Printing Co., Beirut, 626 p.
Fairbridge, R. W., 1972. The encyclopedia of geochemistry and environmental sciences, Van Nostrand, 1321p.
Fetter, C.W, 1980. Applied Hydrogeology, Charles E Merrill publishing Co., A Bell and Howell Co., Columbus, Ohio, 488p.
Folk. R L., 1974. Petrology of sedimentary rocks, Hemphill’s, Austin, Texas, 182p.
Forstner, U. and Patchineelam, S.R., l980. Chemical associations of heavy metals in polluted sediments from the Rhine River, In: Kavanaugh F.C., Leekie, J.P. particulates in water, Am. Chem. Ser., N.189, pp.l77-193.
Förstner, U. and Salomons, W. 1980. Trace metal analysis on polluted sediments: Part I: Assessment of sources and intensities. Environmental Technology, 1(11), 494-505.
Gibbs, R.J., 1973. Mechanism of trace metal transport in rivers, Science, v.l80, pp.7l-73. Grim, R.E. 1968. Clay mineralogy (2nd ed.), Mc Graw Hill, New York, 596p.
Gümgüm, B., Tez, Z., Gülsün, Z. 1994. Heavy metal pollution in water, sediment and fish from the Tigris River in Turkey. Chemosphere, 29(1), 111-116.
Fuller, C.C., Harvey, J.W. 2000.Reactive uptake of trace metals in the hyporheic zone of a mining-contaminated stream, Pinal Creek, Arizona. Environ. Sci. Technol. 34:1150-1155.
Hamad, S.H., Schauer, J.J., Shafer, M.M., Al-Raheem, E.A., Satar, H. 2012. The Distribution between the dissolved and the particulate forms of 49 Metals across the Tigris River, Baghdad, Iraq, The Scientific World Journal, vol. 2012, Article ID 246059, 13 pages. doi:10.1100/2012/246059.
Hawkes, H.E. and Webb, J.S., 1962. Geochemistry in mineral exploration, Harper and Row. 415p. Hirst, D. M., 1962. The geochemistry of modern sediments from the Gulf of Paria; II, The location and
distribution of trace elements: Geochim. et Cosmochim. Acta. v.26, pp.309-334.
Karadede-Akin, H., Ünlü, E. 2007. Heavy metal concentrations in water, sediment, fish and some benthic organisms from Tigris River, Turkey. Environmental Monitoring and Assessment, 131(1-3), 323-337.
Keller, W.D., 1970. Environmental aspects of clay minerals, Sed. pet, v.40, PP788-814.
Martin , J. M., AND Meybeck, M. 1979. Elemental mass balance of material carried by major world rivers. Mar. Chem. 7: 173-206.
Millot, G. l970. Geology of clays, Chapman and Hall, London, 429p.
Muller, B., Sigg, L. 1990. Interaction of trace metals with natural particle surfaces: comparison between adsorption experiments and field measurements. Aq. Sci. 52/1:75-92.
Perhac, R.M., J 972. Distribution of Cd, Co, C Fe, Mn, Ni, Pb and Zn in dissolved and particulate solids from two streams in Tennessee, J. Hydro., v.l5, pp.l77-186.
Rickert, D.A., Kennedy, V.C, Mckenzie, S. W and Hines, W.G., 1977. A synoptic survey of trace elements in bottom sediments of the Willamette River, Oregon, U.S.G.S., circular 715-F, 27p.
Sabri, A. W., Khalid, A. R., Thaer, I. K. 1993. Heavy metals in the water, suspended solids and sediment of the river Tigris impoundment at Samarra. Water Research, 27(6), 1099-1103.
Salih, A. 1982. Hydrochemistry, geochemistry and the probable pollution of Tigris River from Baghdad to Qurna. M.Sc. Thesis. Baghdad Univ, IraqThorez, J., 1976. Practical identification of clay minerals, G. Lellotte (ed.), Dison (Belgium), 89p.
Salih, A. 1982. Hydrochemistry, geochemistry and the probable pollution of Tigris River from Baghdad to Qurna. M.Sc. Thesis. Baghdad Univ, Iraq
Santschi, P., Höhener, P., Benoit, G., Buchholtz-ten Brink, M. 1990. Chemical processes at the sediment-water interface. Mar. Chem. 30:269-315.
Thorez, J., 1976. Practical identification of clay minerals, G. Lellotte (ed.), Dison (Belgium), 89p. Turkian, K.K. and Wedepoli, K.H., l961. Distribution of the elements in some major rock unit of the
Turkian, K.K. and Wedepoli, K.H., l961. Distribution of the elements in some major rock unit of the earth crust, Geol.Soc.Amer.Bull. v.72, pp. 175-192.
UNESCO, 1983. Study of the relationship between water quality and sediment transport, Tech. paper in Hydrology, v.26. France. 231p.
UNESCO, 1983. Study of the relationship between water quality and sediment transport, Tech. paper in Hydrology, v.26. France. 231p.
Van Chapelle, P., Wang, Y. 1996. Cycling of iron and manganese in surface sediments: a general theory for the coupled transport and reaction of carbon, oxygen, nitrogen, sulfur, iron and manganese. American Jounral of Science, v. 296, pp. 197-243.
Varol, M. 2011. Assessment of heavy metal contamination in sediments of the Tigris River (Turkey) using pollution indices and multivariate statistical techniques. Journal of Hazardous Materials, 195, 355-364.
Viers, J., Dupré, B., Gaillardet, J. 2009. Chemical composition of suspended sediments in World Rivers: new insights from a new database. Science of the Total environment, 407(2), 853-868. Zielinski, R.A. 1982. The mobility of uranium and other elements during alteration of rhyolite ash to
montmorillonite: a case study in the troublesome formation, Colorado, USA. Chemical Geology, 3, 185-204.
ADDRESS FOR CORRESPONDENCE Nadhir A. Al-Ansari
Department of Civil, Environmental and Natural Resources Engineering Lulea University of Technology
Lulea, Sweden