A Study from Europe
BACHELOR
THESIS WITHIN: Business Administration NUMBER OF CREDITS: 15 ECTS
PROGRAMME OF STUDY: International Management AUTHOR: Jonathan Havik, Andreas Soteriou, Emil Stendahl
Commodity Risk Management in
The Airline Industry
Acknowledgements
We would like to express our sincerest gratitude to all the people involved and for devoting their time into this thesis. This would not have been possible without their guidance and contributions, the assistance have been more than valuable.
First and foremost, we would like to thank Petra Inwinkl for her encouragement, constructive critique and helpful advice, which have guided us through everything that we have faced throughout the semester.
We would also want to thank Anders Melander. A complex project as a thesis-course is not something that is easily administrated and he have succeeded in making it a clear path for both us and our fellow students.
Last but not least, we want to acknowledge our fellow students for receiving high-quality feedback during our seminars throughout the course.
___________________ ___________________ Andreas Soteriou Emil Stendahl
____________________ Jonathan Havik
Jönköping International Business School 23rd of May 2016
Abstract
The airline industry is a major user of jet fuel and this constitutes a large component of the operating costs and is a risk coefficient for airlines. Several studies have been conducted on how oil price volatility affect stock prices and cash flows as well as how, in general, firms that uses derivatives experience lower stock returns volatility and stock βs .The impact of oil price volatility on airline stock βs and the impact of hedging on airline stock βs have not been adequately examined, this paper fills this gap. By gathering daily frequency of oil spot prices to access the quarterly oil price volatility and stock βs from 16 European airlines, we correlate quarterly oil price volatility to quarterly airline stock βs as well as stock βs and hedging percentages between 2010-2015, we reject the hypothesis that oil price volatility has an impact on airline stock βs and that hedging reduces stock βs. These findings therefore suggest that oil price volatility do not have a large impact on systematic risks or that hedging offset systematic risks. The findings are of interest to investors who want to make well informed investment decisions based on non-diversifiable equity risk since it has become popular for management recently to implement hedging policies to signal competency in risk management in order to attract investments.
Table of Contents
1. Introduction ... 1 1.1 Background ... 1 1.2 Problem Statement ... 5 1.3 Purpose ... 6 1.4 Thesis Outline ... 7 2. Literature Review ... 82.1 Oil Price Volatility and Stock βs ... 8
2.2 Hedging ... 9
2.3 Summary and Hypothesis Building ... 12
3. Methodology and Method ... 15
3.1 Methodology... 15
3.2 Method ... 18
3.2.1 Data Gathering ... 18
3.2.2 Implementation ... 19
4. Empirical Findings ... 21
4.1 Findings: Correlation of Stock β and Oil Price Volatility ... 21
4.2 Findings: Correlation stock β and Hedging Percentages ... 23
5. Analysis ... 24 6. Conclusion ... 28 7. Discussion ... 29 7.1 Limitations ... 29 7.2 Implications... 30 7.3 Further Research ... 30 8. References ... 32
Tables
Table 1 – Airlines and Stock Exchanges ... 18 Table 2 – Output of Correlation between stock β and Oil Price Volatility ... 22 Table 3 – Output of Correlation between Hedging Percentages and stock β ... 23
1. Introduction
This chapter presents an overview of the thesis subject to receive a greater understanding. Further it introduces the problem of the thesis as well as the purpose to this work. It will regard the issues addressed in this work and lastly present the thesis outline.
1.1 Background
The global airline industry has grown significantly the past decade and the revenue has doubled between 2004 and 2014 (IATA, 2015a). One particular aspect of the aviation industry is that the net profit margin during several years has been low, for instance during 1990 – 2012 the average net profit margin was 0.0% for the aviation industry (Pearce, 2013). However, during the past years the industry has seen an increase in the net profit margin, for instance it was 3.5% for the European market in 2015 and is forecasted to be 4.3% in 2016 and are climbing. The increase in net profit margin is likely affected by decreased crude oil prices, stronger demand on travel and airline efficiency (IATA, 2015a). Furthermore, the increased competition is a result of the global deregulation of the industry that took place in the 1980s (Berghöfer & Lucey, 2014). This deregulation refers to the past, when it was common that government owned the traditional carriers who served their own countries, also called flag carriers. However, since the deregulation came in to effect, a new pattern emerged with the entry of low cost carriers (LCCs). This new type of airline has different cost structures compared to the traditional airlines. Lower wages, flight routes to more remote airports which led to lower fees, smaller crews on flight are a few of the reasons that the LCCs could grow rapidly and gain market shares in the early 1980s (Graham, Kaplan & Sibley, 1983; ICAO, 2003).
Since the LCCs penetrated the market, the industry has led to a higher degree of variation and options for the customers. Given this new situation within the industry, it has become more important to compete by cutting costs. Especially for Europe, which is one of the regions with the lowest market concentration and the average European EBIT margin was roughly 2,5% in 2015 (CAPA, 2015). One of the main costs for airlines has been the jet fuel; in a historically aspect it has accounted for 10%-15% of the total operating costs (Treanor, Rogers, Carter & Simkins, 2014). However, during the past decade the percentage of jet fuel
costs compared to total operating costs has increased, more specific doubled. For instance, the jet fuel contributed for 13.6% in 2003 but in 2014 it had increased to 31.6% (IATA, 2015c).
Changing the cost structure to gain competitive advantages is not always easy. Some aspects of a company, such as employee wages is controlled by the company itself. However, jet fuel costs is harder to cope with, as the oil prices have been proved to be of high volatile nature and can change over short periods of time (Narayan & Narayan, 2007). Crude oil is the source of jet fuel and they have a correlation coefficient of 0.9 (Indexmundi, 2016). Since they are highly correlated, the airline industry is in need to understand the volatility of oil prices, as it could expose them risks that influence their operations (Narayan & Narayan, 2007). Crude oil prices have historically been a volatile commodity and this can be traced to that (1) crude oil is naturally affected by events such as natural disasters and political unstable environments. Furthermore, this becomes important, as the OPEC countries own 81% of the world’s oil reserves and 66% of those oil reserves are located in the Middle East, which is a region of political frictions. (OPEC, 2015; Morrell & Swan, 2006). (2) Oil prices itself are inelastic since the oil production and the equipment that is using oil as the main source are relative fixed in the short run. Moreover, there are often no clear substitutes for the consumer when prices increase in the short run. In order to keep the demand and supply at equilibrium it is of great need to shock the market with large price changes. This is necessary to rebalance supply and demand in the market (Ebrahim, Inderwildi & King, 2014). Since jet fuel has become such a large component of the airlines operating expenses and due to the volatility of crude oil, jet fuel is a significant variable of risk exposure for airlines (Carter, Roger & Simkins, 2006.) Therefore airlines tries to manage future jet fuel costs (Morrell & Swan, 2006).
A common practice of managing the crude oil price volatility and jet fuel costs is through hedging (Morrell & Swan, 2006; Narayan & Narayan, 2007). By engaging in hedging it broadly means that the price of jet fuel gets “locked in”, in order to reduce the exposure to swings in crude oil prices. There are different possibilities to use when executing hedging strategies: Forward contracts, futures contracts, options, collars and swaps. Forwards contracts and futures contracts share the same fundamental, a contract is written that a set amount jet fuel will be delivered at a specific date in the future at a fixed price. However, forward contracts are an agreement between two parties and are made up for
that specific contract. Futures contracts are standardized and anyone can buy them, which means it is traded on an exchange. Investors speculate that the price will either increase or decrease, in other words, gambling. Moreover, the delivery of the commodity almost never go through, less than 1% is actually delivered. The reason is that the holder of the contract reverses the effect by creating a new one that cancels out the first one. This means that in the end, only money is being transferred between the “winners” and the “losers” (Morrell & Swan, 2006).
An option is a derivative that the airlines can use, called call option. A premium has to be paid in order to acquire the call option, which allows the holder to lock in the current price of jet fuel until a future specific date. It allows the holder to avoid increases in oil prices and still buy at a lower price if the oil price decreases (Morrell & Swan, 2006).
The fourth hedging technique is a collar, which is a combination of a call option and a put option. A put option works the same way as a call option but in the opposite direction, it limits the advantage an airline can take when the crude oil price is decreasing. The reason behind this combination is that a call option premium is expensive; therefore the airline sell a put option, which creates a “floor” that limits their advantages when a decrease in oil price takes place. However, it will cover some of the call option premium (Morrell & Swan, 2006). The final hedging derivative is swaps. Swaps are a customized contract, which locks in the current price of crude oil and last until a specific future date. This can be made together with a supplier of jet fuel, and ensures both parties protection. The term swaps comes from the situation where the parties swaps money with each other. In other words, if the price increases, the supplier pays the airline for the difference and if the price decreases, the airlines pay the supplier the difference. When hedging, jet fuel itself is only hedged when making direct contracts between two parties, for example an airline and a refinery. Other options is to hedge for example: crude oil or heating oil. If the hedge turn out profitable, the money can then be invested in jet fuel (Morrell & Swan, 2006). The reasoning behind these hedging strategies is not necessarily to save money or increase profits, it is rather a way for the airlines to achieve a more stable cash flow and averaged profits (Morell and Swan, 2006; Lim and Hong, 2014). Furthermore, it should have an impact on the systematic risk for
organizations with high exposure to commodity prices, in this context, jet fuel (Bartram, Brown & Conrad, 2011).
The practice of hedging has increased during the past years since a big part of the operational costs of the airlines are based on the volatile crude oil price. It is difficult for airlines to transfer the costs to the passengers in terms of increased ticket fares due to high competition (Morrell & Swan 2006). The airlines are constantly exposed to fuel risk and increases as crude oil price becomes more volatile (Berghöfer & Lucey, 2014). It is essential for investors to understand these underlying foundations to a company and in an industry with volatile factors that affects the company. Especially in the airline industry where jet fuel prices is a coefficient of risk exposure (Carter et al., 2006).
Stock beta (𝛽) is the same as systematic risk, which is a measurement of non-diversifiable market risk of equity. Furthermore, the stock 𝛽 is the amount of how the stock moves with regards to the whole market. Stock 𝛽𝑠 explains how much risk an asset has in relation to the market and a 𝛽 of 2.0 will on average move 2.0 times of the market return. In other words, if the market increases by 1% the underlying asset would increase by 2%. On the other hand, using one 𝛽 may not be sufficient for estimating the risk; therefore it is necessarily to use several 𝛽𝑠 from different time periods. The 𝛽 value is not measured in terms of volatility but in terms of co-movement. Moreover, 𝛽 is representing a risk that cannot be diversified away. Regarding the 𝛽 value, there are some characteristics of it that should be taken into concern, which are (1) even though 𝛽 is not volatile it is co-movement, it may be changing over time, (2) the 𝛽 for instance may become greater when the market is decline than rising, (3) if not frequently traded it will become biased. (Berk & DeMarzo, 2011). Moreover, the systematic risk is affected by different events that are more or less common for the whole industry, these events can be such as the 9/11 attack, which had an impact on all the operating airline corporations. Moreover, in order to find the company’s expected equilibrium return a model can be applied for doing so, which is the CAPM, which implements the return of the underlying asset, the non-diversifiable risk of the underlying asset (stock 𝛽 ) and the market risk premium: (Berk & DeMarzo, 2011):
Where E(ri) is the expected market return, rf is the risk free interest rate, 𝛽𝑖𝑚 is the systematic risk (stock 𝛽 ) of the underlying asset and 𝐸(𝑟𝑚) − 𝑟𝑓 is the market risk premium.
Previous research has shown that cash flows for airlines are significantly negatively affected by inflation-adjusted changes in jet fuel cost, with a negative correlation of 0,487. Jet fuel prices are therefore a relevant risk exposure for airlines (Carter, Rogers, & Simkins, 2006). They further refer to the framework by Froot, Scharfstein and Stein (1993) who further states that the more negative the correlation is between jet fuel cost and cash flow the more valuable hedging becomes. Hedging in this sense should smooth out the volatility of the jet fuel cost and could in a further extent have an impact on the overall cash flow volatility of airlines.
1.2 Problem Statement
How the oil price volatility might affect the systemic risk (stock betas) in the European aviation sector has not been much elaborated. Previous research conducted provides different views on whether hedging has a cost saving advantage or not, there is a general consensus that it does stabilize swings in cash flows and revenues as well as reduces risk exposure (Bartram et al., 2011; Carter et al., 2006). Bartram et al. (2011) found that firms exposed to commodity prices that hedge their purchases in fact have a lower degree of systematic risk. Volatile cash flows have an implication for investment plans, such as R&D, advertisement and capital expenditures, as well as the cost for investments (Minton & Schrand, 1999). It also has an implication for amount of money raised externally, which will increase and lead to the marginal cost of funds to go up. Thus the variability in a company’s cash flow will lead to a distortion in a company’s investment and financing plans that will be costly and affect the firm value. The rationale is that costly external capital combined with a shortfall in investment opportunities will obstruct growth opportunities (Froot et al., 1993). Specifically for the European airline industry, EBIT growth provides a foundation for airlines to handle operational and financial leverage and thus lower the systematic risk for stocks (Lee & Hooy, 2012). The connection to the objective of this research is that since the purchase of jet fuel constitutes a large fraction of the overall operating costs of airlines, the volatility of oil prices should therefore affect the volatility of airline cash flows. Therefore, have an implication for airline stock betas, through lower growth as a result of shortfall in investment opportunities and high financing costs, since airlines are
particularly negative exposed to the risk of a highly volatile commodity cost compared to other industries (Aggarwal, Akhigbe & Mohanty, 2012)
1.3 Purpose
Based on the rationale that volatility oil prices induces volatile cash flows which could have an implication for systematic risks the objectives of the study are to investigate the correlation of (1) oil price volatility and stock beta, (2) hedging percentages and stock beta. Furthermore, given the low market concentration and deregulation that led LCCs to change the competition in European airline industry, cost management should be especially important; hence there should be a larger impact of negative risk exposure to oil price fluctuations in this region. Therefore the aim of this study is to elucidate the risks induced by oil volatility in the European airline industry by answering following questions:
Research Questions
Is there a correlation between oil price volatility and stock beta in the European aviation market?
Is there a correlation between stock betas and hedging percentages? The study aims to provide a better guide for airline investors in an industry facing small margins and low growth.
1.4 Thesis Outline
The thesis is structured upon seven different chapters, which all are related to one another. The start of the thesis will bring an overview to the reader regarding the topic and will become further specified during the work to reach a final conclusion that will be connected to the purpose.
Following is chapter two where the authors will explore previous literature regarding the thesis topic as well as contribute for the hypothesis stated. Chapter three will elaborate on the methodological approach of the work and why the chosen methods are suitable. The data collection and implementation of the data gathered will be discussed, which further brings up the chosen path of the scientific work. Chapter four will present the empirical findings of the research and be interacted with chapter five which further elaborate upon these findings in the thesis analysis. Chapter six presents will conclude the work, which will fulfill the purpose of the thesis.
2. Literature Review
This chapter introduces the most essential research regarding the subject in line with the purpose of the thesis. In order for the reader to understand the thesis a theoretical background will be presented regarding the main areas. Finally the hypothesis of the work will be presented.
2.1 Oil Price Volatility and Stock 𝜷𝒔
Previous research regarding the transportation sector and oil price volatility shares a consensus that companies in this sector are vulnerable to sudden swings in oil prices: Oil price shocks have a large impact on the transportation sector on the returns as well as the equity risk. Furthermore, it was found that in the S&P transportation sector, market concentration is negatively related to oil price risk (Aggarwal et al., 2012). Another previous study of the US airline industry found that airlines are exposed to risks more frequently during periods of high and/or rising prices of oil (Treanor et al., 2014).
Jones and Kaul (1996) examined the stock markets in The US, Canada, United Kingdom and Japan. They conduct this study by creating a regression in two steps where they checked the effect of oil shocks on cash flows in the first step and then checked for the correlation between oil price shocks and real stock returns. The empirical results that are shown in this research shows that stock returns are correlated with changes in expected cash flows and that oil shocks have a significant impact on stock returns. In line with this, previous published research agrees that oil prices have a correlation with the cash flows of airlines. Carter et al. (2006) tested how well airline stock prices in the US correlates to jet fuel prices using a monthly time series regression and found a negative correlation (-.11). They also found a negative correlation between cash flows and jet fuel prices (r =-.526). In parity with this, Minton and Schrand (1999) argue that volatile cash flows increases the demand for externally money raised (debt) as well as it affects investments plans. Froot et al. (1993) argued in a similar manner that a high cost for raising external capital in combination with a shortfall in investment opportunities leads to less EBIT growth opportunities. The link to the European airline industry is that Lee and Hooy (2012) examined three panels of listed airlines from Europe, Asia and US to address the main determents of systematic risk for airlines in these regions. They found that for European airlines, EBIT growth is significant negatively correlated to systematic
risk. This means that when EBIT grows, the stock 𝛽 should be reduced, ceteris
paribus.
EBIT growth is one variable that affect the stock 𝛽. However, speaking of firms in a general sense, the increased debt followed by volatile cash flows, as stated by Minton and Schrand (1999), means that the stock 𝛽 will be directly affected given that the amount of equity is held constant according to Modigliani and Miller (1958)
Nandha and Faff (2013) provide opposing findings from previous conception regarding oil price volatility and its implicit effects on stock 𝛽 through cash flow volatility. They found that oil price volatility alone does not significantly affect airline stock risk and returns; it is rather the combination of oil volatility and major crises such as 9/11, which have an implication for oil regimes. They found that this combination have a significant effect on stock risk and returns.
There are other variables that might that might affect stock 𝛽. Song, Rao and Woo (2007) conducted a research that is based on stock returns in the airlines industry when assessing different determinants of airline stock returns. They found that code-sharing alliances are beneficial for investor wealth since it increases stock returns with increasing stock prices. A connection could be made to Iqbal and Shah (2012) who found a negative correlation between market value of equity (market capitalization, which is affected by an increasing stock prices) and systematic risk in general among non-financial firms. Further, Lee and Hooy (2012) found that operational leverage (∆𝐸𝐵𝐼𝑇𝐸𝐵𝐼𝑇 𝑥 𝑆𝑎𝑙𝑒𝑠
∆𝑆𝑎𝑙𝑒𝑠) has a significant positive correlation for systematic risk among the European airlines sampled in their study.
2.2 Hedging
Previous research in the field of airline jet fuel hedging agrees to a large extent that hedging is not used to cut costs nor enhance profits (Morell and Swan, 2006; Lim and Hong, 2014). Lim and Hong (2014) tested what implication jet fuel hedging have for the operating costs for US airlines (2000-2009) and found that hedging airlines had 9-12% lower operating cost, however this was statistically insignificant thus a correlation between hedging and lower operating costs could not be assessed. Bartram, Brown and Conrad (2011) examined how the uses of derivatives generally influence firm risk and assessed non-financial
firms from 47 countries to check for differences between derivative using firms and non-derivative using firms. They found that, on average, derivative users have cash flow volatility that is 50% lower than non-derivatives users. Moreover, they found that stock return volatility and stock 𝛽s are 18% and 6% lower respectively compared to non-derivatives users. Rao (1999) tested airlines pretax earnings sensitivity to price volatility of heating oil and found that hedging policy through derivative instruments reduced the volatility of quarterly pretax income with 23% over the sampled period (1988-97). In line with this, Morell and Swan (2006) argue that the aim for airlines that hedge is to keep profits at a stable level. Airlines that choose to hedge their jet fuel purchases in times of political uncertainty in oil-producing regions and remain passive during stable periods reduce their earnings volatility. Further, they refer to economic fundamentals that hedging will not generate excess profits in the long run since the bet is evenly distributed between seller and buyer, which would be a case of speculation rather than hedging. The underlying reason why hedging might still be affecting equity value could originate from signaling management competence, thus hedging is rather a “fashion statement”. They claim that both investors and management tend to believe that hedging in fact have an implication for equity value, thus it is a self-fulfilling prophecy. They reason on how airlines choose to deal with jet fuel in the following order: first the airlines try to be more efficient with the use of jet fuel in their operations. Second, they try to pass increased input prices (in terms of cost of jet fuel) to paying customers by surcharges on ticket prices and ultimately they manage the jet fuel purchases through hedging with derivative instruments. Due to increased competition the surcharges to customers have not been a successful strategy for passenger airlines in the past, although cargo carriers such as FedEx manage to do this for shipping customers.
Modigliani and Miller (1985) presented a theory of investment and capital structure. In the first proposition regarding profit maximization it is stated that, in a perfect capital market, investors are indifferent about investing in levered firms or unlevered firms. That is, the capital structure of firms are not relevant since different income streams could be exchanged for one another and thus the risk is eliminated. Briys and Crouhy (1993) elaborates on hedging firms based on this theorem and an underlying assumption is that it is not beneficial for corporations to eliminate financial risk through hedging since shareholders themselves can hedge through a diversified portfolio at the same or lower cost.
However, it is concluded that hedging could be beneficial for firms since risk management can be required by loan covenants and it could even lower borrowing costs. Froot et al. (1993) agrees and found that hedging can reduce the uncertain fraction of cash flows, thus reduce risk exposure for firms. More stable cash flows then generate less dependency on external raised funds and lower cost of debt, which would enhance firm value as a result of increased investments. They also elaborate on the cost of underinvestment, which is when firms relinquish safe investments in low-value assets that result in steady cash flows with limited excess return, since this return would be most favorable to debt holders. The underinvestment hypothesis (or financial constraint theory) is created which states that (1) if a firm is financial limited and dependent on expensive external capital, firms will underinvest if the cash flow is low (2) if the investment opportunities are correlated to cash flow, hedging is less necessary since low cash flows will generate low investment opportunities and vice versa,
ceteris paribus. Rampini, Sufi and Viswanathan (2014) used panel data of airlines
to regress the fraction of hedging with net worth, credit ratings and market value of net worth. They found strong significant correlation between net worth as well as credit rating and the fraction of hedging for these airlines.
Carter et al. (2006) build on the general underinvestment framework by Froot et
al. (1993) and apply it to the US airline industry. They found that hedging allows
airlines to manage variation in cash flows, in line with the general underinvestment framework they conclude that large airlines that hedge are therefore able to invest in low valued assets (such as spare parts for aircraft) from distressed airlines in times of increasing jet fuel prices.
Treanor et al. (2014) look at how hedging decisions is influenced by risk exposure proxies (fuel price level, direction of fuel price and the fuel price volatility) in the US airline industry. They found that airlines hedge a higher percentage of their jet fuel requirement the upcoming fiscal year (y+1) when jet fuel prices and returns are on the rise during present fiscal year (y). The conclusion drawn is that when jet fuel prices are low or falling, airline managers tend to underestimate the benefits that are associated with hedging when the oil regime quickly change, which leads to a rapid rise of jet fuel prices. In those scenarios management might not be able to deal with the consequences of the increased risk exposure.
Morell and Swan (2006) highlight one aspect of hedging. Even though the main objective is to seek a risk reduction in the negative risk exposure of volatile jet fuel prices, the risk of exchange rates remains. Jet fuel spot prices are oftentimes denominated in US dollars and so are future and forward contracts. The exchange risk movements is a source of negative risk exposure since airlines based outside of the US often lack natural hedge such as ticket sales in US dollars. The inflow of cash does not match the outflow cash in terms of currency and so airlines outside the US face the risk of an appreciation of the US dollar, of course there is also an opportunity that the US dollar will depreciate.
2.3 Summary and Hypothesis Building
There is a consensus in the literature that oil prices have an impact on cash flows (Jones & Kaul, 1996); Carter et al. 2006). Minton and Schrand (1999) argues that volatile cash flows leads to a situation where firms requires externally raised capital in forms of debt and that this will lead to a decline in investments and thus obstruct valuable investment opportunities which would result in subdued growth opportunities. Lee and Hooy (2012) found in their research that EBIT growth in turn is negatively correlated to stock 𝛽 for European airlines. This could mean that, ceteris paribus, oil price volatility imply cash flow volatility for which (1) external capital becomes expensive and more necessary which could lead to the underinvestment cost as presented by Froot et al. (1993). (2) Investment opportunities can be obstructed and accompanied with lower growth which would lead to increased stock 𝛽s as presented by Lee and Hooy (2012). Furthermore, Aggarwal et al. (2012) found that a low market concentration (which is the case in the European airline industry) is related oil price risk. We therefore hypothesize that:
HI – There should be a positive correlation between oil price volatility and stock 𝛽s among the European airlines sampled.
In the literature there is also a consensus that hedging pursued by firms tend to reduce volatile cash flows and stock 𝛽s (Bartram et al. 2011; Froot et al. 1993). Carter et al. (2006) agrees with this and state that airlines which hedge jet fuel did reduce their cash flow volatility and negative risk exposure from jet fuel prices. Further, Rao (1999) found that hedging reduces the volatility of pretax income, which is in line with Lee and Hooy (2012) since volatile earnings could obstruct EBIT growth. Carter et al. (2006) builds on the underinvestment
framework presented by Froot et al. (1993) and state that airlines that hedge are able to invest in a larger extent when oil prices goes up by purchasing low-valued assets from distressed airlines that do not hedge. Rampini et al. (2014) findings can be connected to the findings of Froot et al. (1993) regarding stable cash flow and less dependency on external capital. They found that airlines hedging airlines had a higher credit ranking and higher net worth, which implies a lower ratio of debt to assets.
This could mean that airlines that hedge will experience (1) more stable cash flows and profits. (2) Stable cash flows seems to result in higher credit ratings and higher net worth (lower proportion of debt) (Rampini et al. 2014), as well as less dependency on external capital and investment opportunities based on the underinvestment framework (Froot et al. 1993), which could facilitate EBIT growth opportunities (as mentioned by Lee and Hooy (2012)) and thus reduce stock 𝛽s. Therefore we hypothesize that:
H2 – There should be a negative correlation between stock 𝛽s and the percentage
Berghöfer and Lucey (2014) found that there are other variables than the risk exposure to oil price volatility that affects the total risk exposure for airlines. One parameter they measure is fleet diversity and they conclude that a more diversified fleet (a wider range of aircraft types) will increase risk exposure. Dobruszkes (2006) discuss that there are characteristics of LCCs that differ from traditional airlines when it comes to cost structure since LCCs aim to receive lower unit costs. (1) LCCs utilizes smaller rural airports in a larger sense (2) LCCs often utilize low wage labor as a result of the extended borders of EU (3) LCCs have reduced their fleet diversity and utilize a more standardize fleet. These aspects are cost advantages for LCCs compared to tradition airlines. This can be linked to Lee and Hooy (2012) who found that operational leverage is positively related to stock 𝛽s. It can also be linked to the findings of Jang and Lee (2007) who found that profitability among airlines is negatively related to stock 𝛽s. It could, ceteris paribus, be differences of how stock 𝛽s correlates to oil prices volatility compared to traditional airlines based on these parameters, which should alternate risk exposure. Therefore we hypothesize that:
H3 – LCCs should have a lower correlation between oil price volatility and stock 𝛽s than traditional carriers.
3. Methodology and Method
This chapter regards both the chosen method and approached of the methodology and method. In the first section the chosen research approach, design and philosophy are introduced. In the second section, the thesis data collection and analysis of the data collected are presented. Finally the credibility of the data will be discussed.
3.1 Methodology
This paper is based on a quantitative design by gathering secondary data and analyzing the results by looking at statistical correlations between the chosen variables. Quantitative research is in a large sense based on measurement of amount (Kothari, 2004). This research is dealing with correlations between different variables that are readily available through secondary data gathering and then measured in SPSS, which makes the quantitative design most suitable given that factual empirical evidence is going to be found. The research is going to be objectively since the aim is to provide empirical evidence of how phenomena are ought to be, in line with the descriptive approach. This will be done using the statistics program SPSS which is the most used program when it comes to data analysis (Bryman, 2012).
When deciding upon what research design to use, it is important to be aware of and understand the philosophical commitments, due to its influence on the research process and outcome that is conducted by the authors. Different philosophies can be used depending on the research design chosen, which could be qualitative, quantitative or mixed research. In this case, positivism was the chosen research philosophy given the quantitative nature of the research. Since positivism is chosen to be reflected upon, the researchers will look from the standpoint of the traditional scientist. This means that the researchers will look at factual information gained through the research conducted. Furthermore, when choosing positivism the researchers decide to put human interests and feelings aside and mainly focus on the facts that are in front of them, to draw conclusions (Saunders, Lewis, Thornhill, 2009).
By using a larger sample sizes (in this case longer period of observation in regards to stock 𝛽s and oil volatility) the more accurate will the SPSS correlation become. The research is based upon non-probability sampling where certain units of input are preferred (Bryman, 2012). The reason for the chosen approach
is because of the subject chosen for the research. Since the thesis will examine the correlation between (1) oil price volatility and airline stock 𝛽s and (2) the correlation between hedging percentages and stock 𝛽 s, a non-probability approach is suitable since the units examined need to be chosen beforehand to find the most appropriate data. It has been necessary to distinguish those airlines that are listed in the stock exchange and those who are not in order to collect the stock 𝛽s. It is not possible to gather stock 𝛽s for non-listed airlines so therefore these were not relevant for the research. Furthermore when choosing airlines to base the research on.
It can also be said that the research is purposive because it is conducted in a strategic way so that data gathering is relevant to the research questions (Bryman, 2012). This type of research approach distinguishes itself from convenience sample, which focus on the ease of gathering information (Bryman, 2012).
In line with the non-probability sampling is the self-selection of the samples used in the thesis. There are certain variables (stock 𝛽s, oil prices and hedging percentages) that have to be gathered in order to accomplish the work. By using self-selection the sampling method determents which units of input that can be used in the research and which cannot (Saunders et al., 2009). From investigating annual financial reports of the sample as well as exchanging emails the data has been collected from the respondents as well as databases.
The research approach used is a deductive approach where the hypotheses are stated based on previous theories and where the observation made in this research can determine if hypotheses should be confirmed or rejected (Creswell, 2014). The theories that the research is based are established theories in the discipline of finance, which states that (1) commodity hedging does minimize cash flow volatility and (2) cash flow volatility has an implication for risk exposure. The aim of this research is therefore to fill a gap by hypothesize that there is a correlation between oil price volatility and stock 𝛽s as well as hedging have an impact on stock 𝛽 s. By using scientific data this research aims to confirm or reject these hypotheses. From using pre-determined research questions and hypotheses, the whole study will gain a clear guideline of which direction to work in.
In a descriptive research an adequate method for measurements has to be clearly defined as well as a clear-cut definition of the population that will be studied (Kothari, 2014). This research is therefore further based on a descriptive approach because variables gathered (stock 𝛽s, hedging percentages and oil price volatility) were predefined from the beginning and so was the method of measurements when using SPSS to correlate these variables as a mean to describe characteristics of the whole population, in this case the European aviation market. In this study, the aim was to gather data from the 50 largest airlines in Europe, which would make a good representative of the defined population (airlines in Europe). Furthermore, the study in line with a descriptive approach is the formation of close-ended questions and the predetermined analysis approach. From using such an approach, the collection of data will be fully structured so that no unnecessary data collection is done (Kothari, 2004)
3.2 Method
3.2.1 Data Gathering
The data gathered was secondary data and publicly accessible (both regarding Airline stock 𝛽s and oil spot prices as well as airline hedging percentages). Before collecting stock 𝛽 values for the 50 largest European airlines, the authors checked that the airlines were listed on a stock exchange. The removed airlines are either (1) state owned (2) private owned (3) recently gone through IPO, which makes the time frame too short for analysis. There were also airlines that are a part of corporate conglomerates (such as Virgin Atlantic) as well as airlines that are part of a travel group (such as Jet2.com) that were excluded from the data gathering because we wanted to limit this research to airlines. By excluding companies where airline operation only constitute a fragment of the overall operations, the benefit is that the output provided will be more relevant. The remaining sample constituted of 16 European airlines as follows:
In the first step, we gathered quarterly stock 𝛽 values for these airlines over a five-year period (2010-2015) from DataStream and sectioned them by the main groups LCCs and traditional airlines. When determining LCCs we based the selection on a comprehensive list of LCCs from International Civil Aviation Organization (ICAO, 2003).
We also gathered information regarding if airlines did hedge between 2010 and 2015, and the amount hedged (as measured in percentage of the upcoming fiscal year jet fuel purchases). The data was gathered from publicly accessible financial statements from the airlines chosen as well as reaching out to airlines through personal contact to access more detailed information such as interim reports. The number of Airlines collected for this sample was further limited to seven airlines due to the fact that hedging information is not required to be included in financial statements, and was thus not always accessible. Airlines included in this sample are (1) Air France-KLM (2) Air Berlin (3) Lufthansa (4) Norwegian (5) Ryanair (6) SAS (7) Turkish Airlines.
In the second step, we gathered daily spot prices of the crude oil prices (dollar per barrel) from 2010 to 2015, the crude oil prices were gathered from Federal Reserve Economic Data1 from 2010-01-01 to 2015-12-31. The high frequency of
daily spot prices enables us to compute quarterly volatility during this period.
3.2.2 Implementation
To be able to compute a correlation between crude oil price volatility and beta value of the same quarter we needed to access daily crude oil spot prices during these quarters (periods 2010-01-01 to 2015-12-31) in order to collect high frequency data to compute the average quarterly volatility of crude oil. The volatility was computed in three steps. First, the daily returns of the spot oil prices was computed by the commodity’s logarithmic returns based on the same method for computing logarithmic returns of tradable securities:
X = ln (𝑃(𝑃𝑡)
𝑡−1)
Where P is the spot price of crude oil on day t and Pt-1 is spot price of crude oil of the observable period and X is the daily return. Computing the logarithmic
returns is beneficial when computing returns with a higher frequency (such as daily returns over a quarter) because this method is based on continuously compounded returns and so the frequency of compounding will not affect the sum of the singe period returns (Hudson & Gregoriou, 2015).
In the second step, the standard deviation of returns (daily volatility) was computed: 𝜎 = √1 𝑁∑(𝑥𝑖 − 𝜇) 2 𝑁 𝑖=1
Where μ is the value of the mean daily returns during the quarter, 𝑁 is the number of observations during the quarter (trading days). These observations were selected to match the days used to compute quarterly 𝛽 in Datastream. 𝑥𝑖 is the daily return for observation 𝑖.
In the third step the standard deviation for the daily returns was multiplied by the square root of number of observation periods in that quarter to access the average quarterly volatility of crude oil spot prices:
𝜎(𝑞𝑢𝑎𝑟𝑡𝑒𝑟) = 𝜎𝑑√𝑁
Where 𝜎𝑑 is the daily average volatility and N is the number of observations in one quarter.
At the final step, we ran a bivariate correlation analysis in SPSS to see how the stock 𝛽 values correlates oil price volatility to determine if volatile oil prices correlates to an upward pressure on stock 𝛽 (positive correlation), which was hypothesized to happen. Another analysis was made to check for correlation between hedging (as measured in percentage of total jet fuel purchases) and the airline stock beta values. In cases where only the annual hedging percentages could be accessed, these were set as an average for the quarterly hedging percentages in order to achieve the same frequency as the stock 𝛽 values. Before accessing the output from the correlation we used predetermined cut-off levels of correlation as follows:
0 to -0.3 and 0 to 0.3 indicates a weak correlation
-0.3 to -0.7 and 0.3 to 0.7 indicates a moderate correlation -0.7 to -1 and 0.7 to 1 indicates a strong correlation
4. Empirical Findings
This chapter will present the empirical findings received from the research, which will answer the research questions presented in the purpose.
The purpose of this research was to examine if there is a correlation between the volatility in the spot prices of jet fuel (highly correlated to the spot prices of crude oil which was used in the analysis) and the stock beta movements of airlines in Europe. The purpose was also to examine if hedging strategies pursued by airlines have a correlation with stock 𝛽s.
4.1 Findings: Correlation of Stock 𝜷 and Oil Price Volatility
The first hypothesis was that there should be a correlation between price volatility of crude oil and stock 𝛽. The output presented here from the bivariate correlation in SPSS shows an overall weak correlation between the two variables where 37,5% of the sampled units (36% of the traditional carriers and 40% of the LCCs) showed a significant correlation. Among the traditional carriers, the ones that showed significant correlation were Aeroflot (r=.383, p=-066), Croatia Airlines (r=-.580, p=.033), Icelandair (r=.510, p=.011) and SAS (r=.572, p=.003). Among LCCs, the ones that showed a significant correlation were EasyJet (r=--.454, p=.026) and Norwegian (r=-.400, p=.053)
The output showed a moderate correlation and goes in line with the hypothesis that there actually exists a correlation between the two variables. The correlation was overall positive for the Traditional carriers where the correlation was significant; an exemption from this is Croatia Airlines. The correlation was
negative for the LCCs where the correlation was significant. The differences
between these two subgroups of airlines could indicate that there are underlying differences that result in different behavior of the stock 𝛽 in response to price volatility of crude oil. The remainder of airlines (p>.1) showed an insignificant output and therefore there is no correlation that can be assessed. The output from the first correlation is shown below:
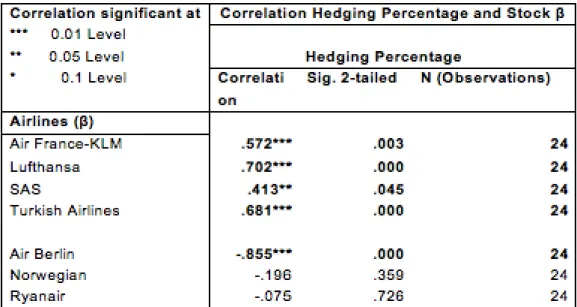
4.2 Findings: Correlation stock 𝜷 and Hedging Percentages
The second hypothesis was that there should be a negative correlation between airline stock 𝛽𝑠 and how much airlines hedged their purchases of jet fuel. The output presented here shows an overall positive correlation between the two variables where 71% of the sampled units showed a significant correlation. The ones that showed a moderate correlation were Air France-KLM (r=.572, p=.003) and SAS (r=.413, p=.045). The ones that showed a strong correlation were Lufthansa (r=.702, p=.000), Turkish Airlines (r=.681, p=.000) and Air Berlin (r=-.855, p=.000). Air Berlin was the only airline that showed a negative correlation between hedging percentage and stock 𝛽 while the remainder showed a moderate to strong positive correlation. The output presented here is not in line with the second hypothesis. The output from the second correlation is shown below:
5. Analysis
This chapter will analyze the empirical findings of the thesis. Further, interpretations from different perspectives will be made.
The empirical findings from our research shows that oil volatility do not have a significant impact on airline stock 𝛽s overall. This has been concluded before in research by Nandha and Faff (2013) where they found that oil volatility alone do not have a large impact on stock 𝛽s of airlines, it is rather the effect of oil price volatility combined with changing oil regimes as a result of triggering events such as 9/11 and the gulf war crisis that do have an impact on the stock 𝛽s. Their findings could support why oil price volatility in general did not show a strong correlation to the stock 𝛽s in this sample.
The low overall correlation presented could also indicate that (1) there is a weak link between oil price volatility and cash flow volatility or (2) that there is a link between oil price volatility and cash flow volatility but that other variables affect stock 𝛽 s more than cash flow volatility. One example of this is that
Berghöfer and Lucey (2014) found that airlines who use financial hedging reduce their exchange rate risk exposure with approximately 40%. Since European airlines purchase jet fuel in US dollars it could be argued that a large fraction of the risk exposure from european airlines comes from exchange rate risk and thus could be reflected in stock 𝛽s. Another variable that could be reflected in the stock 𝛽 s is the impact on risk exposure from operational hedging; Berghöfer and Lucey (2014) found that operational hedging have an impact on overall risk exposure and that a reduction in fleet diversity affect risk exposure. This is especially true for the European airline market where fleet diversity has been reduced by 23,12%.
Morell and Swan (2006) argue that fuel prices cannot be passed to paying customers due to the large competition in the industry. However, they also state that large airlines that also handle cargo have been able to surcharge the jet fuel prices to paying cargo customers. This could be an explanation why the airlines with large cargo handling such as Lufthansa, British Airways (part of IAG) and Air France-KLM do not have a significant correlation between stock 𝛽 and oil
price volatility; they do not face the same risk exposure to jet fuel prices and thus the stock 𝛽 is not responsive to oil price volatility.
The crude oil prices (and thus jet fuel prices) increased rapidly post 2008 financial crisis when the price of crude oil dropped. The reason for the overall low correlation in this case can be connected to the findings by Aggarwal et al. (2012). They conclude that risks are increased mainly by oil price declines, since the oil prices have increased compared to post 2008 financial crisis, the stock 𝛽𝑠 in our research might not respond to the risk exposure induced by oil price volatility as much.
Altough there was a weak correlation in general among the sampled airlines, some airlines showed a moderate correlation (SAS, Croatia Airlines, Icelandair and
Aeroflot). This is in line with the first hypothesis, which could mean that the oil
price volatility during the sampled period could have induced cash flow volatility. In fact, when acessing the Amadeus database2, SAS and Aeroflot
showed high cash flow volatilites (192% and 130% respectively) and Icelandair had a cash flow volatility of 24% during this time period. If this is due to the oil price volatility, the findings are in line with Carter et al. (2006), whom concludes that oil prices are correlated to cash flows. The link to the underinvestment theory (Froot et al. 1993) and the connection to obstructed EBIT growth (Lee and Hooy, 2012) is less apparent since these airlines showed significant average EBIT growth between 2010-2015, which would not be the case if cash flow volatility induced obstructed EBIT growth. This means that oil price volatility could explain cash flow volatility but that cash flow volatility affect other variables than EBIT growth that could have an implication for stock 𝛽𝑠. Lee and Hooy (2012) found that operational leverage is one determinant for stock 𝛽𝑠 in the European airline industry while Jones and Kaul (1996) found that stock returns are affected when oil price volatility have an implication for cash flows due to speculative dynamics, and according to CAPM stock returns could have an implication for stock 𝛽𝑠.
It was hypothesized that LCCs would have a lower correlation than traditional carriers and although only Norwegian and Easyjet showed significant
2Can be accessed through Amadeus Database:
https://l.facebook.com/l.php?u=https%3A%2F%2Famadeus.bvdinfo.com%2FSearch.QuickSearch.serv %3F_CID%3D1%26context%3DTXSM8FNK2A0BG1V&h=OAQEZny32
correlation, these were both negative. Aggarwal et al. (2012) concludes that profitability have an impact on the oil price risk exposure, high profitability results in a low oil price risk exposure. An explanation for the negative correlation here could be that LCCs are the most profitable airlines in Europe (CAPA, 2015) and therefore the stock 𝛽𝑠 might be pressured down as a result of this lower exposure to oil prices and therefore do not respond to oil price volatility. In fact, LCCs have another cost structure (Dobruszkes, 2006; Graham
et al. 1983; ICAO, 2003), which implies different operational leverage.
Operational leverage have a correlation to stock 𝛽𝑠 (Lee & Hooy, 2012) and it could be that it is rather this variable acting as a proxy variable for the stock 𝛽𝑠 during the sample period and that in this case the stock 𝛽𝑠 moved in opposite directon against oil price volatility based on this hidden variable.
Looking at Table 3, the empirical findings showed a strong positive correlation overall between stock 𝛽𝑠 and hedging percentages, altough Air Berlin showed a strong negative correlation to hedging percentages. We hypothesized that there would be an overall negative correlaton between stock 𝛽𝑠 and hedging percentages pursued by airlines during this time period. We based the hypothesis on previous findings that hedging reduce volatile cash flows (Carter
et al., 2006) and that stable cash flows leads to to more investments based on the
underinvestment framework (Froot et al., 1993), this in turn would lead to growth which is negatively correlated to stock 𝛽𝑠 in the European airline industry (Lee and Hooy. 2012). Furthermore, Bartram et al. (2011) found that among firms in general, derivative users experience stock 𝛽𝑠 that are 6% lower on average compared to non-derivative users.
What should be noted is that Lufthansa, Air France-KLM and Turkish airlines did not show a correlation between stock 𝛽𝑠 and oil price volatility while there was a strong correlation for these airlines between stock 𝛽𝑠 and hedging percentages. This could imply that (1) for these airlines, hedging did in fact reduce the risk exposure for jet fuel prices which is in line with the findings of Carter et al. (2006). It could also imply that these airlines in fact (2) did not offset stock 𝛽s because there could have been other proxy variables such as exchange risks that affect the total risk exposure (Berghöfer & Lucey, 2014; Morell & Swan, 2006) and thus is reflected in stock 𝛽𝑠 regarldess of jet fuel hedging policy. For SAS on the other hand, which showed a positive correlation both in regards of stock 𝛽𝑠 and oil price volatility as well as stock 𝛽𝑠 and hedging
percentages the empirical findings presented here could be explained by Treanor et al. (2014). They argue that airlines hedge when jet fuel prices and returns are high and increasing and that management tend to underestimate the need for hedging instruments when jet fuel prices are low. One implication of this could be that when oil prices are volatile, management choose to hedge in a larger sense, which implies selective hedging rather than a stable long term hedging policy. Therefore, the connection to our findings could be that stock 𝛽𝑠 indeed are affected by oil price volatility but through selective hedging, management did hedge accordingly but hedging did not offset systematic risk because the policy was not implemented in a timely manner. Morell and Swan (2006) put it as the management choose to hedge to “signal the competence of
management to investors and stakeholder”.
Since there was a weak overall correlation between stock 𝛽 s and oil price volatility we cannot find evidence to conclude that oil price volatility induce a higher systematic risks for the airlines sampled. Neither did the empirical findings show a negative correlation between airline hedging percentages of jet fuel and stock 𝛽s which would be the case if hedging should have reduced the systematic risk for the airlines sampled, this is in contrast to the findings of Bartram et al. (2011) that derivative users reduce stock 𝛽s by 6% on average. However, while Bartram et al. (2011) conduct their research on general firms and looked at total use of derivatives, we look at the systematic risk of airlines based on hedging of jet fuel, altough the implication of the empirical findings presented shows a weak link between oil price volatility and systematic risk, it does not conclude that oil price volatility is an negligible risk exposure variable for airlines, rather that there could be other proxy variables affecting systematic risk more than oil price volatility.
6. Conclusion
These chapter pursuits to narrow down the essential findings from previous chapter as well as previous literature presented in the thesis. The aim of the conclusion is to ensure that the purpose has been fulfilled.
In this paper, we use a sample of 16 European airlines to analyze if oil price volatility has an implication for airline stock 𝛽 s and if hedging has an implication for airline stock 𝛽𝑠 by using a bivariate correlation in SPSS. Since oil prices constitute a large fraction of the overall airline operating costs and is a relevant risk exposure coefficient for airlines, the aim of this study was to find out if there: (1) was a correlation between oil price volatility and airline stock 𝛽s to determine if the systematic risk is influenced by oil price volatlity and (2) if there was a correlation between airline stock 𝛽s and hedging percentages to determine if hedging policy have an implication for the systematic risk for airlines in Europe. The empirical findings regarding the correlation between oil price volatility and stock 𝛽s shows that there is on average a low correlation. The most reasonable interpretation from this output is that oil price volatility itself do not have a large impact on airline stock 𝛽s. A few exceptions were shown in the output, namely Aeroflot, Croatia Airlines, Icelandair and SAS showed a significant moderate correlation. It appears likely that other variables have an implication for the stock 𝛽s.
The empirical findings regarding the correlation between stock 𝛽s and hedging percentages shows an overall significant strong positive correlation with the exception of Air Berlin that showed a negative correlation, as hypothesized. The reasonable intepretation from this study is that hedging policies do not lower the systematic risk for the airlines sampled but rather appears likely that systematic risks in this sample are influenced by other proxy variables that was not measured in this analysis. Thus, jet fuel hedging did not seem to offset the systematic risk for the airlines sampled.
7. Discussion
This chapter discusses the final thoughts, limitations of the thesis as well as to whom this research may concern.
7.1 Limitations
The purpose of this study was to analyze the European aviation industry, however the limitation of only addressing this region is that the sample size became limited. Although our hope was to gather data from a large sample to be able to describe the population in line with the descriptive approach, out sample was reduced to 16 airlines. One explanation for this is that many European airlines that are based in former Soviet states are state owned and not listed on the stock exchange, but also that there have been a trend of merging of airlines such as (1) Lufthansa Group which constitutes of Austrian Airline, Lufthansa, Swiss Air and Germanwings (2) IAG which constitutes of British Airways, Aer Lingus, Iberia and Vueling (3) Air France-KLM which is a merger of the two former independent airlines. The limited size of the final sample is an example of external validity, which measures how well the results, can be generalized to the population. In this case the size of the sample (the period and frequency measured for stock beta, oil price volatility and hedging percentages) could have required longer timeframe and/or higher frequencies, which could have minimized the risk of sampling error and thus provide a more statistical significant output (Bryman, 2012).
Another limitation is that hedging percentages was not always readily accessible through financial reports. Therefore, the sample size when correlating hedging percentages and stock 𝛽 s was reduced further due to the reduced number of airlines. Moreover, since quarterly hedging percentages were not always available the average computation of annual hedging percentages could have resulted in inaccurate variables when running correlation against the quarterly stock 𝛽s.
There was a limitation using bivariate correlation since (1) the bivariate correlation run by SPSS does not provide a directional relationship between variables, thus a case of internal validity that deals with causality of the two variables appears (Bryman, 2012). However, in the first correlation (oil price volatility and stock 𝛽s) it was assumed that the stock 𝛽s for airlines do not affect
the world price of crude oil, so therefore a causal relationship was taken for granted in cases where significant correlation could be established. In the second correlation (hedging percentages and stock 𝛽 s) the case of internal validity becomes more important because the direction of a correlation in this case can go both ways and therefore a directional relationship could not be established from this research. (2) There could have been other variables that affected the output. Lee and Hooy (2012) state that for US airlines, operational leverage (measured as ∆𝐸𝐵𝐼𝑇𝐸𝐵𝐼𝑇 𝑥 𝑆𝑎𝑙𝑒𝑠
∆𝑆𝑎𝑙𝑒𝑠) is positively correlated to systematic risk, they further found that for European airlines this correlation is moderate and therefore it could have an implication for the systematic risk (stock 𝛽) in this sample. This variable could have been used as a control variable in a partial correlation to reduce any distortion that might have been caused by this variable, but also to address this variable in further detail. Nevertheless, the aim of this study was to find out if oil price volatility correlates to stock 𝛽s and if stock 𝛽𝑠 correlates to hedging percentages and thus find out if hedging policy has an implication for the systematic risk of airlines. The method chosen, although the limitations provided, is a straightforward approach and it clearly addresses the relevant research questions.
7.2 Implications
The implications from the empirical findings in this research serves as an interest for investors whom are concerned with the risk of equity invested since hedging historically have been used to signal management competence to attract investments. The positive correlation between hedging and stock 𝛽s as well as the overall weak correlation between stock 𝛽s and oil price volatility implies that in fact hedging do not really reduce systematic risk or that oil price volatility have a large implication for systematic risk in the first place.
7.3 Further Research
There are opportunities for future research on this topic. It could be interesting to elaborate more on the proxy variables mentioned: operational leverage (Lee and Hooy, 2012) and profitability (Jang and Lee, 2007), which have been shown to affect stock 𝛽s in the airline industry, and to analyze how oil price volatility affects these variables in the airline industry. This could be done through
multi-regression modeling. To our knowledge, there is currently no such research published.
Another opportunity for further research could be to elaborate on the underinvestment framework presented by Froot et al. (1993). This could be an investigation of how oil price volatility affects cash flows for airlines and what implication that have for debt, investments and growth. This would be especially interesting in the European airline industry where the EBIT growth is relatively low.
8. References
Aggarwal, R., Akhigbe, A., & Mohanty, S. K. (2012). Oil price shocks and transportation firm asset prices. Energy Economics, 34, 1370-1379.
Bartam, S. M., Brown, G. W., & Conrad, J. (2011). The Effects of Derivatives on Firm Risk and Value. Journal of Financial and Quantitative Analysis. 46(4), 967-999
Berghöfer, B., & Lucey, B. (2014). Fuel hedging, operational hedging and risk exposure — Evidence from the global airline industry. International Review
of Financial Analysis, 34, 124-139.
Berk, J., & DeMarzo, P. (2011). Corporate Finance (2nd ed.). Boston, Mass.: Pearson
education.
Bryman, A (2012). Social Research Methods (4th ed.). New York: Oxford University
Press, Inc.
CAPA. (2015). Europe's airlines underachieve in profit margins, but LCCs typically
perform better than FSCs. Retrieved March 28, 2016. Available at:
http://centreforaviation.com/analysis/europes-airlines-underachieve-in-profit-margins-but-lccs-typically-perform-better-than-fscs-217527.
Carter, D. A. Rogers, D. A. Simkins, B. J. (2006). Does Hedging Affect Firm Value? Evidence from the US Airline Industry. Financial Management. 35(1), 53-86.
Creswell, J.W (2014). Research Design: Qualitative, Quantitative, and Mixed Methods
Approaches (4th ed.). California: SAGE Publications, Inc.
Crouhy, M. and Briys, E. (1993). Playing against (with?) the devil: Managing financial risks for better corporate return. European Management Journal,