Attenuation AND awareness?
Designing a method for measuring accuracy and certainty of sound
identification when wearing a HPD
Markus Ahlberg
Industrial Design Engineering, master's level 2020
Luleå University of Technology
Attenuation AND awareness?
Markus Ahlberg 2020 SUPERVISOR: Arne Nykänen SUPERVISOR: David Larsson REVIEWER: Petter Abrahamsson EXAMINER: Åsa Wikberg Nilsson
Designing a method for measuring accuracy and
certainty of sound identification when wearing a HPD
CIVILINGENJÖR I TEKNISK DESIGN
M.Sc. in Industrial Design Engineering Luleå University of Technology Attenuaton AND awareness? Designing a method for measuring accuracy and certainty of sound identification when wearing a HPD © Markus Ahlberg Published and distributed by Luleå University of Technology SE-971 87 Luleå, Sweden Telephone: + 46 (0) 920 49 00 00 Printed in Luleå Sweden by Luleå University of Technology Reproservice Luleå, 2020
I would like to thank 3MTM PeltorTM and the acoustics division at Luleå University of
Technology for enabling such an interesting and formative challenge as this thesis. I would like to thank 3MTM PeltorTM for inviting me to an interesting and informative
visit, with special gratitude to Magnus and Oscar for their welcoming treatment and their knowledgeable input.
A special thanks to my supervisor at the acoustics division, Arne Nykänen, who’s always provided insightful feedback and condensed explanations of acoustic phenomena or theory, and has as such helped tremendously in the ease into the previously unfamiliar subject. This also extends to Örjan.
I would also like to extend my gratitude to my supervisor at industrial design engineering, David Larsson, for providing key input, in unwavering good cheer, on how to keep the material accessible, when I tumbled down the rabbit hole of excessive theory.
Finally, I would like to express my gratitude to Luleå University of Technology and my peers – for providing a platform that’s been equal parts socially and intellectually stimulating, where I’ve been surrounded by encouraging, driven and curious minds.
Thanks.
Acknowledgement
Markus Ahlberg
Noise pollution is widespread in today’s society, from traffic to industrial sources, and many people are confined to unhealthy acoustic environments through their employment. When noise cannot be eliminated at the sound source, the protective measure is usually to equip the employee with hearing protection devices (HPDs), e.g. earmuffs, that attenuates the noise. Applying excessive attenuation can render the wearer disconnected from her acoustic environment and present risks and social isolation. HPDs using level-dependent function (LDF) uses ambient microphones together with a signal processing unit and internal
loudspeakers to achieve attenuation flexibility – if ambient noise is low, the loudspeakers can amplify the sound to combat an excessive passive attenuation of the HPD, and if ambient noise is high this amplification is decreased to maintain healthy sound levels.
Appropriate levels of attenuation allows the user to detect ambient sounds which contributes to the their situational awareness. Besides attenuating the sounds however, HPDs does change the spectral content of the sound which may complicate the ability to identify them. This thesis has focused on exploring the human ability to identify sounds, design a method for measuring this ability, implement it and evaluate its result and the method itself. The thesis has been conducted in collaboration with 3M Peltor and was intended to evaluate the effect of earmuffs with LDF on the ability to identify sounds in a process industry soundscape.
The progression of the thesis was structured within the Double Diamond process, where literature reviews, benchmarking and workshops informed the research and resulted in a method design that was analyzed using a repeated measures ANOVA based on empirical data from 16 participants. Surprisingly, the results showed no statistically significant advantage from wearing a HPD using LDF, as opposed to no LDF, in the user accuracy or certainty in sound identification. The reasons for this are discussed with a focus on evaluating the usefulness of the designed method in future efforts to develop HPDs that afford reliable sound identification.
KEYWORDS: industrial design engineering, method design, sound identification, situational
awareness, hearing protection devices, noise pollution, level dependent function
Sammanfattning
Bullerföroreningar är ett utbrett problem i dagens samhälle, från trafik till industriella källor, och många människor är låsta till en ohälsosam akustisk miljö via sin anställning. När buller inte kan elimineras vid ljudkällan är skyddsåtgärden vanligtvis att förse arbetstagaren med hörselskydd, exempelvis hörselkåpor, som dämpar bullret. Att använda en överdriven dämpning kan dock göra att användaren avskiljs helt från sin akustiska miljö och innebära risker samt social isolering. Hörselskydd utrustade med nivåberoende funktion (LDF) använder mikrofoner tillsammans med en signalbehandlingsenhet och interna högtalare för att uppnå flexibilitet i dämpningen – om omgivande buller är lågt kan högtalarna förstärka ljudet för att motverka en överdriven passiv dämpning erbjuden av hörselskyddet, om omgivande buller däremot är högt kan denna förstärkning minskas för att vidhålla sunda ljudnivåer.
Lämpliga dämpningsnivåer gör att användaren kan upptäcka omgivande ljud som bidrar till deras situationsmedvetenhet. Förutom att dämpa ljuden så ändrar dock hörselskydd också det spektrala innehållet i ljudet vilket kan komplicera förmågan att identifiera ljuden. Denna masteruppsats har fokuserat på att utforska människans förmåga att identifiera ljud, utforma en metod för att mäta denna förmåga, implementera metoden och utvärdera dess resultat samt metoden i sig. Uppsatsen har genomförts i samarbete med 3MTM PeltorTM och var avsedd att utvärdera effekten av hörselkåpor, utrustade med LDF, på förmågan att identifiera ljud i ett ljudlandskap likt det i en processindustri.
Projektet var strukturerad enligt Double Diamondprocessen, där litteraturstudier,
benchmarking och workshops har informerat och väglett arbetet och resulterat i en metod som analyserats med hjälp av variansanalys baserat på empiriska data från 16 deltagare. Överraskande nog så visade resultaten ingen statistiskt signifikant fördel med att bära ett hörselskydd som är utrustat med LDF till skillnad från ett hörselskydd som saknar denna funktion, vad gäller användarens förmåga att korrekt identifiera ljud samt rapporterad säkerhet i svaren. Orsaker till detta diskuteras med fokus på att utvärdera användbarheten av den utformade metoden i framtida ansträngningar för att utveckla hörselskydd som erbjuder tillförlitlig ljudidentifiering.
NYCKELORD: teknisk design, metoddesign, ljudidentifikation, situationsmedvetenhet,
1. Introduction ...2
1.1 Stakeholders ...3
1.2 Objectives and aims ...3
1.3 Project scope ...4
1.4 Thesis outline ...4
2. Context ... 6
2.1 Problem analysis ...6
2.2 The process industry ...6
2.3 Benchmarking ... 7
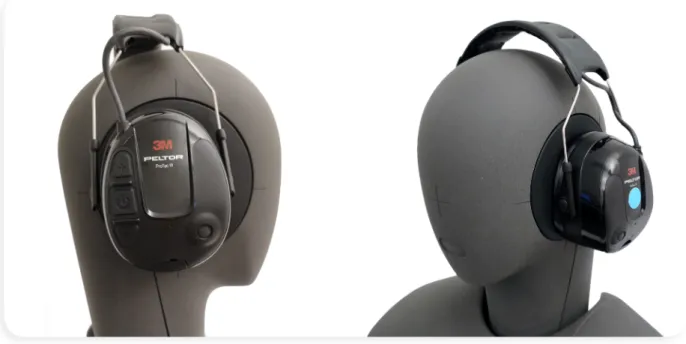
2.4 ProTac III ...8
2.5 3Mtm Peltortm ... 11
3. Theoretical framework ... 13
3.1 Industrial design engineering ... 13
3.2 Acoustics ... 14
3.2.1 Sound pressure & frequency . 14 3.2.2 The hearing system ... 15
3.2.3 Noise & AFS 2005:16 ...16
3.2.4 Pink noise ...16
3.2.5 Masking ... 17
3.2.6 Signal-to-noise ratio (SNR) .. 18
3.3 Situational Awareness (SA) ... 18
3.4 Measuring SA ...20 4. Method ... 23 4.1 Process ... 23 4.2 Project planning ...24 4.2.1 Project diary ...24 4.2.2 The 7P Framework ... 25 4.3 Discover ... 25 4.3.1 Literature review ... 25 4.3.2 Digital workshop ...26 4.4 Define ...26
4.4.1 Company visit & ideation ...26
4.4.2 Method design outline ... 27
4.4.3 Within-subject design ... 27
4.5 Develop ...28
4.5.1 Selection of signals ...28
4.5.2 Recording com triads ...28
4.5.3 Normalization & L10 ...29
4.5.4 Counterbalanced LS ... 30
4.5.5 Software & coding ... 30
4.5.6 Hardware & setup ... 31
4.5.7 Pilot study ... 32 4.5.8 Test subjects ... 32 4.5.9 Code of conduct ... 32 4.5.10 Experiment protocol ... 33 4.6 Deliver ... 33 4.6.1 Analysis ... 33 4.7 Method Discussion ... 35 5. Results ... 37 5.1 Discover ... 37 5.2 Define ... 37 5.3 Develop ... 38 5.3.1 Selection of signals ... 38 5.3.2 Recordings ...39 5.3.3 Noise ...39 5.3.4 CLS & coding ...40 5.4 Deliver ...42
5.4.1 The method design ...42
5.4.2 Analysis ...45
6. Discussion ...51
7. Conclusions ... 55
7.1 Objectives and aims ... 55
7.2 Research questions ... 55 7.2.1 Research questions 1 ... 55 7.2.2 Research questions 2 ... 55 7.2.3 Research questions 3 ...56 7.3 Recommendations ... 57 8. References ...60 9. Appendices ...64 appendix a ...65 appendix b ...68 appendix c ... 72
Content
2 7 8 8 9 10 15 17 17 18 19 20 21 21 23 24 28 29 31 31 32 37 39 40 40 41 42 43 44 44 45 45 46 46 47 49
List of figures
List of tables
9 10 10 20 Figure 1. Illustration of attenuation and acoustic distortion by a HPD.Figure 2. Illustration of in-ear vs. on-ear hearing protection. Figure 3. Illustration of level-dependent function.
Figure 4. ProTac III.
Figure 5. ProTac III - dismantled.
Figure 6. ProTac III - graph of specifications and measures. Figure 7. Anatomy of the hearing system.
Figure 8. Power spectrum in pink noise vs. white noise. Figure 9. Upward masking.
Figure 10. Situational Awareness (SA).
Figure 11. Factors influencing situational awareness. Figure 12. Auditory situational awareness (ASA).
Figure 13. QUASA - Quantitative analysis of situational awareness.
Figure 14. DRILCOM - Detection, Recognition/Identification, Localization, Communication. Figure 15. Double diamond process.
Figure 16. Project planning.
Figure 17. Verbal communication recording Figure 18. Percentile sound level L10. Figure 19. Hardware setup - noise system. Figure 20. Hardware setup - signal system. Figure 21. L10 and frequency measures. Figure 22. 3MTM PeltorTM products.
Figure 23. Spectrograms for communication triads.
Figure 24. FFT average for the 4 channel wav-file with pink noise. Figure 25. Frequency analysis of the noise system.
Figure 26. One question round. Figure 27. Method information.
Figure 28. Experimental setup - top view. Figure 29. Experimental setup - side view. Figure 30. Experimental setup - first person. Figure 31. Test subject participating. Figure 32. Experimental demographics. Figure 33. Experimental overall performance.
Figure 34. Experimental performance based on independent variables. Figure 35. Visual overview of the experiment.
Figure 36. Sound analysis.
Table 1. ProTac III - Technical data specifications. Table 2. ProTac III - Attenuation specifications. Table 3. ProTac III - Attenuation measures.
65 68 72 Appendix A. Informed consent.
Appendix B. Experiment manual. Appendix C. Spectrograms.
Introduction
The human sensory system is a sense-making input system that has been refined through millennia, allowing individuals to orient themselves in their environment by registering, and discriminating amongst, multi-modal information (Møller, 2003). This information can then be assigned meaning which helps guide the individual in his or her objectives. The sense of hearing derives meaning from registered pressure changes in the surrounding medium and unlike the sense of sight, which can be turned off to unwanted stimuli – closing your eyes to too intense light – the sense of hearing never rests or can manually be turned off or lessened. This never-resting evolutionary trait makes human beings vulnerable to their auditory environment, especially considering the large numbers of noise polluted domains, where people are confined to an unhealthy auditory environment through their employment. This increases the risk of stress-related diseases, fatigue and hearing loss (AFS 2005:16). One protective measure against such ailments is the use of hearing protection devices (HPDs), which attenuates ambient noise to healthier levels. However, besides relieving the hearing organs from undue stress, HPDs may also distort the acoustic information reaching the hearing organs (Argo, Beener, Brown, Meegan & Tollin, 2015), see Figure 1, resulting in decreased situational awareness (SA) for the user. SA refers to a person’s ability to understand what is going on around her (Endsley, 1988). In attempting to resolve this compromise – between the balance of attenuating noise pollution to healthier levels and allowing an accurate representation of the auditory environment to reach the hearing organs – reliable methods of measuring altered levels of SA needs to be established.
1. Introduction
The majority of previous research and existing methods have looked at SA in its multi-modal complexity – with the user having access to multiple types of sensory information. Auditory Situational Awareness (ASA) refers to a person’s ability to make sense of their situation relying only on sensory information received through the sense of hearing – through detecting, identifying and localizing present sounds (Casali, 2017).
This project focused on designing a method for measuring a user’s ability to identify sounds
1.2 objectives and aims
The objective of the project was to design a method for measuring sound identification performance afforded by the use of HPDs when exposed to noise similar to that
which is common in the process industry; a method taking 3MTM PeltorTM’s conditions
for implementability into account. The project should run through the design and implementation of the method, as well as the analysis of its result and add to 3MTM
PeltorTM’s ongoing efforts concerning sound identification.
The aim of the project was to benefit the numerous people exposed to noise pollution through their employment by contributing to the tools available for developers of products that battle these hazards. More specifically, to contribute to 3MTM PeltorTM’s range of
evaluative tools used when designing HPDs, to benefit their systematic efforts of ensuring high user experience – which results in reduced risk and increased social inclusion – and improve their market competitiveness.
The following research questions were formulated to guide the project:
1. What intrinsic properties of sound influence the human ability to identify sound?
2. What measurement data is useful to collect to aid in informing product development aimed at affording reliable sound identification?
1.1 stakeholders
Well established methods for measuring a HPD ability to attenuate sounds exists and it is an important factor in ensuring healthier auditory environments for the user. It is, however, only one aspect of the effects of wearing HPDs, and needs to be supplemented by additional metrics to ensure evaluative success. Major stakeholders is for this reason people employed in the development of HPDs; if they are given additional methods for measuring HPDs’ performance it can guide their development efforts – since, after all, it is difficult to improve something which you can’t measure. 3MTM PeltorTM, in the role of project initiator, is the
pri-mary stakeholder with a potential of seeing these benefits. They may also gain a competitive element and metrics for marketing purposes.
Other stakeholders by extension are the end users, employers in noise polluted domains and ultimately society. All stand to benefit from reduced risk and increased satisfaction following increased levels of SA. The end user might also enjoy increased levels of social inclusion, employers can stand to gain a more attractive workplace – with fewer incidents or stress-re-lated illnesses – ultimately contributing to a healthier, happier and more productive society. when using a HPD in a noisy environment. It was conducted as a master thesis project in industrial design engineering at Luleå university of technology during the spring semester of 2020, in collaboration with the faculty of engineering acoustics and 3MTM PeltorTM, in
1.4 thesis outline
This thesis is organized into eight chapter, where this introductory chapter has presented the background, important stakeholders along with the objectives and aims of the thesis.
The second chapter provides contextual immersion which has been relevant for the thesis, such as problem analysis, benchmarking, the process industry, ProTac III and client information.
The third chapter is the theoretical framework, which lists theoretical concepts that have been important in the realization of the thesis.
The fourth chapter provides a description of the process that has been used to organize the various methods that have enabled the project’s outcome.
The fifth chapter presents the results from the process, included with the final method design and an analysis of the empirical data gathered by implementing the method design.
The sixth chapter discusses the results and the project outcome.
The seventh chapter provides recommendations and considerations for future work on the research subject.
The eight chapter lists the references that has been used the project. The ninth chapter contains appendices referenced throughout the thesis.
1.3 project scope
This work, carried out at Luleå University of Technology in the spring of 2020, was the master thesis for the field of Industrial design engineering. It comprised 20 weeks of development work, undertaken in collaboration with the Engineering Acoustics division at the university and 3MTM PeltorTM in Värnamo.
The project entailed a complete iteration of literature review, method design, experimental setup and implementation, including a pilot study, as well as an analysis of the empirical data gathered by the method implementation, finally concluding with recommendations for future work.
The project has explored various conditions for the ability to identify sounds, such as
industry on-site conditions, but has ultimately been guided by the client’s – 3MTM PeltorTM’s
– conditions for future in-lab implementation of the method design.
With noise pollution being a veritable problem for multiple domains, this project has focused solely on examining a noise environment comparable to noise present in the process industry.
Context
2. Context
This chapter contains a problem analysis with its point of departure originating from the project brief that initiated the project, it explores the soundscape of the process industry and a benchmark of common hearing protection devices. The chapter also includes a closer look at the hearing protection device model that has been used in the project and gives a company presentation.
2.1 problem analysis
2.2 the process industry
A preliminary problem analysis on the above listed project brief, received from the client, was conducted to assess the problem and attempt to direct the efforts accordingly. It wouldn’t be controversial to argue that the ill effects of noise pollution are backed by scientific consensus, and AFS 2005:16 outlines regulations to combat both noise resulting in annoyance as well as hearing loss. When choosing the strategy of noise control, Andersson (1998), argues for preventive measures being employed as close to the source of the noise possible for the greatest effect, and arguably common practice is to minimize noise as much as possible. Yet, complete elimination of noise is not always possible which makes hearing protection devices a valuable and necessary compromise - attenuating the noise. The use of hearing protection devices contributes to the prevention of noise-induced hearing loss (Mahdavi, Meshkani, Monazzam, & Zakerian, 2019), but as Argo et al. (2015) notes, it may be at the expense of the users situational awareness due to distortions of the acoustic information reaching the user. As such, the potentially contradictory relationship between noise attenuation and situational awareness needs to be bridged by establishing reliable methods for measuring the elements of situational awareness – sound identification in particular being the focus for this thesis.
Auditory situational awareness helps us to be aware of our surrounding by
listening. An ambient sound is detected, identified and localized by our hearing. In noisy environments the use of hearing protector devices, e.g. earmuffs or earplugs, is required since there is a risk for hearing impairment. To improve situational awareness a level dependent function is introduced by using ambient microphones together with a signal processing unit and internal loudspeakers. The objective of the thesis is to evaluate the human ability to identify sounds and suggest a subjective measurement method to analyze the effect of earmuffs with level dependent
function.
3MTM PeltorTM Project brief
Being able to correctly identify sounds in a noisy environment is going to be dependent on two factors (not accounting for personal prerequisites) – the sound that is being identified (the signal) and the sound that is interfering with this ability (the noise). This interaction will determine the success of identification and infinite combinations can be imagined. Some domains are more commonly struck by noise pollution than others though, and this thesis has focused on the process industry.
– rotors, gears and fans, which propagates sound waves that diffracts, reflects and are being absorbed by the industrial interior (Gerges, Parthey, & Sehrndt, 2001). The logical consequence of this is the impossibility of establishing a universally representative
soundscape to mirror the process industry. This insight shines light on the unique conditions, and demands, that is present in each domain where a HPD is being used, and as such, this thesis has employed a simplified representation of such a soundscape.
2.3 benchmarking
Multiple domains stand to benefit from noise attenuating products, these include industries, the military, hunting and recreational shooting as well as the construction sector. One division amongst existing HPDs is how they are worn by the user – if it is in-ear, as with an earplug, or if it is on-ear, as with an earmuff, see Figure 2 for illustration. Both come with a unique set of advantages and disadvantages. Studies have shown that on-ear HPDs distort auditory information received by the pinna – the outer ear – leading to reduced capacity in sound localization in particular (Argo et al., 2015), but earmuffs afford advantages such as an easier mounting and generally a more universal fitting. Earplugs require proper mounting to ensure optimum protection and cannot be worn if the user has an ear condition, but they are less bulky and therefore compatible with most safety gears and tight working spaces (Letowski, McBride, & Mermagen, 2008).
Another distinction between existing HPDs is whether they are passive (linear) or level-dependent. A passive HPD simply means that noise attenuation is achieved by physically blocking the sound waves from reaching the ear canal (Hamilton, Rubas, Tufts, & Ucci, 2011). This can present challenges, especially in environments where noise pollution is fluctuating or when the user suffers from hearing loss, since, while high-intensity sounds may be attenuated to safer levels, the linear attenuation of a passive HPD may attenuate low-intensity sounds to inaudible levels (Argo et al., 2015). A level-dependent HPD uses the same
Figure 3. Illustration of level-dependent function.
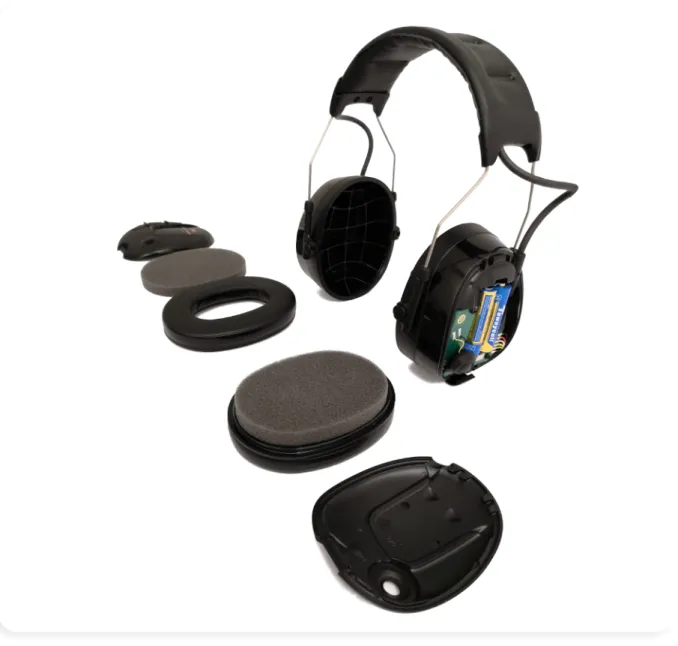
2.4 ProTac III
The product that has been used in this project is 3MTM PeltorTM’s ProTac III model, which is
an earmuff with level-dependent function, seen in Figure 4.
The model is produced in two variations, as seen above – with a headband – or equipped with helmet attachment. Both are available in a regular sizing or as a slim model. This thesis has only included the regular sized headband model (MT13H221A). Technical specifications for the model, retrieved from 3MTM PeltorTM can be seen in Table 1, along with a partially
dismantled model in Figure 5.
Figure 4. ProTac III.
Figure 5. ProTac III - dismantled.
Technical data specifications
Materials
Headband (stainless steel, PVC, PA) Headband wire (stainless steel) Cushion liner (PVC foil & PUR foam) Foam liner (PUR foam)
CUP (ABS)
Battery 2xAA
Operating time 100 hours
Attenuation data for the model follows the European standard EN 352-1:2002 / EN352-4:2001 and is listed in Table 2. The table shows the mean attenuation for different frequency levels with corresponding standard deviations. An overall attenuation average for the product is noted to be SNR=32 dB, which means Single Number Rating, and is not to be confused with Signal-to-Noise Ratio.
A calibration of the individual product used in the project was also conducted during a company visit to establish that there were no deviations from the above specified data. This was accomplished by the same principles as the REAT (Real-Ear Attenuation at Threshold) – which is a hearing test where the subject is seated in an anechoic chamber and records his or her detection threshold for sounds at different frequencies, once with an open ear and once using the HPD being tested. The difference between the two measures is then considered to be the protection provided by the evaluated HPD. The results from this calibration is shown in Table 3, with results within the stated standard deviations. Both data are graphed in Figure 6.
3M
TMPeltor
TMProTac III - Product specification
Frequency [Hz] 125 250 500 1000 2000 4000 8000
Mean attenuation [dB] 17 24 29,5 36,9 37,3 39,3 35,4
Standard deviation [dB] 3,2 2 2,6 3,2 4,9 3,2 3,9
Table 2. ProTac III - Attenuation specifications.
3M
TMPeltor
TMProTac III - Unit measure
Frequency [Hz] 125 250 500 1000 2000 4000 8000
Measured attenuation [dB] 15,5 25,3 30,8 36,8 33,6 41,3 36,8
Table 3. ProTac III - Attenuation measures.
Figure 6. ProTac III - graph of specifications and measures.
Measure Specification
Frequency [Hz]
Att
2.5 3m
tm
peltor
tm
3MTM PeltorTM is a globally active developer and manufacturer of hearing protection
devices and communication solutions. The company was started in the 1950’s in response to challenges in communication experienced by pilots in the Swedish Air Force, an environment with high levels of ambient noise and high demands of effective auditory communication. Peltor was later taken over by 3M and is since 2008 part of the 3M concern with global responsibility for ear muffs. The company’s development department in Värnamo houses roughly 50 employees and the facility is equipped with various sound labs, including an anechoic chamber with a multiple-channel sound system.
The company has a recurring test group of approximately 30 people enlisted for evaluative measurements in their product development. The requirements to be fulfilled by the test group are regulated by ISO 4869:1/2/3, where the test subject cannot have hearing losses exceeding 15 dB for frequencies up to 2000 Hz, and no more than 25 dB for frequencies above 2000 Hz. The ISO also requires a demonstrated consistency in three consecutive audiograms, with differences not exceeding 6 dB between tests.
Theory
3. Theoretical framework
This chapter outlines theories that’s been necessary to complete this thesis. Industrial design engineering forms the underpinning theoretical understanding, and methodology, for deconstructing problems and working towards a solution. This framework for deconstructing problems relies on an explored understanding of the subject matter for every new design challenge, which is what follows next in the chapter by presenting acoustic phenomena and nomenclature that’s been essential for the project result. Finally, it concludes with theory on the cognitive process of forming situational awareness and existing methods for measuring situational awareness. Being able to identify sounds correctly contributes to situational awareness, making this last theoretical section essential for the project. Analyzing existing methods for measuring situational awareness helps understand what methods gives the most valid and informative data.
3.1 industrial design engineering
Simon (1982) writes that “To design, is to devise courses of actions aimed at changing existing
situations into preferred ones” (p. 129) – a deliberate, and structured, attempt to improve a
situation guided by certain criteria. Industrial design refers to mass produced quantities of designed products and differs from craft-based design in that the design of the product, the creative and defining process, precedes the actual manufacturing of the product – as opposed to craft-based design, where exploring and defining proceeds simultaneous to manufacturing (Noblet, 1993).
Kapoor, Melles and Vere (2010) argues that Industrial design engineering is the
combination of industrial design and design engineering, which has resulted from the need of greater synergies between the two fields, which historically have been treated separately. Arguably, the industrial design engineer is attempting to see and meet the needs of the user who is intended to use the product and that of the industry intended to manufacture it. Törlind and Wikberg Nilsson (2019) articulates the interdisciplinary nature of this field and how it is distinct from other fields of engineering in that:
Increasing number of domains are getting attracted to the benefits of the IDE process – design thinking – and one of its greatest strengths lies in its versatility, where the outcome is not only limited to the manufacturing of physical products. This project deals with the interaction of user and technology, measurements and evaluation of a products capacity to afford users a sense of control and awareness, making the interdisciplinary and human-centered principles of IDE highly relevant for its success.
… it combines both artistic and scientific approaches and practices, it combines technical rationality and reflective practice. Typical design projects address the social, economical, cultural, material and technical dimensions of a situation in iterative design thinking cycles of gaining empathy for user needs, visualizing and materializing ideas and concepts and testing with users to inform the process. (p. 1)
3.2.1 Sound pressure & frequency
The disturbances in the atmosphere, the sound waves, are measured in Pascal, but since the range of the human capacity to register sounds is so extensive, a logarithmic scale expressed in decibel (dB) is used in its place – the sound pressure level (SPL) (Arlinger, Hagerman, & Ytterlind, 2001). Some examples of common sound pressure levels can be of interest to provide references for the reader: according to Arlinger et al (2001) the normal sound pressure level for conversation, on a one meter distance, is approximately 60 dB, heavy traffic exceeds this, measuring an average of 80 dB and normal ambient noise in a residence measures averagely 35 dB.
The sound wave’s amplitude being what’s measured by the sound pressure level, the other physical characteristic which can be of interest to be familiarized with is frequency. Frequency refers to the number of periods per second that the wave produces and
perceptually gives various sound their character – with low, medium or high pitched sounds as common descriptions.
This becomes relevant for the project since the perceived sound pressure (loudness) for humans is relative to the frequency of the given sound. To adjust for the fact that there is not a linear relationship between sound pressure and perceived sound pressure, different filters have been developed for use in sound pressure level measurements. According to Andersson (1998) the use of the three standard filters, A, B, and C, gives a subjective value of the level of annoyance caused by noise pollution, a value that is adjusted to correlate to the human hearing characteristics. Arlinger et al (2001) argues for the range of frequencies of sounds that the human ear is most sensitive to be between 1 and 4 kHz, making the A-weighted filter a suitable measure resembling the human perception of sound.
Identifying a familiar voice, for example, involves complex vibrations of the sound source, compression and rarefaction of a medium; reflecting and filtering of the signal by objects in the environment, the head, torso, and pinnae; transduction of the mechanical energy into an electrochemical signal in the nervous system; and the activation of an entire network of correlated physiological mechanisms from cochlea to cortex. This entire process finally results in some conscious recognition and identification of the familiar speaker. (p. 1)
With acoustics not in the standard product design curriculum, the development of a sufficient acquaintance with the field was imperative for the project.
3.2 acoustics
Acoustics is a branch of physics concerned with the generation and space-time evolution of mechanical waves – small disturbances in fluids or in solids, the former producing sound waves and the latter elastic waves (Bergassoli, Filippi, Habault, & Lefebvre, 1999). The study has useful applications in multiple fields, including engineering, earth sciences, life sciences as well as the arts.
This project is especially situated within a subdivision of acoustics known as
psychoacoustics. Psychoacoustics studies the complex interaction between the physical sound waves and how such waves are perceived and interpreted by a receiving living organism with functioning organs of hearing (Neuhoff, 2004). In the same literature, Neuhoff gives an illustrative example of how the chain of such an interaction may proceed:
3.2.2 The hearing system - anatomy & physiology
Since the perception of hearing is such an intricate phenomena, consisting of both the physical side as well as the perceptual and information processing side, a condensed understanding of the human hearing system have been informative for the project, a simplified understanding of it’s anatomy and physiology. Schematically, the hearing system can be broken into the outer ear, the middle ear and the inner ear, see Figure 7. The outer ear consists of the pinna, which is the meaty part on the outside of the head which is commonly used synonymously with ear, as well as the ear canal. Andersson et al (2007) describes the role of the pinna in collecting and amplifying sound waves, interpreting differences in intensity and time between sounds hitting the one ear and the other, contributing to the ability to locate the origin of the sound. Deforming the pinna, by wearing a HPD, can therefore be expected to affect this ability – according to Argo et al (2015), the significant compromise of perceptual ability is due to this distortion of spectral cues.
Maguire & St. Pierre (2004), however, argues for the use of precautions when deciding on what filter to use for measurements, stating that even though A-weighted filters have become the standard in the past decades, since it emphasizes the hearing loss-prone frequencies between 1-4 kHz, there is a risk of this filter underestimating the role of low frequency sounds on loudness, annoyance and speech intelligibility.
Nevertheless, the A-weighted filter is perhaps the most commonly used and the Swedish Standards Institute provide instructions for conducting A-weighted measurements in SS-EN ISO 9612:2009.
which is the spiral-shaped cavity involved in much of our perceptual processing of the sound waves (Arlinger et al. 1985). According to Casali & Robinson (2002) the cochlea becomes overloaded at higher noise levels which affects the cochlea’s ability to process the acoustic information, resulting in distortions. This can explain why speech intelligibility in noise polluted environments, such as the process industry, don’t necessarily suffer from wearing a HPD and can actually improve, since, according to Andersson et al. (2007), speech intelligibility is dependent on the ratio of speech to noise sound pressure levels and the HPD attenuates both, resulting in a relieved tension on the cochlea.
This schematic understanding of the anatomy of the human hearing system and its physiology has provided an understanding for some of the phenomena of psychoacoustics and has been necessary to fully understand and appreciate the literature of the discipline.
3.2.3 Noise & AFS 2005:16
The definition of noise as undesired sound makes it a relative term, and what may cause discomfort for one person might not for someone else (Andersson, 1998). The physical effects on a person’s hearing organs caused by the sound waves are less relative however, and the Swedish Work Environment Authority dictates regulations (AFS 2005:16) for the maximum allowed levels of noise exposure during an employees workday (8 h). The regulations states that:
• at the daily noise exposure level Leq=80 dB, a HPD should be provided to the employee • at the daily noise exposure level Leq=85 dB, a HPD must be used by the employee
• the maximum A-weighted sound pressure level LpAFmax=115 dB, this limit should never be exceeded (measured at ear)
• the C-weighted Impulse LpCpeak=135 dB, this limit should never be exceeded
The Swedish Work Environment Authority (TSWEA) echoes Andersson’s words – that noise may range from disturbing sounds to sounds that damage your hearing (AFS 2005:16) – and stresses the importance of choosing the appropriate hearing protection based on comfort and attenuation. According to TSWEA (AFS 2005:16), removing the hearing protection for as little as 10 % of the workday duration reduces the protective effect of a HPD with an attenuation of 30 dB down to 10 dB. Appropriate attenuation depend on noise content and attenuation properties of the HPD and TSWEA recommends choosing a HPD that attenuates the noise to 70-80 dB(A), which can reduce discomfort for excessive pressure and facilitate communication. Other characteristics that affect the level of annoyance caused by the noise is it’s duration, it’s variability and its frequency composition (Anderson, et al., 2007).
3.2.4 Pink noise
Using the definition of undesired sound to describe noise makes for limited classification usefulness. Other methods of classification does exist however, one being the power spectrum of particular noises, which refers to how the power is distributed over the band frequencies of the noise. In pink noise, proportionally wide frequency bands yields equal powers, whilst white noise possess equal power when comparing the equal bandwidth anywhere over the range of frequencies. Figure 8 plots a power spectrum comparison between pink and white noise.
Persson Waye & Kalafata (2017) argues that the masking effect of the lower frequency noises are particularly unfavorable for speech intelligibility, where vowels have their main energy in the low and mid frequency range and consonants have their energy in the mid and high
Figure 9. Upward masking. A: Locomotive 90 dB. B: 1000 Hz sinus tone, 60 dB. C: 1000 Hz sinus tone, 40 dB.
3.2.5 Masking
Andersson et al. (2007) describes the phenomena of masking as referring to how the audibility of one sound is affected by another sound, with sounds of similar frequency content inflicting the greatest decrease in audibility. But it is not limited to same frequency solely, and a sound tend to mask asymmetrically upwards in frequency, meaning that lower frequency sounds tend to mask more effectively than higher frequency sounds (see Figure 9) and one practical implication of this would be to focus on amplifying the higher frequencies of speech first, if trying to improve speech intelligibility (Andersson et al. 2007). Arlinger et al. (1985) provides a qualitative as well as a quantitative description of the term, with the qualitative definition referring to the decrease in the hearing impression of a sound in the presence of another sound, and the quantitative definition referring to the offset of the detection threshold (the lowest level of hearing) inflicted by the masking sound.
SPL [dB]
Frequency [Hz]
3.3 situational awareness (SA)
According to Adam (1993), situational awareness (SA) is “knowing what is going on, so you can
figure out what to do” (p. 319). This would imply a process of aiding decision making from
perceptual clues in your direct and dynamic environment. Jeannot, Kelly and Thompson (2003) provides a description with similar implications, stating that SA is “What you need
to know not to be surprised” (p. 22) – some process of preparing for the future through
comprehension of the present situation. These authors are not alone in their attempts to define this complex, multi faceted, concept. One widely recognized and accepted definition is Endsley’s (1995a): “SA is the perception of the elements in the environment within a volume of time
and space, the comprehension of their meaning and the projection of their status in the near future”
(p. 36). Figure 10 shows an illustration inspired by Endley’s definition.
Figure 10. Situational Awareness (SA).
3.2.6 Signal-to-noise ratio (SNR)
According to Butler, Holden, & Lidwell (2010), Signal-to-Noise Ratio refers to the ratio of relevant to irrelevant information. This is a common metric within the acoustic discipline used to reference the power ratio of the desired signal, the sound to be identified in this context, to the background noise. As mentioned above, interaction between the relative powers of signal and noise play a considerable role in signal detectability and this metric is an important and recurring component within the literature.
detectability challenging for predictive application. A more thorough understanding of this complex interaction is outside the scope of this thesis, but a baseline grasp of the masking phenomena has been crucial for the project and in the pursuit of HPDs’ affording adequate sound identification performance it will be inevitable.
Endsley & Jones (2004) makes the analogy that if level 1 SA corresponds to reading individual words, level 2 SA is analogous reading entire sentences. What is being perceived and eventually comprehended in any given situation will be determined by multiple factors such as expectations, procedural goals, attention and previous experience. Endsley provides a
The need to understand and measure SA becomes apparent when one considers statistics from aviation mishaps. In one study, Endsley (1995b) found 88% of failures attributed to human error to be the result of insufficient understanding of the situation (low SA), not bad decision making in a situation with high levels of SA. Therefore it follows that designing with the intent of providing the user with a high level of SA aids user performance and is crucial to user centered design. Furthermore, if systematic improvements are to be attained, reliable methods of successfully measuring SA must be conceived.
comprehensive model for the multi-dimensional concept of SA, Figure 11 shows an adapted illustration of the Endsley 1995 model, depicting the influencing factors.
Figure 11. Factors influencing situational awareness.
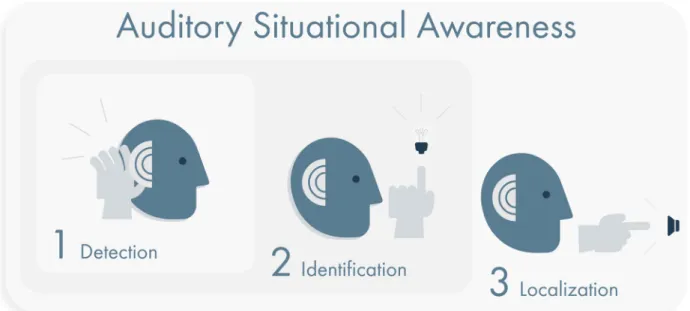
The cognitive processes actively working to maintain a person’s SA will make use of any and all sensory data received – visual, auditory, tactile, olfactory or gustatory – however, this project is only concerned with SA cues implied from auditory information. According to Casali and Lee (2017) the different constituent that are important to maintaining high levels of auditory situational awareness (ASA) – that is to say, only information gained through the sense of hearing – is the ability to Detect, correctly Identify and Localize a sound. This is illustrated in Figure 12. Whereas figure 10 illustrated the formation of SA with full access to all sensory input, Figure 12 illustrates the equivalent when sensory input is limited to that registered by the hearing system. Here, level 1 would equate to detecting the sound, level 2 to identifying the sound, and level 3 to localizing the source of the sound (level 2 and 3 need not occur in that order.
Figure 12. Auditory situational awareness (ASA).
3.4 measuring SA
Existing methods for measuring SA tend to be derived from the domain of aviation and attempts to measure overall SA in a situation where the user has access to all sensory input available, instead of looking at one type of sensory input in particular – such as the sense of hearing. Endsley and Jones (2004) talk about the difficulty in accurately measuring a mental construct such as SA and how existing methods try to accomplish this by either inferring SA from processes, behaviors or performances or by trying to obtain direct assessments of a user’s SA – subjectively or objectively. Endsley and Jones (2004) argue for the use of direct measurements of SA, since the methods of inferring SA may give an incomplete picture of SA, as other factors than SA can affect behavior, performance or outcome. The more common methods for measuring SA discussed by Endsley and Jones (2004) are listed in Table 4.
Measuring Situational Awareness
Indirectly Directly
Process Behavior/Performance Objective Subjective
Verbal protocol Observation Post-test questionnaire Self-rating Communication analysis Scenario manipulation Real-time probes Observer rating
Psychophysiological
metrics Outcome measures SAGAT SART
Table 4. Method for measuring situational awareness.
Another reason Endsley and Jones (2004) argue for the use of direct and objective measures for assessing SA is the assumption that how aware a user deems him or herself to be, a user’s perceived situational awareness (PSA) might differ from reality – from what objectively collected data is showing. This would result in inaccurate assessments of a user’s SA. From a product design perspective however, PSA is perhaps arguably as important as
actual SA. It can be imagined that risks are linked to a situation where a product provides a high level of PSA, only to be false. Or the inverse, where a user is able to correctly make identifications but at a low level of certainty, which would indicate a poor user experience. Besides close ties to the aviation industry, another recurring feature of existing methods for measuring situational awareness is a probe-based structure – where the user is presented with some stimuli or scenario of which their assessment is based. One method which has been a source of inspiration in this project is QUASA – QUantitative Analysis of Situational Awareness. Which is a method attempting to address both SA and PSA using True/False probes and self-ratings as evaluative data (McGuinness, 2004). This assessments have been used in a warfighter-relevant context and the supplementation of the objective data (true or false), with the user’s self-rated level of certainty in the given answer provides data that can give an indication of a user’s PSA. Figure 13 shows an illustration of the QUASA method.
Another existing method of measuring SA that is of interest is found in the test battery DRILCOM, which was developed to objectively evaluate ASA afforded by various HPDs used by the US military (Casali & Lee, 2015). It is an acronym for Detection, Recognition/ Identification, Localization and Communication, which the developers of the test argues to be the important elements that make up ASA. Recognition/Identification (R/I) uses forced-choice responses supplemented with response time as metrics for assessing the identification element of ASA. Figure 14 show on illustration of the R/I test of the DRILCOM battery.
Figure 13. QUASA - Quantitative analysis of situational awareness.
Method
4. Method
This chapter outlines the process of the thesis, methods that has been relevant for its fruition and the general workflow they’ve followed.
The project workflow was based on the Double Diamond Process, originally developed by the British Design Council in order to assist designers and non-designers to handle complex social, economic and environmental challenges (Design Council, 2020). According to (Zhang, Zhang, Zhang, Zhu, & Hu, 2019), it helps to clarify the design thinking process visually in a clear and comprehensive way. A visualization of the varying divergent and convergent focus during the double diamond process is seen in Figure 15.
In accordance with the process the project was divided into four stages; Discover, Define,
Develop and Deliver. The discovery phase involved problem immersion; gaining an
understanding for the field within which the project is set, examining previous research and existing methods as well as mapping 3MTM PeltorTM’s conditions for replicating the resulting
method.
The definition phase was about exploration and synthesis; about making sense of the generated data and establishing what information the method should produce and why. It was also about establishing what product to use for the evaluation and implementation of the method.
The development phase was about producing the soft- and hardware needed for actually implementing the designed method, it was about running a pilot study to adjust details of the experimental setup, actually implementing the method and gather the empirical data. . The delivering phase was about analyzing the results and evaluating the method. It was about extracting insights from the project and delivering this outcome 3MTM PeltorTM.
The project planning was established to provide a structure for the progression of the project, map available resources and align stakeholder expectations.
A Gantt chart outlined the overall phases, displayed important deadlines and deliverables. This provided an overview of the intended workflow which helped keep the project on time. Extra care was taken to keep the documents editable, since the project differed from traditional product design and changes were not unlikely to occur.
Project planning also included management questions of communication structure and budgeting for traveling costs and material purchases. Figure 16 gives an overview of the project plan and important deliverables within the process phases.
4.2 project planning
4.2.1 Project diary
During the thesis, a daily project diary has been kept, with dates, activities, questions that has arisen as well as answers and insights. This has been a useful exercise, giving an overview of the previous tasks as well as the required focus at any given moment in the project. Also, it has been helpful to be able to look back at the project’s outline, when the report has been written subsequently.
Figure 16. Project planning.
Date Activities Questions Answers/Thoughts/Insights
2/2
Start 8.15, reads Communication Acoustics
Reads Effects of Active and Passive Hearing Protection Devices on Sound Source Localization, Speech Recogni-tion, and Tone Detection
Tomorrow: Contact x about the flight for the company visit
1. ITD and IID - might the ear muff constitute a metal bridge of where sound waves can travel and make lo-calization/identification more difficult? 2. How does someone who is unilater-ally deaf localize sounds?
3. Consonants are important for speech intelligibility, how are different languages affected by this? Are some languages more troubled by noise than others?
1. Noble and Russell (1972), refutes the hypothesis after test without metal bridge connecting the cups of the HPD.
4.2.2 The 7P Framework
Even though this project has a single author and person responsible, it has been backed by immense human capital. This resource has been spread over great distances, and not being co-located has increased the need for a good structure of communication, which is why the 7Ps Framework have been utilized whenever possible. Quoting Eisenhower – In preparing for battle I have always found that plans are useless, but planning is indispensable – Brown, Gray & Macanufo (2010) argues that, even though it can’t guarantee a great outcome, every meeting deserves a plan, and having established this intent then makes you more flexible in the execution. Investing a few minutes prior to any meeting regarding the desired 7Ps – Purpose, Product, People, Process, Pitfalls, Prep and Practical concerns – has contributed to making the meetings more efficient and effective, as well as generating written documentation of the projects progress and insights.
4.3 discover
The discovery phase focused on problem immersion and the understanding of the subject matter. It included iterations of literature review, mapping the company’s conditions and benchmarking the product that was used for evaluation in the project. Much of the work done in this phase resulted in the contextual understanding in chapter 2. Context.
According to Rowley and Slack (2004) all research needs to be informed by existing
knowledge in the relevant field; which is the purpose of a literature review – to distinguish between sources and organize relevant research already conducted on the topic a project is embarking to explore. Reviewing published information on the subject played a central role in the project; with printed books on acoustics, psychoacoustics, engineering acoustics, communication acoustics and audiology providing the fundamental understanding for the field. This was supplemented with peer-reviewed publications on existing research on the project’s subject and served as the fundamental understanding of the field as well assisted in guiding the focus for the ensuing research.
The main database utilized for the literature review was the university’s, which includes an extensive collection of individual databases, but additional databases were used when certain sources were hard to locate or for certain purposes – such as evaluating a publication’s number of citations, to gauge relevance. Besides numbers of citations, contemporaneity – how recent a study was – and whether certain keywords were included in the abstract, introduction, discussion or conclusion were selection criterion.
Relevant keywords for the review were truncated alterations and combinations of situational
awareness, auditory, sound, identification, recognition, detection, localization, hearing, protection, devices, active, passive, localization, detection, binaural, synthesis, measure.
After the initial literature review, it was of interest to coordinate the expectations of stakeholders and the coming focus of the rather open-ended project. This was achieved by conducting a digital workshop. According to Ericson, Törlind & Wikberg-Nilsson a workshop is a creative meeting where various people meet to explore original solutions to a certain topic. Törlind (2015) argues that since geographically distributed teams are a reality for engineering design teams today, it is important to strive towards synchronous communication in creating a shared understanding.
The digital workshop used video conferencing software and involved two field experts from 3MTM PeltorTMs development department, two professors in engineering acoustics at
the university, as well as a second master degree student in industrial design engineering, writing a master thesis in collaboration with 3MTM PeltorTM on the topic of sound
identification. The topic of the workshop was to assess insights from the literature review on psychoacoustics – in relation to sound identification and HPD’s – as well as getting a presentation of 3MTM PeltorTM as a company and their products, ultimately reaching a
consensus of expectations for the project and the focus for the coming efforts.
4.3.2 Digital workshop
A visit to 3MTM PeltorTM’s development department in Värnamo provided a great
opportunity to get familiarized with their conditions for conducting a sound identification test as well as a proper introduction, both to the company and their products, but also to the people involved in the project. Besides a deeper insight to the context, the visit also provided an opportunity for informal exchange of ideas, often cited as paramount for innovation. Being efficient and effective are desirable qualities of business meetings, however, it may not necessarily to sufficient. Which is why Osborn (1953), argued for some ground rules that would give people freedom of mind and a sense of security to express any, and all, ideas surrounding a topic, on the logic of quantity producing quality. Brainstorming, the method discussed, has since become used synonymously with ideation, which is an exchange of ideas taking place under an encouraging atmosphere, where mutual inspiration and building of each others ideas is meant to result in an outcome which is greater than its constituent parts. The company visit included a product demonstration which encompassed hearing tests, both in the open-ear condition and under the use of a HPD – with and without LDF – as well as product performance under different ambient noise circumstances. This was done in their anechoic chamber and/or in an additional sound studio. The visit was also an opportunity to review the second iteration of the literature review – that had focused primarily on SA and methods of measuring SA, which was also the springboard for the informal brainstorming session that concluded the visit. This ideation was important, not just to realign stakeholder expectations, but also to address important questions of the criteria for the empirical data
4.4.1 Company visit & ideation
4.4 define
The chapter on the definition phase includes the company visit and ideation, which was useful to create a consensus on experimental setup and empirical data of interest. The phase then concluded with the convergence into a method design outline in line with those ambitions.
and consequently what methods to be used in the analysis of this data. All important factors to consider in the design of the method. Important outcomes from the ideation was an outline of the intended method of sound identification, a method that would include a probe-based assessment of the listeners ability to identify a sound. Some important questions to be answered were – what sounds (signals) would be of interest for identification? How would
the method deal with learning effects? And What SNR should be used and should it be calibrated individually prior to the test?
Synthesizing the insights from the second literature review with the ideation on-site at the company, as well as their conditions for conducting tests at the location, an outline for the method design was established. The interesting metrics for the test were the ability to accurately identify sounds, an indication of SA, and also the level of certainty in these identifications, indicating PSA. 3MTM PeltorTM has a recurring test group at their disposal,
making a method design relying on fewer participants preferable. This resulted in a within-subject method design, where the participant is asked to make probe-based assessments – identifying one sound amongst a range of three – whilst wearing a HPD. The design would include 3 independent variables with 2 levels each: one for product, where the LDF is either ON or OFF, to be able to evaluate the effects of a HPD with LDF according to the project brief. One for SNR, with two varying levels of SNR, to evaluate product performance under differently unfavorable noise conditions. And lastly one for position, since the first literature review identified performance differences with incoming sounds from the front or the rear under the use of a HPD.
In user research the two common methods of design are either between-subjects or within-subjects. The former refers to the fact that the subject is only exposed to one test condition, and different subjects are used for each test condition. The latter refers to the fact that each subject is exposed to every test condition. Arguably they provide different benefits and drawbacks, with between-subjects design reducing learning effects but increasing the number of participants required. Within-subject design needs to address learning effects but has the benefit of requiring fewer participants and has a higher relative power (ability to detect statistical differences) than between-subject design, since it eliminates individual differences of test subjects involved. As mentioned, using a within-subject design for the method resonates more closely with 3MTM PeltorTM’s conditions – with a recurring test
group at their disposal, but it also increased the feasibility of conducting the actual method during the time restriction of this master thesis.
4.4.2 Method design outline
Arguably some of the most information-packed acoustic information that is exchanged is verbal communication, speech (Tomasello, 2008). For this reason it is of great interest to be able to evaluate a HPD’s ability to afford identification of verbal communication, commonly referred to as speech intelligibility. Therefore a specific audio recording was conducted with the help of a trilingual participant to create a triad of verbal communication, see Figure 17.
4.5.2 Recording communication triads
In the establishing of the selection of sounds used for the method design, it was attempted to include information-carrying sounds that would be relevant to the industrial context primarily, but also other domains where the product is commonly employed. However, it was also deemed reasonable that a wider variety of sounds would be preferable to an overly in-depth focus on sounds present in the industrial environment. This was based on the logic that if the product affords the ability to identify a wide variety of sounds to a satisfactory degree, that would presumably include the ability to identify sounds within the smaller niche of industrial sounds as well. Also, avoiding sounds that require considerable industrial environment experience would also ease the process of gathering test subjects for the actual test.
The selection of sounds was collected in groups of three, which was attempted to be functionally and acoustically close to each other, in order to establish a suitable level of difficulty in the task of identification. Twelve of such triads were initially collected, mainly using an Online database offering free sounds for unlimited use, with a length of 5 seconds being the other criteria, besides functional and acoustic similarity.
4.5.1 Selection of signals
4.5 develop
The chapter on the development phase chronicles the necessary steps for selecting and preparing the signals used in the test, balancing test conditions to handle order effects, setting up software and hardware and running a pilot study to adjust experimental settings prior to the final implementation of the designed method.
The selection of sentences to use for the communication triad was based of the Harvard sentences, which are phonetically balanced sentences provided by the IEEE Subcommittee on Subjective Measurements IEEE Recommended Practices for Speech Quality Measurements.
Harvard sentences & translation
s
English translation Swedish translation Danish translation
Add the sum to the product of these three Lägg summan till produkten av dessa tre Tillføj summen til produktet af disse tre Oak is strong and also gives shade Ek är stark och ger också skugga Eg er stærk og giver også skygge The ripe taste of cheese improves with
age Den mogna smaken av ost förbättras med åldern Den modne smag af ost forbedres med alderen Cats and dogs both hate the other Katter och hundar hatar båda varandra Katte og hunde hader hver den anden
The pipe began to rust while new Röret började rosta medan det var nytt Røret begyndte at ruste, mens det var nyt Open the crate but don’t break the glass Öppna lådan, men ha inte sönder glaset Åbn kassen, men bryt ikke glasset
Act on these orders with great speed Agera på dessa ordrar med stor brådska Handle med disse ordrer med stor hastighed The hog crawled under the high fence Svinet kröp under det höga staketet Svinet krøb under det høje hegn
Move the vat over the hot fire Placera karet över den heta elden Flyt tønde over den varme ild
Table 6. Harvard sentences recorded for the communication triad.
4.5.3 Normalization & Percentile sound level L
10Besides functional and acoustic similarity and length, another criteria in preparing the sound library was to establish normalized sound levels for an impartial comparison. Sounds that aren’t pure tones (sinusoid waves) usually vary in both time and intensity, resulting in the need to equalize the assortment of sounds used in the method. To accomplish this, each sound was equalized using the percentile sound level L10(A), in ArtemiS SUITE. The percentile sound level L10(A) simply translates to the sound level exceeded during 10% of the sound’s duration, Figure 18 illustrates this logic. Using the L10 percentile provided an equal base of comparison between the sounds which were then all normalized to 70 dB(A) using Audacity 2.3.3.
Using the Harvard sentences provided a library of useful sentences used in standardized testing, even though the phonetical balance may not be preserved after translation. Table 6 lists the recorded sentences gathered for the method.
Counterbalancing ensured that the experiment data accounted for order effects such as practice and fatigue from repeated exposure to the sound and it also provided a figure for the number of participants required during the experiment phase. The counterbalanced square should be filled with test subjects for every condition in equal amounts resulting in multiples of 8 as the target number of participants, 16 being the most feasible under the restrictions of time, especially considering the understandable reluctance from people signing up during governmental urging for social distancing.
8x8 Counterbalanced Latin Square
A B H C G D F E B C A D H E G F C D B E A F H G D E C F B G A H E F D G C H B A F G E H D A C B G H F A E B D C H A G B F C E D
Table 7. Counterbalanced Latin square.
Besides conceptually defining the method, the method design proved to consist of many practical concerns at the detailed level of realization. One of the major practical concerns involved questions regarding the procedure of documenting the test subjects’ answers:
should they report their answers vocally? How will that work in the noisy environment? Should they report their answers in written form? What will that result in, in terms of data handling
for analysis? Can the experiment supervisor be present in the room? If not, will it be possible to communicate from the outside of the anechoic chamber?
It was decided to invest the time necessary to code a program running the test automatically, to assure consistency between test subjects and conditions, decrease uncertainty from manual handling of data and increase the overall predictability and repeatability of the test. The programming language employed was C++, using the integrated development environment Microsoft Visual Studio 2019.
Making the decision to automate the method using programming was an initial time investment, given limited prior programming experience, but it did pay of during the
4.5.5 Software & coding
4.5.4 Counterbalanced Latin square
In order to address learning effects which can result from the within-subject design a
counterbalanced Latin square was used. It’s a matrix of the test conditions which is intended to not only ensure that each condition appears the same amount of times, but also to balance the order in which the conditions appear, protecting against order effects (Dean, 2001). Since this method included 3 independent variables with 2 levels respectively this resulted in a counterbalanced Latin square of the dimensions 8x8, see Table 7.
The experimental design has been set up inside an anechoic chamber and has used two sound systems – one in order to control the noise and one system controlling the signals. The position for the test subject has been measured geometrically from the respective sound sources. The sound levels have then been measured and adjusted for the desired SNR, using a Brüel & Kjaer 2238 sound level meter. Schematic illustrations for the setups can be seen in Figure 19 and Figure 20, while Figure 21 shows measures taken for L10 and frequency.
4.5.6 Hardware & setup
Figure 19. Hardware setup - noise system.
implementation of the designed method and the analysis of its data, and it also greatly simplified the adjustment of test conditions between test runs.