VTI notat 8-1998 '
Validation of indirect tensile
test for fatigue testing of
bituminous mixes
Author
Safwat F. Said
Research division Highway Engineering
Project number
60410
Project name
Deterioration of bituminous layer
Sponsor
Swedish National Road
Administration
Distribution
Free
Swedish National Road and
'7i'ansportResearch Institute
Index
Page
Introduction 5
Verification of ITT in respect to other fatigue methods 5
Using ITT in practice 9
Other benefits of ITT 12
Conclusions 13
Acknowledgement 11
References 14
Appendix
VALIDATION OF INDIRECT TENSILE TEST FOR
FATIGUE TESTING OF BITUMINOUS MIXES
Introduction
The Indirect Tensile Test (ITT) was introduced in Sweden more than 10 years ago. A description of the ITT has been presented earlier and its practical advantages and disadvantages have been discussed [1, 2, 3]. The ITT has been adopted by ASTM (ASTM D 4123) and FAS (The Swedish Asphalt Pavement Association) (FAS Method 454) for evaluating the elastic stiffness (resilient modulus) of bituminous materials. In Sweden, thousands of specimens from various types of bituminous mixes have been subjected to fatigue tests and tests to determine elastic stiffness and tensile strength. Nowadays, the reliability of the ITT, including fatigue test, is judged to be fully adequate for routine use by Operating agencies. The VTI's test procedure for determination of fatigue Characteristics of bituminous mixes is presented in the attached Appendix.
Verification of ITT in respect to other fatigue methods
The fatigue life of bituminous mixes determined from laboratory tests depends on the definition of initial strain/stress and the definition of failure. The results can be presented in plots of initial stress vs. number of cycles, but normally they are presented in plots of initial strain vs. number of cycles. All fatigue tests include repetitive deformations, with bothelastic and plastic deformations. In bending or flexural tests, the beam specimen is either loaded for a given time and then forced to its original undeflected position, or it is sinusoidally loaded with reversal stresses. The strain is computed from the total (maximum) deformation during a loading period. In ITT, the cylindrical specimen is also loaded for a given time, but is then left to recover the deformation by itself. The strain can be computed from the total (maximum) deformation or resilient (elastic) deformation (Figure 1). In certain earlier investigations, the strain was computed from the resilient deformation, which is unsuitable for fatigue experiments, particularly in respect to temperature. The temperature susceptibility of the bituminous mix has a noticeable effect on the fatigue life of asphalt concrete. At higher temperatures, asphalt mixes demonstrate higher resistance to fatigue loading.
TD = Total deformation RD = Resilient deformation PD = Plastic deformation RD De fo rm at io n Time
Figure 1 Definition Qfdaformations.
Figure 2 shows the influence of the total strain and the resilient strain on fatigue curves using ITT with respect to temperature [4].
1000 100 Ini tialt ot al st ra in (m ic ro st ra in) 10 1000 10000 100000 1000000 Number of Ioads A1000 .E E 175 E .9 E, .E E 1000: E .9 .E .72 :E "' 10 1000 10000 100000 1000000 Number of Ioads
FigureZ Efect of total and resilient stram on fatigue life prediction with
respect to temperature.
The strain from the ITT must be computed from the total strain in order to be comparable with the fatigue results obtained with the flexural tests, especially in regard to the effect of temperature or stiffness of the mixes. These results are in agreement with the conclusions reported by Ruthand Olson [5] and Kim, Khosla and Kim [6].
An investigation coordinated by Nordic collaboration (NVF) [7] was carried out to find out the correlation between fatigue test methods used in northern countries. A typical asphalt concrete (Ab 16t) from Norway has been tested by four laboratories at ISOC. Specimens were manufactured with the California Kneading Compactor. The resultsare presented in Figure 3. It is concluded that the differences are primarily due to the test procedure, and the fatigue curves obtained with the lTT do not differ from curves obtained with other methods.
Strain, ;.18
.I
_I _/I
/I
u H_ I I' II 1000 "' H II II./I
N \.\l N . § hä. §§\ Il 100 L! 1 I l> 6 103 104 105 10 No. Of load applicationsFigure 3 Fatigue life relationshipsfor various test methods [7].
S(KS); Sweden, constant-stress, ITT, 01/14 sec, D(KS); Denmark, constant-stress, 3-p0int beam, 40 Hz. N(KT); Norway, constant-strain, supported beam, 0 05/0 95 sec, F(KT); Finland constant-strain, supported beam, 0 05/0 95 sec, N(KS); Norway, constant-stress, supported beam, 0 05/0 95 sec, F(KS); Finland, constant-stress, supported beam, 005/095 sec,
An interlaboratory test coordinated by RILEM (TClOl, TC152) was carried out to compare different test procedures and test equipments for the measurement of mechanical Characteristics of bituminous materials [8]. The VTI took part in the interlaboratory test for measuring elastic stiffness and fatigue resistance of asphalt concrete using ITT. The authors concluded that the moduli from ITT and bending were in good agreement at OOC and 20°C. However, the fatigue results obtained With the various methods are presented together in Figure 4. Unfortunately, there are no comments on the individual test method. VTI's results using ITT are redrawn in Figure 4 for the sake of comparison.
Figure 4 Fatigue curves ofa mix at diferent temperatures obtained by different laboratories [8] and the fatigue curve obtained by [TTfor the same
Wllx.
Presenting fatigue results in stress vs. number of load applications, Kennedy [9] has tested the fatigue life results obtained with ITT against fatigue results reported by different investigators using other test methods, see Figure 5. It was found that the results obtained from ITT were compatible if the applied stress was expressed in terms of stress difference to account for the biaXial state of stress,
which exists in the ITT.
Stress Difference N/mu2
10'!
. '? |o3 'o_1 1 1111111' 1 1111111'
5 K'z values are for stress difference m pei
: K'z (for "ren in N/cmz) : (|45'") K'z 107-_ E Momsmolh et al - nz=35l 0 _ 4551:10 5 Rodhby 8. T:$3°F '0 E Sterlmg : :120.87 : K'f3.65l 'O 1 T: 77° '05% 2 q 5 \ g lot: \\ D I c - \ Ls - \ MOnusmum et al _ \ nz : 9 Kå=|.78 x 10'6 IOL T : 40°F : mKennedy et al \ Pc et 0' _ mdureci 'ensaon \\ 02* 3.9 .2
2 oPell etal Kid'o l '0
'0 ____ rovolmg canhlever T = 50° F : Monismilh et ut o 2 0 flexure _. AR a Kennedy et 0! d allhby Slerlmg _ direct Iension "2- 3 88 H \ x; I 03x IO
IO-é |805ed on stress)_/> 7:750';
: Kennedy el ul \ "' t3.88 . * sz4.76 1 :0 1 T: 75°F 0 1 1 I I I I 1 I I I I I I 1 I | I IO !0I 2 to3 Stress Diffemcemsi
Figure 5 Fatigue life relationshipsfor various test methods [9]
A comparison between ITT using Nottingham Asphalt Tester (NAT) and a two-point bending test has been done at the University of Nottingham [16]. The author is concluded that the correlation is good between the tests results in the region of tensile strain which is of interest.
Consequently, the comparisons between test methods indicate an insignificant effect of the test methods on the fatigue results. Alternative explanations for the differences may be different test conditions or the procedure used in analyzing fatigue results.
Using ITT in practice
Case 1 (details published at ISAP 1997, ref. 12)
More than 300 cores with a diameter of 100 mm were drilled from roadbase layers on 15 test sections when new, and used among other tests for fatigue testing in the laboratory. Eleven of these test sections have been under observation for almost 10 years in order to develop a field-based asphalt fatigue criterion. Development of distress in the road sections is followed by FWD measurements for calculating tensile strain at the bottom of roadbase layers, in addition to traffic counts and pavement distress surveys [10, 4].
The field-based criterion is used here to validate the laboratory-based fatigue criterion. The cores from roadbase layers on the eleven test sections were tested at two temperatures and the fatigue relationships are presented in Figure 6.
The statistical analysis for each test section has shown the significant effect of temperature at the 5% level. The variations in the fatigue results were expected due to a high variation within and between the roadbase mixes on the test sections [11,12]. This variation is of the same order as the variation in the fatigue life in the field [4]. The effect of temperature is fairly small (Figure 6). This is probably due to the low binder content in the roadbase mix (42%). The effect of temperature has also been verified by testing laboratory manufactured specimens.
The calculated fatigue relationship at 10°C based on laboratory measurements at 40 and 15°C is compared with the field fatigue relationship representing field conditions at 10°C, which is presented in Figure 7. These relationships are thus developed independently. A shift factor of magnitude 10 is obtained, depending on the level of strain. It is concluded that there is a good agreement between laboratory results using ITT and the field fatigue criterion. The ITT, which is relatively simple and rapid to perform, is also sufficiently accurate for routine use.
1 000 w :L c.
'5
173 E '52 1001E+2 1E+3 1E+4 1E+5 1E+6 1E+7
No. of applications 1 000 W :5. c.
'§
*01 .72i
1001E+2 1E+3 1E+4 1E+5 1E+6 1E+7
No. of applications
Figure 6 Fatigue curves Ofroadbase layer, mix AG25.
Roadbase layer (A625), 10°C In it ia l st ra in , pe
n=2.9 k=1.1E11 k = 14.1 E10 100 9aw
8+
-*37: 7__ - _ _ _ . . . _ _ . _ _ . _ _ _ .6 FTFITIH I Iilllli I lillill iiillln
1E+3 1E+4 1E+5 1E+6 1E+7
Applications to failure
Figure 7 Laboratory andfzeldfatigue criteria of the roadbase layer AG25 at +10°C
Case 2 (details published at 4th Int. RILEM symposium 1997, ref. 14)
In order to study the performance of mixes used in roadbase layers, eight test sections have been built into a newly constructed road. Accelerated pavement testing by a Circular Test Track (Neste - Finland) and experiments in the laboratory are the first part of this work, which is presented here. The bituminous mixes used in two of the Test Track sections were from the same materials as those used in the road sections. The reference mix (AG25/B180) is compared to a modified stone mastic asphalt (SMA25) with highvoid ratio and similar to porous asphalt. It is used as a roadbase layer in this work. Stiffness and fatigue properties of cores drilled from the circular test sections have been determined in the laboratory using Indirect Tensile Test. Both the test track and laboratory tests are carried out at a temperature of 10°C. Fatigue lives of the mixes obtained in the laboratory are compared with the results obtained from the Test Track.
The construction of pavements at the Test Track, installation of load cells and strain gauges and the follow-up of the deterioration of the test pavements have been performed and reported by Neste Oy and VTT (Technical Research Centre of Finland) [13].
A comparison between Test Track and ITT results [14] has been made with respect to initial transversal tensile strains measured by strain gauges at the bottom of roadbase layers ofthe Test Track sections. Fatigue relationships of the roadbase layers obtained by ITT are presented in Figure 8. Fatigue lives of the AG and SMA layers have been obtained from their fatigue relationships at the initial strains measured in the Test Track. The calculated fatigue lives show longer fatigue life for the AG layer than the SMA layer. This is in agreement with the conclusions from accelerated testing at the Test Track. The indirect tensile test has ranked the tested mixes similar to accelerated testing. It has also proved to be a
practical and accurate tool for determination of fatigue resistance of mixes in routine use.
These results will be verified by testing cores obtained from road_ sections in the laboratory and following up the deterioration of the road sections during a five-year period.
1000
:m
l
rum
m SMAZS WAGZSt = %?3.
ä
't as
* ä W
s å ä år; "53 \\ så e l- i. 3%?ä
N
*a* t
,å
se
\ % Q\
\\'\ 100 N-1E+4 1E+5 1E+6
N0. of applications Figure 8 Comparison between roadbase layers.
Other benefits of ITT
Simulation of field
The pavement layers are exposed to different types of stresses and strains during wheel passage. The longitudinal and transversal cracks in the wheel paths are mainly induced by the transversal and longitudinal strains respectively. According to Huhtala et al. [15], the longitudinal strain signal is compression first, then tension, then compression again. After the wheel passage, the strain will be zero (no permanent deformation). However, the transversal strain signal is only tension, which slowly decreases to zero. The transversal strains are usually larger in magnitude and loading time than the longitudinal strains under the same loading conditions. Thus the transversal strains are more destructive than the longitudinal strains and this is probably the reason why the longitudinal cracks are usually observed first on the pavement. surface.
The deformation signal generated by the ITT is comparable to the transversal strain signal form measured during a vehicle passage. Only tension is present and this slowly decreases to zero. Therefore, ITT simulates well the field conditions in respect to fatigue cracking caused by traffic loading [12].
Maximum tensile stress
The bending test introduces tensile stresses on the surface of the test beam. The fatigue life is affected by irregularities on the beam surface. However, the maximum stress in the ITT is at the centre of the specimen, which is relatively uniform.
Precision statements
Precision statements are not arranged. However, for homogeneous specimens it has been shown that 10 specimens or even fewer are sufñcient for determination of a fatigue curve.
Conclusions
The repeated-load indirect tensile test has been increasingly used in the last decade. It has been investigated widely, primarily due to its practical advantages.
The disadvantage of this method is the accuracy of stiffness determination because the stress distribution is only valid under ideal elastic conditions when the behaviour of bituminous mixes is predominantly linear. Furthermore, the Poisson's ratio must be assumed for the determination of strain across a horizontal diameter.
On the other hand, the great advantages of the indirect tensile test are its simplicity, speed and economy. Also, it can be used both by Operating agencies and research institutes. The ITT is suitable for quality control and mix design. Cylindrical specimens are used which are relatively easy to fabricate in the laboratory or to drill from the road layer or a slab. The test has proved sufñciently accurate for routine measurements.
Acknowledgement
This report is a part of the project "Deterioration of bituminous layer". The author is grateful to the Department of Highway Engineering at the Swedish National Road Administration for their ñnancing of this project.
References 10. 11. 12. 13. 14. 15. 16. 14
Göransson N-G och Hultqvist B-Å, Provning av mekaniska egenskaper hos Marshallprovkroppar , VTI meddelande no. 437, Linköping 1987. Said S.F, Tensile and F atigue Properties of Bituminous Mixtures Using Indirect Tensile Method , Ph.D. Dissertation, Dept. of Highway Engineering, Royal Inst. of Technology, Stockholm 1989.
Said S.F, Resilient Modulus by Indirect Tensile Test , Proceedings of the 4th International RILEM Symposium, Budapest, October 1990.
Djärf, L., Said, S.F, Laboratory Fatigue Properties Compared with Field Performance 5th Eurobitume Conference Stockholm June 1993.
Ruth, B.E. and Olson, G.K, Creep Effects on Fatigue Testingof Asphalt Concrete Proceedings of the Association of Asphalt Paving Technologists, Vol. 46, 1977.
Kim, Y.R., Khosla, N.P. and Kim, N, Effect of Temperature and Mixture
Variables on Fatigue Life Predicted by Diametral Fatigue Testing Transportation Research Record No. 1317, 1991.
NVF -Report, Utmattningkriterier for asfaltbelegningar , Utvalg 33 Asfaltbelegningar Rapport no. 7, 1992.
Francken L., Eustacchio E., Isacsson U., and Partl M.N., Recent
Activities of RILEM TC 152-PBM- Performance of Bituminous
Materials , Proceedings of 8th Int. Conf. on Asphalt Pavements, Seattle
August 1997.
Kennedy, T.W., Characterization of Asphalt Pavements Materials Using the Indirect Tensile Test . Proceedings of the Association of Asphalt Paving Technologists, 1977.
Djärf, L, Performance Based Asphalt Strain Criteria 3rd Int. Conf. on Bearing Capacity of Roads and Airfields, Norway 1990.
Said S.F, Fatigue and Stiffness Properties of Roadbase layer Using Indirect Tensile Test , The Euroasphalt & Eurobitume Congress, Strassbourg May 1996.
Said S.F., Variability in Roadbase Layer Properties Conducting Indirect Tensile Test , Proceedings of 8th Int. Conf. on Asphalt Pavements, Seattle August 1997.
Pienimäki M. & Pihlajamäki J., , Fatigue Testing in Neste Circular Test Track Neste Oy Research Report 89/95, Finland 1996.
Said S.F. & Johansson S., Mechanical Properties of Bitumen Roadbase Mixes Proceedings of the 5th Int. RILEM Symposium, MTBM Lyon May
1997.
Huhtala M., Alkio R., Philjamäki J., Pienimäki M. and Halonan P.,
Behav-iour of Bituminous Materials under Moving Wheel loads Journal of the Association of Asphalt Paving Technologists, Vol. 59, 1990 p. 622.
Read J.M., Practical Fatigue Characterisation of Bituminous Paving Mixtures The Asphalt Yearbook 1997, The Institute ofAsphalt Technology, UK.
Appendix :Page'1(8)
BITUMINOUS MATERIALS
Determination of fatigue of bituminous
mixtures
VTI method
1 Scope and field of application
This method is aimed at characterising the behaviour of bituminous mixtures under repeated load fatigue testing with a constant load mode using Indirect Tensile Test
(ITT). A cylindrical specimen manufactured in a
laboratory or cored frcm151 road layer can kxa used in this test.
2 Principle
A cylinder-Shaped test specimen is exposed to repeated compressive loads with a haversine load signal through the vertical diametral plane. This loading develops a relatively uniform tensile stress perpendicular to the direction (ME the applied load.enui along tima'vertical diametral plane, which causes the specimen to fail by
splitting along the central part of the vertical
diameter. The resulting horizontal deformatbmn of the specimen is measured and an assumed Poisson's ratio is used to calculate the tensile strain at the centre of
the specimen. Fracture life is defined as the total
number" of load. applications before fracture of the
specimen occurs.
3 Apparatus and accessories
The testing machine shall be capable of applying
repeated haversine load pulses with rest periods at a
range of load levels.
The VTI's Material Testing System (VMS) is a
servo-hydraulic testing' machine with a loading
capacity of-*up to 25 kN. It can be controlled
either through force, deformation or strain. A PC'
with ATS software is used for system control and
data acquisition.
Appendix Page 2 (8)
Loading: The system shall be capable of applying a
load ranging from 0.5 to 10 kN with an accuracy of
O.25%.
The maximum load capacity required depends on the
size of the specimen, the testing temperature and
character' of' the .material. For example, up to
20000.N has been used for specimens of basecourse
mixture with a diameter ofSZlSO mm at _4OC.
Deformation: The deformation along the horizontal
diametral plan is measured using two extensometers
connected ill series. (Hua extensometers snudd_ have aa
resolution < 1 um with a measuring range of 3.75 mm.
Type 632.11C' extensometers .famn AHE? Corporation
are used in the VMS.
Thermostatic Chamber: The thermostatic Chamber shall be capable of control over a temperature range from 2 to
ZOOC and with an accuracy of ilOC.
The normal test temperature is lOOC. If fatigue tests are conducted at two temperatures, the test temperatures shall be 4 and l5OC.
Recording and measuring system: During the test, the
compressive load and the horizontal deformations are
measured at preselected intervals. All recording and
measuring devices shall be able to conduct at a minimum frequency of 10 Hz.
Loading device: The loading device (Figure l) consists
of two ;platens 'with loading strips :mounted. on lmall
bushing guided posts, which centre the specimen, keep
the loading strips in the vertical plan, and eliminate
undesirable movement of the specimen during testing.
The upper platen. weighs 1000 g, which provides an
additional static load on the specimen. Loading strips
with concave surfaces and rounded edges shall have a.
radius (M5 curvature equal tm) the radius of time test
specimen Specimens shall :have 51 diametexf of either
ølOZ mm or ø152 mm, in which case the width of the
loading strips vnjj_ be 12.7 Imn and. 19.1 Imn
respectively.
Deformation strips: The deformation transducers are
fixed tx: two cmumnxi steel strips vüüxül are glued cn1
opposite sides (ME the horizontal diametral plan. See
Appendix Page 3 (8)
Figure 1. The deformation strips are 2 mm thick, 10 mm
wide and normally 80 mm long. The length of the strips
depends on the specimen thickness. It is recommended to have a set of strips with different lengths. At each end of the strips there is a screw with a plastic nut
for adjusting tina measuring range (HE the deformation
transducers.
Gluing rig: The gluing rig will help positioning of the
deformation strips at the opposite sides of the
horizontal diametral plane. The rig, illustrated in
Figure 2, is suitable for both ølOZ mm and ø152 mm
diameter specimens and for the various lengths of the deformation strips.
Glue: A quick hardening cyanoacrylate type glue has
been found suitable.
Load cell
Asphalt specimen Extensometer Deformation strip Loading strip
Figure 1. The loading device with loading and
deformation strips and specimen in place.
Appendix Page 4 (8)
Figure 2. The glue rig with deformation strips and
specimen.
4 Specimen preparation
Prepare 10 to 18 test specimens according to laboratory
compacting standards or using cores from the road
layer. The specimen shall have a thickness of at least 40 mm and a diameter of 100 mm for a maximum aggregate size of 25 mm, and a thickness of at least 60 mm and a diameter of 150 mm for a maximum aggregate size of 38 mm.
Measure the cünmmsions (ME the specimens according to
the standards.
Glue the deformation strips on the horizontal diametral plane of each specimen.
Place tina specimens in time thermostatic Chamber' and
expose them to tina specified test temperature for at least 4 hours prior to testing.
5 Test procedure
The test shall be planned to cover a strain level range
of approximately 100 to 400 ps which is expected in the initial life of roads.
The calculated tensile strains at the bottom of
roadbase layers in Swedish conditions vary between
100 and 350 us,.measured at 2m_year after opening.
Appendix Page 5 (8)
The specimen shall be positioned in the loading device
so that the aXis of the deformation strips is
perpendicular to the axis of the loading strips.
The deformation transducers shall be mounted and
adjusted so that the total gauge length can be used.
During time test, the load enui horizontal deformation
are sensed continually and recorded at the preselected
intervals.
The test shall normally start at about 250 kPa loading amplitude. Apply a repeated haversine load with 0.1 sec
loading time and 0.4 sec rest time (a frequency of 2
Hz). If the deformation shown on the Hmnitor during
the first 10 applications is outside the strain range
(100 - 400 us) the test shall be smopped immediately
and the load level adjusted.
In almost every case, 250 kPa has been found to be a. practical stress .level. .Experienceri operators can choose a suitable stress level with regard to
the stiffness of the tested material.
The tests are also planned so that the fatigue life of
tested material will be in a range between 103 and 106
number of applications.
When obvious cracking is shown on the vertical aXis, the test is stopped.
6 Calculation and reporting of results
6.1 The following procedure shall be carried out
for each specimen tested:
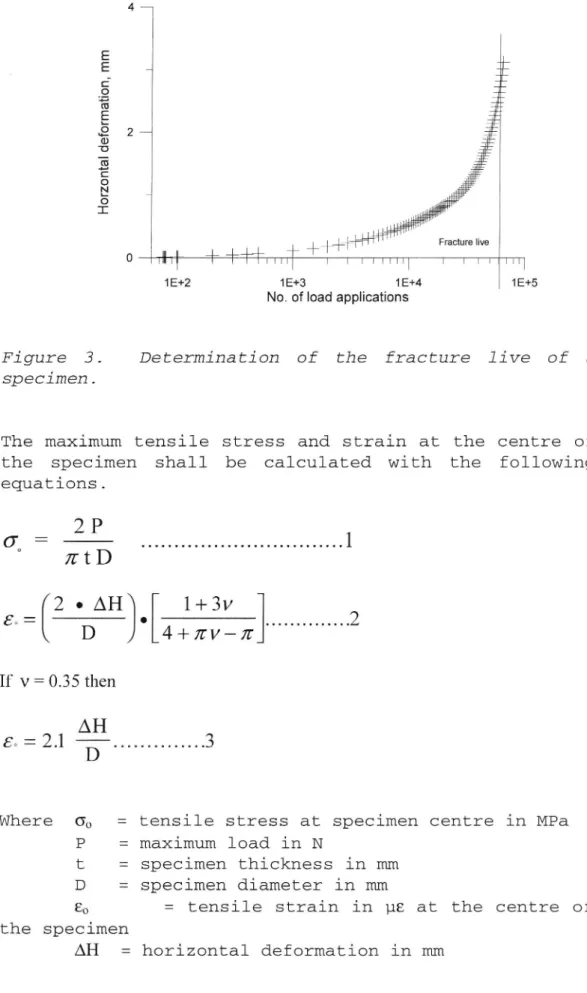
Determine tina fracture life. THME fracture life (IE a
specimen is the total number of load applications that
causes a complete fracture of the specimen. The
fracture life is obvious from the relationship between
log' number" of lrxxi applications euui horizontal
deformation. See Figure 3.
Appendix Pag66(8) 4_ E E _ C. .9 Ti
E
8(D 2-_ '0 3c 0 E _ o I un_|_ _L_ _1_| | + _ ' FractureliveO HIIII I Illlllll I IIIIHI. I III III!
1E+2 1E+3 1E+4 1E+5
No. of load applications
Figure .3. Determination cdf tina fractUIEe live CU? a
specimen.
The maximum tensile stress and strain at the centre of
the specimen shall be calculated with the following
equations. ZP (70 = --- ... ..1 ntD (2.zni)[ 1+3v ] a: ---- ... .2 D 4+nv-n Lf\/=(l35then ZlAH 3
a: .-- ...
DWhere 00 = tensile stress at specimen centre in MPa
P = maximum load in N
t = specimen thickness in mm
D = specimen diameter in mm
&) = tensile strain in us at the centre of
the specimen
AH: = horizontal deformation in mm
Appendix :Page'7(8)
The initial strain is calculated from the total
horizontal. deformation en: the ZUNTh loaci application,
which is illustrated in Figure 4.
The initial strain shall be calculated after the
deformation has been stabilised, which normally
occurs before 60 load applications. The initial
strain value is calculated' from the difference
between the average of the total horizontal
deformations of 5 load applications from 98 to 102
and tina average (if the IMULUMHD horizontal
deformations of 5 load applications from 60 to 64.
ThiS'_procedure .makes it easy' to <aalculate the
initial strain by computer from the data sheet for the specimen. TD = Total deformation RD = Resilient deformation PD = Plastic deformation De fo rm atio n RD 'LÅPD 4 Time
Figure 4. Definition (lf the txnxil horizontal
deformation.
The fatigue criterion for an individual bituminous
material is determined from the tested specimens. The least-squares regression relationship shall lya fitted
tm) the data CMS the log (ME the initial strain as an1
independent variable and time data of tina log (HE the
fracture life en; a. dependent 'variable according to
equations 4 and 5.
Log Nf = k+n10g 80 ... ..4
n 1 Nfzk _ . . . . Q whereNf = number of load applications
k and n = material constants
80 = tensile strain in us at the centre of
the specimen.
Appendix Page 8 (8)
7 Report
The test report shall include:
- a statement that the test has been performed
according to this standard, and the testing date,
- the identification of the mixture,
- identifications of the specimens,
- testing temperature,
* 51 graphical enui mathematical. presentation (ME the
fatigue criterion,
- the R2 value

![Figure 2 shows the influence of the total strain and the resilient strain on fatigue curves using ITT with respect to temperature [4].](https://thumb-eu.123doks.com/thumbv2/5dokorg/4916743.135402/5.892.206.675.190.407/figure-influence-strain-resilient-strain-fatigue-respect-temperature.webp)
![Figure 4 Fatigue curves ofa mix at diferent temperatures obtained by different laboratories [8] and the fatigue curve obtained by [TTfor the same](https://thumb-eu.123doks.com/thumbv2/5dokorg/4916743.135402/7.892.236.656.103.444/figure-fatigue-diferent-temperatures-obtained-different-laboratories-obtained.webp)