How Does Culture Influence
Experiences of Happiness and
Well-being?
A Comparative Study of Chinese and Swedish
Perceptions
BACHELOR THESIS WITHIN: Global Studies
NUMBER OF CREDITS: 15 ECTS
PROGRAM: International Work
AUTHORS: Monica Bartels, Eevi Salo
EXAMINER: Berndt Brikell
School of Education and Communication Jönköping University
Box 1026 Authors:
551 11 Jönköping Monica Bartels
Phone: +46 30 10 10 00 Eevi Salo
Abstract
The purpose of this study is to analyze if and how cultural values and expectations in society influence the experiences and perceptions of happiness and well-being. Applying a quantitative research methods approach, a survey based on previous research was conducted to compare and analyze experiences and perceptions between two contrasting cultures, China and Sweden, using Hofstede’s national culture dimensions as an analytical tool. The sample consisted of students from China and Sweden.
The findings from the study show that both groups ranked family as being the domain of life most important for their well-being, followed by health for the Chinese group, and friends for the Swedish group. There were statistically significant differences in the mean responses in some questions that may be attributed to cultural differences. For example, finishing long-term difficult tasks was ranked more important for the well- being by the Chinese group. As for the Swedish group, they felt to a higher degree that they had the freedom to choose what they would like work with. The majority of the responses, however, were similar between the two groups. The paper discusses how globalization may contribute to converging values in the current generation of students. Furthermore, other factors such as internal abilities and societal and cultural structures have an influence on the possibilities to pursue goals in life. Happiness is achieved by finding a balance in life between what you can achieve and accepting what you cannot. The themes and concepts used in the study are inspired by Jongbloed and Andres’ concepts of happiness as balance and gears of well-being. The study contributes to the research fields of human-centered development, and happiness studies on how subjective indicators as a complement to objective indicators can be used to better measure growth from a cultural perspective.
Keywords: capability approach, culture, globalization, happiness, Hofstede, subjective well-being, well-being
1 INTRODUCTION... 1
1.1 PURPOSE AND RESEARCH QUESTIONS ... 2
1.2 DELIMITATIONS ... 2
2 THEORETICAL FRAMEWORK ... 3
2.1 CENTRAL CONCEPTS AND DEFINITIONS ... 3
2.2 TOP-DOWN AND BOTTOM-UP PERSPECTIVES ... 5
2.3 WHAT MAKES THE PERCEPTION OF WELL-BEING RELATIVE? ... 5
2.4 PSYCHOLOGY OF WELL-BEING ... 6
2.5 SEN’S CAPABILITY APPROACH... 7
2.6 CULTURE AND WELL-BEING ... 7
2.7 ANALYTICAL FRAMEWORK ... 8
2.7.1 Happiness as balance and gears of well-being ... 9
2.7.2 Hofstede’s national culture dimensions ... 10
3 METHOD AND DATA MATERIAL ... 12
3.1 QUANTITATIVE RESEARCH APPROACH ... 13
3.2 ANALYSIS OF THE DATA ... 13
3.3 SURVEY DESIGN ... 13
3.3.1 Selection of respondents ... 14
3.3.2 Pilot survey ... 16
3.3.3 Non-response bias ... 16
3.4 ETHICAL CONSIDERATIONS ... 16
3.5 VALIDITY AND RELIABILITY OF THE STUDY ... 17
4 RESULTS ... 18
4.1 GEARS OF WELL-BEING ... 19
4.2 HAPPINESS AS BALANCE ... 23
4.3 SUMMARY OF THE RESULTS ... 26
5 ANALYSIS ... 27
5.1 ANALYSIS OF GEARS OF WELL-BEING ... 28
5.2 ANALYSIS OF HAPPINESS AS BALANCE ... 30
5.3 SUMMARY OF THE ANALYSIS ... 32
6 CONCLUDING DISCUSSION ... 33 REFERENCES...
Appendix
Survey questionnaire
Tables
1. Statistical analysis of which priorities are important for the respondents’ well- being and balance in life.
2. Statistical analysis of questions relating to work/study and leisure activities during a week.
3. The importance of social relations for well-being.
4. Experiences of societal and cultural limitations for achievements. 5. Statistical analysis on orientation of goals and achievements. 6. Coping abilities and taking responsibility for finding inner balance. 7. Statistical analysis of frame of reference.
Figures
1. Q7a. Ranking of Health 2. Q7d. Ranking of Family 3. Q7e. Ranking of Friends
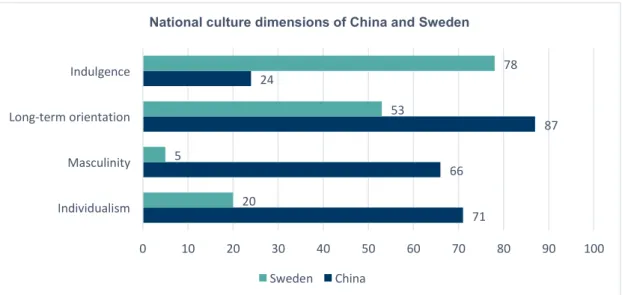
4. National culture dimensions of China and Sweden. Data retrieved from Hofstede Dimension Data Matrix (2015).
1 Introduction
Up until the mid-20th century, progress in development work was mainly measured and discussed in terms of economic prosperity and growth. Policymakers applied a top- down perspective and presented objective indicators as aggregated indices, such as GDP and GNI. During the 1970-1980s the concept of development evolved into having a more human-centered focus that included social and environmental aspects for achieving sustainable development (Sen, 2003). Quality of life indicators were added to the national statistics as a way to try and capture what impacts development had on human beings in society. In recent years, a number of indices have been developed by researchers in various fields of the social sciences with the aim of measuring inequality, for example gender gaps and quality of life. However, objective indicators have been criticized for not providing information on how people behind the statistics experience and perceive their wellbeing, which created a need to develop subjective measurements (Land & Michalos, 2017; Helliwell, 2018). Today, surveys to measure self-reported happiness and well-being are being created with a bottom-up perspective, in order to better capture how individuals within and across countries subjectively evaluate their happiness and well-being. This data is used as a complement to objective indicators to assess if development actions have accomplished desired effects in terms of perceived well-being in human development (Helliwell, Layard & Sachs, 2012; Veenhoven, 2012; Helliwell, Huang & Wang, 2017). For this reason, determining a coherent terminology regarding happiness and well-being is important as the data constitute the basis for policy-making and for research.
Jongbloed and Andres (2015) conducted a study to determine the perceptions of happiness and well-being among ordinary citizens in Canada. Happiness, the authors found, was defined as a balance between achieving one’s goals as well as having the ability to accept the goals one cannot pursue in life. Well-being on the other hand was perceived as a balance in the domains of life; health, work and social relations, what the authors referred to as the gears of well-being. These aspects of happiness and well- being become important once the basic needs of individuals are met.
Subjective measurements are by default subjective and relative in nature. How individuals experience and perceive happiness and well-being depend on external factors, e.g. income, health and their physical circumstances, and on internal factors pertaining to the inner qualities and capabilities of a person (Veenhoven, 2012). Moreover, the perceptions of happiness and well-being are also impacted by cultural values, both by influencing individuals’ inner qualities and the expectations to conform to the cultural norms in society. How cultural differences may affect happiness and well-being is a rather under-researched area (Diener, 2003; Ryff, 1989).
Hofstede claims that economic and technological development together with the globalization of the world’s economy are driving forces for societal and cultural change. The culture of a nation changes gradually. China, however, may be a rare exception to this as it has been isolated from global occurrences, yet in recent years has opened its borders and experienced a boost in the economy, as well as global exposure (Hofstede, 2011). Globalization also leads to an increased awareness of living standards between poor and affluent countries (Deaton, 2008). Since happiness surveys are conducted globally and the intensifying globalization is changing people’s frames of reference as well as cultures, it is essential to know how these dynamics impact the perceptions and experiences of happiness and well-being in different cultures, especially younger generations, as they are part of shaping the future.
As previous studies on cross-cultural comparisons of perceptions of happiness and well-being have been conducted mainly within North America, comparing European American and Asian American cultures, there is a gap in the literature regarding studies outside of North America (Diener, 2003). Our study contributes to filling this gap by conducting a comparative study of Chinese and Swedish experiences and perceptions of happiness and well-being. Using the concepts happiness as balance and gears of
well-being developed by Jongbloed and Andres (2015) our study adds on a cultural
aspect, by investigating cultural differences in survey responses between Chinese and Swedish students at Jönköping University, Sweden. The mean results from the two groups were analyzed to see how closely the groups’ responses correspond to Hofstede’s national culture dimensions, in which cultural differences between nations are organized into opposing dimensions according to their cultural characteristics.
1.1 Purpose and research questions
The purpose of the study is to analyze if and how cultural values and expectations in society influence the experiences and the perceptions of happiness and well-being, of the respondents from China and Sweden.
Do cultural and societal values and expectations influence the respondents’ experiences and perceptions of happiness and well-being? If so, how?
To what extent are there differences and similarities between the two cultural groups?
1.2 Delimitations
The study is limited to investigating whether cultural values influence experiences and perceptions of happiness and well-being in individuals. The theoretical framework derives from the fields of economics, psychology and sociology regarding human centered development, where subjective well-being is discussed in terms of relativity and abilities, rather than commodities.
Income level as a demographic variable was not included in the survey for two reasons; 1) as a survey question, it might have influenced the respondents to evaluate their happiness and well-being based on material needs, rather than inner experiences and perceptions. However, the respondents’ expressions may still be related to material needs or goods, as they are an inseparable part of how individuals evaluate their circumstances, and 2) the accuracy of disposable wealth and different currency denominations would complicate interpreting the data.
The survey was distributed to international and Swedish students at Jönköping University. A majority of the international respondents were from China, which gave us an opportunity to focus on comparing experiences and perceptions of students originating from China and Sweden, two contrasting cultures, according to Hofstede’s national culture dimensions. For that reason, other international respondents from the original sample were not included in our study.
2 Theoretical framework
The theoretical chapter is organized into different sections, illuminating the determinants and approaches that form the basis for perceptions of happiness and well- being. The literature points to the importance of understanding that the self-reported well-being of individuals is influenced by internal and external factors, and to what extent individuals can control these factors.
2.1 Central concepts and definitions Well-being
The terms happiness and well-being are commonly and often interchangeably used when measuring and reporting subjective well-being. Since the research of subjective well-being originates from different fields, the term has been given different connotations and purposes. The economists tend to describe well-being in terms of fulfilled desires, psychologists on the other hand speak of good feelings (hedonic aspects) and some researchers refer to satisfying basic needs. Another aspect that makes defining well-being difficult is that it is multifaceted as it originates from several inner emotions and incentives, and can therefore prove to be difficult to separate from other relatable terms. Well-being and happiness are often used as synonyms (Jongbloed & Andres, 2015). The usage of quality of life has in some UN and OECD documents been replaced with well-being in more recent years, to define a more human centered approach (Land & Michalos, 2017).
Subjective well-being
Subjective well-being is defined as “a person’s cognitive and affective evaluations of his or her life” (Diener, Lucas, & Oishi, 2002, p. 63).
Happiness and life satisfaction
White (2014) argues that happiness is a vague and an abstract term that is highly individual by definition. Researchers in the field of philosophy have tried to define the concept of happiness without coming to a definite conclusion. The term happiness, in some cases, is used synonymously with terms such as life satisfaction, positive or hedonic feelings. As an example, the World Happiness Report is based on a survey question using the term life satisfaction, yet the results are reported as happiness. As research within the field of happiness studies use data based on this survey question, the terms life satisfaction and happiness are used interchangeably. According to Helliwell, it could be argued that the term happiness is only a popular choice and not as good as subjective well-being, but it serves a dual purpose in a linguistic sense. Happiness is both a positive emotion and a part of cognition when asked about the quality of life (Helliwell, 2018).
Cultural bias in defining happiness
Another aspect to take into consideration is cultural variations in defining happiness. In a study conducted by Lu and Gilmour (2004), Chinese students considered spiritual and communal aspects, whereas American students portrayed individualistic and materialistic ideas while defining happiness.
Constructs of happiness by ordinary citizens
The ordinary citizen’s conceptions of happiness and well-being have not been much explored, although it is critical in terms of ensuring valid answers in surveys on happiness and well-being (White, 2014). When ordinary citizens were asked how they perceived happiness and well-being in the study by Jongbloed and Andres (2015), the findings indicated no unitary construct of happiness and well-being. In fact, they were perceived as two distinct concepts; happiness as balance and gears of well-being. Happiness was perceived as having an inner balance between the achievement of desired goals and coming to terms with and accepting what you cannot achieve. Well- being, on the other hand, is affected by the balance between the domains of life, more specifically between social relationships, work and health.
The definitions of happiness and well-being used in the study
We have chosen to define happiness and well-being in the terms of Jongbloed and Andres (2015). However, when referring to the literature in the theoretical framework, we have used the same terminology as the authors.
The definition of culture used in the study
We have chosen to use Hofstede’s definition of culture, as being “the collective programming of the mind that distinguishes the members of one group or category of people from others” (Hofstede, 2011, p. 3). According to Hofstede, cultures can differ between societies, nations, social classes and generations.
2.2 Top-down and bottom-up perspectives
Having an individual or societal perspective in the creation of subjective measures is discussed by Barrington-Leigh and Escande (2016), who identified two strategies on how these measures are created. The more traditional strategy is the top-down approach, which rests on theory-based principles on desirable outcomes, whereas the bottom-up approach is more empirical and democratic, since the population is directly consulted before an index or indicator is constructed. One example of the latter is the UK Office of National Statistics (ONS) that tried to establish a consensus of the term “national well-being” in the UK. Through the hosting of a number of events all over the country, online debates and inviting comments from the general public they were able to create “a set of indicators comprising 10 domains and 38 individual measures” (Office for National Statistics, 2012 in Barrington-Leigh & Escande, 2016).
Helliwell (2018) highlights the importance of subjective measures as means of evaluating well-being, because this gives people the power to evaluate their own lives and show what they value in life. Land and Michalos (2017) state that since the results from objective and subjective data are sometimes paradoxical, it is important to do research in both fields as complementary. This joint effort was promoted by UN in 2011 in a resolution to measure happiness, which led to the World Happiness Report being published annually (Helliwell, Layard & Sachs, 2012).
2.3 What makes the perception of well-being relative?
The relation between happiness and external factors, in this case, income, was investigated by the economist Richard A. Easterlin (1974). In a survey-based study in which individuals were asked about their self-reported happiness, it was found that within a specific country at the individual level, people with higher incomes were also happier. However, in a comparison at a national level between countries, happiness was not significantly associated with a high GDP. Instead happiness was influenced by factors such as health, status, employment and family. This relationship, contrary to expectation, became known as the Easterlin paradox and was later debated by researchers who were able to show that there was no paradox, countries did indeed become happier with increasing income (Veenhoven, 2012; Stevenson & Wolfers, 2008). Easterlin also found that income increments over time did not increase happiness. This was attributed to the fact that people tend to compare their own situation to the social norm of their context and their experience, which can influence how they respond to questions about happiness in surveys. Happiness, thus, becomes relative to this norm, or as Karl Marx explained it some 100 years ago; "A house may be large or small, as long as the surrounding houses are equally small it satisfies all social demands for a dwelling. But if a palace rises beside the little house, the little house shrinks to a hut.", (quoted by Lipset, 1960 in Easterlin, 1974, p. 111- 112). Furthermore, Deaton (2008) suggests that life satisfaction is closely related to income
and that globalization has increased the awareness of inequality in living standards between both poorer and more affluent countries and thus widened peoples’ abilities to compare.
In addition, subjective well-being is affected by health. Deaton’s (2008) regression analyses showed a pattern of relative life satisfaction in regard to one's satisfaction in health and the actual level of health in the country. According to Deaton, countries in the former Soviet Union were very dissatisfied with their health, especially within the older age groups. This may be due to the rapidly deteriorated healthcare system of those countries. Many African countries with a high prevalence of HIV and other severe health issues, however, reported a greater satisfaction in health, except for in countries where health measures had suddenly become worse. An age group in the Western countries that were dissatisfied with health was people in their 50s, but not in their 60s or 70s. Deaton’s theory is that people in their 50s, older citizens of the former Soviet Union and African countries with deteriorating health numbers, all have experienced a sudden change in health and have not yet adjusted and learned to cope with it, making life satisfaction relative. Deaton concludes by stating that self-perceived satisfaction of health is closely related to general life satisfaction, even more than economic growth or life expectancy.
2.4 Psychology of well-being
How the meaning of a good life, in part, is a philosophical question, and therefore difficult to test empirically is discussed by Ryff (1989) and McMahan and Estes (2010). By combining Aristotle’s philosophical theory, that “happiness is the highest of all goods achievable by human actions” with development and social change theories, Ryff suggests that psychological well-being consists of six categories of wellbeing; “self- acceptance, positive relations with others, autonomy, environmental mastery, purpose in life, and personal growth” (Ryff, 1989, p. 1072). A good life, according to Ryff, is balanced and attends to all different categories of well-being broadly and allows for the realization of an individual’s true potential.
McMahan and Estes (2010) make a clear distinction between the conceptions of the nature of well-being as hedonic or eudaimonic, further building on the theory of the philosopher Aristotle. The hedonic dimension of well-being focuses on short-term experiences of happiness and pleasure, for example buying material goods. The eudaimonic dimension has more long-term goals of growing as a person, pursuing life- goals and contributing to the good in society.
Related to these distinctions of well-being are the thoughts by Veenhoven (2012) who defines four qualities of life. Two of them have to do with the chances one receives in life. They are further divided into internal and external qualities. The external one is
environment in the society, this is a prerequisite for well-being. Life-ability, on the other hand, is impacted by the internal qualities and chances a person has in life. This has to do with the inner capability one has to cope with life and not only the absence of negative health. This ability provides the possibility to deal with life and to develop. Life-ability is closely related to Sen’s capability approach.
2.5 Sen’s capability approach
How people evaluate their quality of life and well-being also depends on the possibilities and freedoms they have to pursue things that are important to them. The capability approach is an aspect of evaluating the quality of life, which differs from the commodity-based perspective. Amartya Sen (2003) uses the term functionings, which consists of “beings and doings”. The emphasis here is on people as active agents, taking an active part in participating in activities whether they are basic functionings needed in life, such as nourishment, or complex in nature, such as partaking in the community or achieving self-respect. Together, this becomes and describes the state of a person. Capability refers to the ability a person has to participate in those functionings and how much freedom a person has to choose the life he or she is leading. This is an important aspect as capabilities provide the means to choose what a person needs in life, as opposed to objective measures and utility-based approaches, where utilities are dictated and provided by authority, and where a person has to comply with these circumstances. According to Sen, a deprived human being may come to endure the deprivation and no longer grieve their harsh circumstances. This in turn, impacts personal goals in life. Sen mentions external factors that impact one’s capabilities in life, such as health and education. Without these it is difficult to have the freedom to choose the life one would want. Sen highlights the importance of making a distinction between ends and means, where capabilities should be the purpose itself, not a means to boost productivity or economic growth. Capabilities are rather expressions, not means, of freedom (Sen, 2003).
2.6 Culture and well-being
It is debated whether happiness and well-being are universal or culture specific. Tov and Diener (2007) state that the universalism of well-being and happiness is often linked to basic needs. Although there are different views of what universal basic needs may be, most researchers, according to Tov and Diener, mention social relations, autonomy and purpose in life, on top of basic material needs. Cultural differences in happiness and well-being, however, are impacted by the values of each culture. This in turn has an influence on which goals are considered meaningful to be pursued and thereby increasing self-satisfaction. As an example, people in collectivistic cultures are more likely to feel satisfied by helping others and heeding to societal norms, whereas people in individualistic cultures feel satisfied by having freedom and pursuing goals
that relate to one self or entail short-term satisfaction. Also, pursuing important goals and whether there are conflicts in goals, influences well-being.
There are also differences between national mean life satisfaction across nations, as well as mean life satisfaction of different ethnic groups within the nations, that are not completely explainable by income or other socio-economic factors. Wealthier nations measure higher in life satisfaction, but in most nations, however, this also equals with having functioning democracy, respecting of human rights and equality, which means that wealth may not be the only source of well-being. An increase in income has the largest impact on well-being in conditions with minimal income, which may be linked to material basic needs (Diener, Oishi and Lucas, 2003).
Diener, Oishi and Lucas (2003) use examples of Asian American and European American students’ values to illustrate the differences between individualistic and collectivistic societies. When facing a difficult task, European American students are prone to change to something more achievable or hedonic, whereas Asian American students continue with their long-term goals, to master the difficult task at hand. It has not been measured whether this leads to greater satisfaction in life later on, although Diener, Oishi and Lucas estimate that easier, achievable goals may provide immediate life satisfaction for the moment, which could be an explanation to why European Americans are more satisfied with life. Another possibility provided is the stereotypical presumption that Americans value self-enhancement, whereas Asians are more self- critical. These studies have, however, been conducted within individualistic countries. Therefore, little can be said of how goals impact well-being within collectivistic countries (ibid.). Diener ties together and exemplifies how culture and well-being are interrelated. The concepts of happiness, well-being and culture are discussed further in the analytical framework.
2.7 Analytical framework
This study is inspired by and designed with reference to the before-mentioned study by Jongbloed and Andres (2015). Jongbloed’s and Andres’ study is interesting in the sense that they took a grass root perspective in asking ordinary citizens to define their conceptions of happiness and well-being, which emanated into the concepts
happiness as balance and gears of well-being. These concepts have been applied in
this study, when constructing the survey questions and in categorizing the findings from our survey into themes found in the concepts.
To add a cultural dimension to these concepts and to inquire if there were cultural differences in the experiences and perceptions of the Chinese and the Swedish groups, the survey questions were created to implicitly point in the directions of Hofstede’s (2011) national culture dimensions, in which cultural differences between nations are organized into opposing dimensions according to their cultural characteristics. The
mean results from the two groups were analyzed to see how closely the groups’ responses correspond to Hofstede’s national culture dimensions.
Some researchers in the field of happiness studies, use only the dimension of collectivism and individualism, thus simplifying the richness and complexity of cross- cultural differences. Using only one dimension could have brought more focus to the analysis. Nevertheless, in order to answer the research questions and to analyze the survey answers, four of Hofstede’s dimensions were deemed necessary to capture the essential cultural aspects. Although the dimension of national culture and the concepts happiness as balance and gears of well-being study different phenomena, there are several touching points between them such as freedom, goals, achievements, acceptance, social relations, and work-life balance. These concepts and dimensions are accounted for in the following sections.
2.7.1 Happiness as balance and gears of well-being
Jongbloed and Andres (2015) applied a bottom-up approach to determine an ordinary citizen’s perspective on happiness and well-being, building their study on the concept of Sen’s capability approach. They conducted a mixed-methods sequential study that used qualitative interviews followed by a paper-and-pen survey to examine the constructs of happiness and well-being. The interview sample consisted of 24 Canadian citizens in their mid-adulthood. The respondents that participated in Jongbloed and Andres’ study were chosen from a larger population of 574 graduates from high- school, “the class of 88”, where the same respondents participate regularly in survey waves called “Paths of Life’s Way”, since their graduation in 1988 (Jongbloed & Andres, 2015).
Happiness as balance
Happiness was perceived as a relative term, where the awareness of possibilities was often used as a frame of reference. Some respondents compared their own circumstances with better or worse conditions either based on knowledge or imagination, whereas other respondents used time-related references to past, present or future circumstances. Comparing to better conditions often made the respondents feel unhappy, whereas comparing to worse circumstances made the respondents feel grateful for what they had (Jongbloed & Andres, 2015).
Another aspect of happiness is how subjective the evaluation of one’s happiness is. Some participants were happy with their lives, even when their circumstances were seemingly worse than many others’. Some commented that they had chosen to be happy with what they had and to accept things that could not be achieved. A third aspect of happiness was freedom, which closely relates to Sen’s capability approach. This has to do with the ability and freedom a person has in life to pursue and achieve the goals they want, to shape one’s own life. These goals may be material, but most often refer to
goals of immaterial nature in a person’s life, such as the ability to spend time with family (Jongbloed & Andres, 2015).
The concept happiness as balance combines these aspects, as happiness is found between striving to achieve desired goals while also accepting things beyond one’s control. The balance between these shifts constantly throughout life, due to changing circumstances, which lead to changing levels of happiness. Happiness is contingent upon people experiencing that they have a balance in their lives (ibid.).
Gears of well-being
Happiness and well-being were defined as closely related concepts, yet distinct. Gears of well-being relates to the domains of life; social relationships, work and health, where health entails both mental and physical health. The domain of social relationships was regarded as the most essential for one’s well-being. The gears of well-being is a metaphor, as it illustrates how these three domains co-operate. The term gear also refers to the gears of a bicycle, as during the course of an individual’s life, emphasis on the different domains varies and is adjusted to adapt to external events and to their resources, their capabilities at hand. These events can refer to changing jobs, starting a family or experiencing health problems, in which case, a person needs to prioritize one gear over another. The gears of well-being relate to Sen’s capability approach as prioritizing and balancing the domains is steered by the ability to do so. Unlike happiness, well-being is more constant over time, as it is based on careful planning and considerations (Jongbloed & Andres, 2015).
2.7.2 Hofstede’s national culture dimensions
Hofstede (2011) gained access to a large survey database through IBM in the 1970’s, which consisted of more than 100,000 surveys conducted on IBM employees in over 50 countries. The employees were a perfect sample across nations, as they were similar in all aspects, except for nationality. Hofstede compared mean national scores across nations, since, according to him, studying cultures at individual level is too confounding, whereas average national scores tend to show large patterns of variation between nations and cultures. To reach confirmation for his findings, Hofstede compared his data with external data as well as results from a similar survey he conducted on a smaller scale. This lead to the development of four national culture dimensions. Since then, two dimensions have been added through additional research, together with Michael Minkov. Each dimension is presented in terms of dichotomies, where countries are placed on a scale between the two opposites in accordance to their results. These placements are continuously validated through replication studies. Though Hofstede’s theory of cultural dimensions originates from business organizations, it has been applied in cultures and societies in general. There have been discussions on how generalizable these dimensions are to larger populations, as individuals in a society are more heterogeneous and deviant from these norms.
According to Hofstede (2011), the ranking of the countries and their position on the dimensional scale is relative, meaning that the ranking of each country is based on its relation to other countries. Hofstede estimates that when cultural changes occur, it happens globally in all of the countries, for example due to economic or technological development, which leads the cultures of each country to develop in the same direction, thus retaining the same position on the scale, in relation to other countries. China, however, may be a rare exception to this as it has been isolated from global occurrences for a period of time, yet in recent years has opened its borders and experienced a boost in the economy, as well as integration to global affairs. Hofstede suggests that further research should be conducted in the case of China, especially regarding the younger generation.
Below, we account for four of the dimensions that are most relevant for our analysis, while also providing the national cultural placement and context of both China and Sweden in relation to each dimension.
Individualism-Collectivism
The dimension of individualism and collectivism reflects the level of interdependence between the members of a collective and how integrated they are into those collectives or groups. Individualism refers to societies where individuals have weak ties to other members of the society and are expected to take care of only themselves and their immediate family. Individualistic societies are also high in respecting people’s privacy, personal freedom to choose, and voicing personal opinions and in recognizing people as individuals. Sweden has a high placement on this scale with a score of 71, which indicates a high degree of individualism (Hofstede, 2011; Hofstede & Hofstede, 2015).
Collectivism describes cultures where individuals are integrated into groups where the members have strong bonds between each other. Further, there is a high degree of loyalty within a group, which also implies that the group is protective outwards and may collectively oppose outsiders. People are expected to cooperate, support extended family members and consider the needs of the collective before their own. China scores 20 on this scale, inferring that it is very collectivistic. This means that relationships are regarded as more important than tasks, and individuals are more loyal to their families and people within their close circles than to companies or organizations (Hofstede, 2011; Hofstede & Hofstede, 2015).
Masculinity-Femininity
Masculinity refers to societies where individuals are competitive and where winning and achieving are important through different stages of life. China measures 66 on this score. Hofstede provides examples of the Chinese society in this sense as long working hours are prioritized over family time or leisurely activities (Hofstede, 2011; Hofstede & Hofstede, 2015).
Feminine societies on the other hand revere values such as inclusion, caring and solidarity. Success is measured in terms of how good lives individuals can lead and that everyone should have enough of everything, in moderation. Other aspects of feminine societies are that one should not be different, and that consensus should be reached while including everyone in decision making. Sweden is very feminine as it scores 5 on this scale (Hofstede, 2011; Hofstede & Hofstede, 2015).
Long-Term vs Short-Term Orientation
Long-term vs short-term orientation refers to the time reference of societies in relation to how well societies adjust to change. Short-term societies respect traditions over change in the society whereas long-term societies have a capacity to encounter changes as they are more adaptable. According to the long-term view, life or people are not stagnant, instead everything changes according to the circumstances, therefore the individuals must be able to adapt to and prepare for future changes. This view impacts a society to plan and prepare for the future, where adaptability is also expected of members of these societies. China measures 87 on the scale of having a long-term focus. Some examples are how educational achievements and future investments and savings are regarded as essential in guaranteeing a good future. Achieving good results also requires hard work according to the long-term orientation. Sweden scores 53 on this scale, which means a more moderate position close to the middle of the orientation (Hofstede, 2011; Hofstede & Hofstede, 2015).
Indulgence-Restrained
The indulgence-restrained dimension originates from the field of happiness studies and builds on the concept of Hofstede’s long-term vs short-term orientation. The dimension measures the degree of control individuals practice when giving into impulses or indulgent behavior. People in indulgent societies practice a lesser degree of control and often feel that they have freedom of choice over their lives, while reporting higher levels of happiness in surveys. Also, leisure time activities are perceived as important. Sweden measures 78 on the dimension of being indulgent (Hofstede, 2011; Hofstede & Hofstede, 2015).
Restrained societies practice a high degree of control in desires, often experiencing that they are restricted by societal norms and that indulgence is wrong. They also tend to have a negative outlook on life and a certain degree of cynicism. China scores 24 on this scale, meaning that it is a restrained society (Hofstede, 2011; Hofstede & Hofstede, 2015).
3 Method and data material
This chapter discusses the research method, the creation of the survey questions, selection of respondents, ethical considerations and the validity and reliability of the study.
3.1 Quantitative research approach
The objective of our study was to compare survey responses from two different groups to analyze whether there were cultural differences in the responses. We applied a quantitative research approach, which is appropriate for our choice of research method, collecting primary data through a survey with closed-ended questions.
3.2 Analysis of the data
The results from the survey responses were statistically analyzed in SPSS. By conducting independent samples t-tests, we tested for the equality of means from two independent samples; one on individuals from Sweden, a country considered to have an individualistic culture and the other on individuals from China, a country considered to have a collectivistic culture (Hofstede, 2011). With the t-test, one can compare samples of different sizes and it also works well with small sample sizes of less than 30, which made it ideal for our analysis (Denscombe, 2010).
Cross-tabulation tables on the responses for each survey question were created and examined to see the distributions of responses within the two groups, China and Sweden. Similar to Hofstede’s approach, particular emphasis was placed on investigating the differences in the mean responses of the groups.
To be able to respond to our research questions, the findings were interpreted and analyzed for cultural differences by using the concepts of Jongbloed and Andres (2015) and Hofstede’s national culture dimensions (Hofstede, 2011), which are described in chapter 2.7 and chapter 5 in more detail.
3.3 Survey design
Before creating the survey questions, we did extensive research on existing surveys on self-evaluated happiness and well-being and on relevant research articles in order to find the best way to word survey questions relating to our topic (Jongbloed & Andres, 2015; Waterman, Schwartz, Zamboanga, et al., 2010). In constructing the web-survey, we followed the OECD Guidelines on Measuring Subjective Well-being (2013). In particular, we paid close attention to:
the order of the questions; starting with demographic questions, continuing with important subjective well-being questions, and ending with more personal, self-scrutinizing questions
how the response options were anchored
Connecting to the concepts about what ordinary citizens consider the construct of happiness to be, the survey questions were categorized according to the themes of family and social relations, work, health, and happiness as balance (Jongbloed & Andres, 2015). By connecting to existing research on how subjective well-being is relative to the capabilities of a person, and to external and internal factors; questions pertaining to people’s sense of purpose and meaning in life, sense of control, and to what extent they feel part of something bigger than themselves, were included in the questionnaire.
The survey consisted of 28 questions. The first 5 questions were demographic multiple- choice questions, except for the questions on “nationality” and “religion” that were open-ended questions. The survey continued with 22 closed-ended questions formulated as statements with ranking type of responses. For the majority of these, a Likert ranking scale of 1–5 was used, where number 1 represented “not at all important”, and number 5 represented “most important”. Alternatively, “strongly disagree”/” strongly agree” as response options were used. In addition, one open-ended question asked for “the estimated hours of study/work per week”.
The question 6 in the survey is different from the others. This question is commonly used in the World Value Survey, and is asking for the overall satisfaction with life. The question was included, not for cultural comparison, but more to assess any differences between the groups on how they were experiencing their well-being as a whole, when taking the survey. The Likert scale used in this question is 1–10 (Inglehart, Haerpfer, & Moreno, et al., 2014).
To be able to investigate the cultural aspects of our research questions, the survey questions were formulated in such a way, that they implicitly connect to either the higher or the lower end of the Hofstede’s national culture dimension dichotomies (Hofstede, 2011), as discussed in chapter 2.7.2.
3.3.1 Selection of respondents
To be able to find respondents relevant for our purpose, we used a purposive sampling technique. This technique entails "hand-picking" respondents that are either relevant as a group or, have specific knowledge or experience of the topic investigated (Denscombe, 2010). The actual selection of respondents was done through a convenience sampling technique, which entailed e-mailing the web-survey hyperlink to a teacher, who volunteered to conduct the web-survey during her lectures with international students in the Pathway program at Jönköping University. To reach respondents from Sweden, we used our own network of Swedish students at Jönköping University to have them post the surveys in their respective closed student peer Facebook-groups. We believe these sampling techniques were appropriate as the teacher and ourselves could act as references and vouch for the legitimacy of the survey.
Inclusion criteria
As we were interested in grouping together respondents from countries considered having cultural differences as outlined by Hofstede (2011), our inclusion criteria therefore comprised respondents of different nationalities. Furthermore, to be able to compare cultural differences of the two groups, limiting the sample to individuals with common non-cultural features was important. The common non-cultural features of our sample were the fact that they were students and of the same generation.
Once the data had been collected it was screened for patterns. We received 78 responses in total. The data comprised 29 respondents from Sweden, 35 respondents from China and the remaining 14 respondents were from Iran, India, Brazil, Russia and Pakistan. As we had two fairly equivalent sample sizes of two contrasting cultures, a comparison between China and Sweden was deemed appropriate for our study and the remaining respondents were not included in the sample and analysis.
Chinese respondents
The Chinese students that participated in the survey were studying in the introductory Pathway program before entering the regular undergraduate programs at Jönköping University. These students had been to Sweden for around six months prior to participating in the survey. As they have lived in Sweden for some time, they have been in contact with the Swedish culture. They have also chosen to study abroad, which make them different from other Chinese students of the same ages, who choose to stay and study in China.
Swedish respondents
The Swedish students that participated in the survey were studying in undergraduate programs at the School of Education and Communication, Jönköping University. Some of the Swedish students are also in a different context, having moved away from home to study in Jönköping. In addition, even if the cultural context is similar across Sweden, their particular circumstances may still affect what they value in life.
Demographics of the survey respondents
The demographic data collected from the respondents included gender, age and religion. The gender distribution was uneven between the two groups; China had 43% male and 57% female respondents, and Sweden 21% male, 76% female, and 3% that responded, “other or prefer not to specify”. The age groups comprised mainly of the age interval 18–25-year olds, amounting to 84% of the total sample, with only a few respondents in other age groups. The data regarding religion were non-conclusive, as the responses were either scattered in terms of non-denominational and denominational variations or implying no religious affiliation. Moreover, this question was constructed as an open-ended and non-compulsory question, which enabled respondents to leave it unanswered. Due to the above noted types of responses regarding religion, it was excluded from the analysis.
3.3.2 Pilot survey
A pilot web-survey was distributed to friends with similar characteristics as our intended target groups. The feedback from the pilot respondents was taken into consideration when creating the final version of the web-survey.
3.3.3 Non-response bias
Although web-based surveys posted directly in open social media could have a quicker response time, we believe, these surveys tend to be more suitable for opinion-based surveys on recycling, buying organic food etc. The questions in our web-survey needed some inner reflection and thought, and so the survey was estimated to take longer to fill out. Filling out the survey during a lecture or in a closed Facebook group had the benefit of allowing the respondents to focus and take their time to reflect on the questions without being disturbed by the constant feeds of information in open social media. As the web-survey built on voluntary participation, the sample of responses by default over-represented individuals who were more inclined to respond than those who were not, for whatever reason they chose not to respond or did not complete the survey, i.e. non-response through refusal (Denscombe, 2010). Furthermore, a non-response stemming from non-contact bias may have occurred in the cases of Chinese students who did not attend their lectures and Swedish students who did not see the survey in their Facebook group.
3.4 Ethical considerations
Participation was voluntary and since it was a web-survey, respondents could choose to opt out of the survey if they did not want to participate or complete the survey. Since the topic of the survey was asking for respondents’ subjective experiences, which is a topic that can be sensitive to share, a specific statement was included in the survey’s introductory paragraph. There it was stated that by participating in the survey, the respondents confirmed that they understood that their responses were anonymous and would not be identified with them in any way and that they were at least 18 years of age. Furthermore, the respondents were informed of who were conducting the survey, and that it was part of a bachelor thesis project, which aimed at investigating whether there are cultural differences in how people experience aspects of happiness and well- being in their lives.
Another ethical consideration relates to a hot topic currently debated in society; namely the ethics of social media companies' illegal data mining for private information that individuals post onto social media. As our survey was conducted during a time when this debate was very active in social media, it was identified as a potential risk for
receiving a lower response rate in case some respondents were skeptical about the legitimacy of the survey and of how their data would be used. One way to strengthen the perceived legitimacy and build trust in the chain of respondents, was to distribute the survey from known acquaintances to known acquaintances.
3.5 Validity and reliability of the study
Validity refers to the accuracy and precision of the data collected, and if the methodology and the data are appropriate for the purpose and the research question (Denscombe, 2010). To strengthen the validity of the study, we chose two groups of respondents with similar characteristics, with the majority of the respondents being students of about the same age. The major difference between the groups was their cultural background.
The survey questions were designed methodically, based on those found either in existing surveys on well-being, or in survey studies published by top scholars in relevant research fields, where the validity of the questions had been tested previously. Moreover, this study adapted the findings from the qualitative interviews in Jongbloed and Andres (2015) study as themes in the survey. They, in their turn, gathered data from a longitudinal study conducted regularly with the same individuals for over 20 years. In addition, we tested the questionnaire in a pilot survey. The thoroughness in the survey design, the pilot survey and the building on previous research further strengthen the validity of this study.
Another aspect of validity is that the survey questions were written in the English language, a second language to both groups. To increase the validity, the questions in the survey were adjusted to fit with the assumed language level of the sample. However, although both groups of students are expected to have sufficient English language skills to be eligible for studies at university level, there may be individual differences in how the survey questions are understood. Furthermore, cross-cultural bias in interpreting the wording can occur between individualistic and collectivistic cultures. As described by Diener, Oishi and Lucas (2003), in individualistic cultures, “I” relates to the person in question, whereas in collectivistic cultures, “I” relates to the collective, rather than to the individual person.
A survey with closed-ended questions results in quantitative, standardized data, where differences between groups can be analyzed objectively, but no finer distinctions or explanations can be retrieved from the data. This may be seen as a weakness of the data collected, but also a strength, as standardized data lower the risk of bias from the researchers during that part of the research process. However, to be able to compare the responses quantitatively, a subjective assumption was made, in that the respondents have considered the qualitative differences between each of the numbers 1–5 of the Likert scale as being equal.
Reliability refers to the trustworthiness in what is being investigated or measured (Denscombe, 2010). Measuring experiences and perceptions are difficult, as these are subjective, and relative to internal and external factors in people’s lives. Whether interviews or surveys are used, the results are difficult to generalize and tend to be reliable only within the particular context. The external reliability of the data increases with larger sample sizes, and by conducting surveys regularly on the same population (ibid.).
The weakness of our study is the relatively small samples sizes, that are non- representative for the whole population, and impacts the generalizability and the repeatability. For the same reasons the non-variance in the demographics within the two groups can be a weakness, but it is also a strength. The fact that the two groups shared the context of being students of the same generation also made it possible to compare differences between them.
There can be a selection bias in the sample of Chinese students, in their willingness to study abroad, which makes them different from those who choose to remain in China and study. In addition, studying in Sweden presents a different societal and cultural context for the Chinese students, and that may have influenced their experiences and perceptions of happiness and well-being in relation to culture.
4 Results
This chapter presents the results from the statistical analyses of the web-survey. Whether the findings from the analyses are possibly influenced by the national culture dimensions prevailing in Chinese and Swedish cultures is discussed in chapter 5. As mentioned in chapter 3, the majority of the survey questions were formulated as statements, with responses based on a Likert scale, 1 – 5; where 1 represents “strongly disagree” and 5 represents “strongly agree” or similar, where a low ranking indicates a contradicting opinion to the statement. To be able to compare the responses between the groups quantitatively, we made the assumption that the respondents have considered the qualitative differences between each of the numbers 1 - 5 of the Likert scale as being equal. The means and standard deviations of the responses of each group were compared to determine whether there were any statistically significant differences between the groups. Although not accounted for in this chapter due to space constraints, cross-tabulation analyses were conducted to visualize the distributions of the responses. Question 6 in the survey was adapted from the World Value Survey, and used as the first self-evaluative question with the purpose of assessing the overall satisfaction with life. The respondents could answer on a 1–10 Likert scale, where “1” was completely dissatisfied and “10” completely satisfied (Inglehart, Haerpfer, & Moreno, et al., 2014). The question was included, not for cultural comparison, but more to investigate any
differences between the groups on how they were experiencing their well-being as a whole, when taking the survey. The results showed a mean of 7.09 for the Chinese group and a mean of 7.24 for the Swedish group. Rather similar results and the differences were not statistically significant. As the question did not contain any implicit cultural connotations, the results were not analyzed further.
In the following sections, the remaining survey questions have been systematically organized into the categories of gears of well-being and happiness as balance, as well as the subcategories within each category, based on the concepts developed by Jongbloed and Andres (2015).
The number of observations for each survey question comprised 35 respondents from China and 29 respondents from Sweden.
4.1 Gears of well-being
The domains of the gears of well-being comprise work, social relations and health and these gears change in importance during a person’s life. How people prioritize and choose which domains (the gears) of their life are most important for their well-being and balance in life was asked in question 7 of the survey, the mean results of the responses are presented below.
Ranking the domains of life
In order to try and find out how these different domains interact with each other, the respondents were asked to rank five domains of life, from “not at all important” (1) to “most important” (5). By ranking the domains in relation to each other, the respondents were forced to choose and prioritize the order of importance. The scale of numbers from 1 to 5 could only be used once, which meant that no two domains could have the same level of importance.
To be able to distinguish differences in the responses deriving from Hofstede’s individualistic-collectivistic cultural dimensions, the domains were slightly modified in this question. As a contrast to the option work, the option time for one’s own hobbies
and interests was added, to investigate whether respondents valued leisure time over
work. For the same reasons, the domain of social relations was split into two options,
family, and friends. The question 7a-e hence consisted of the following options: a) health, b) work/study, c) hobbies and interests, d) family, and e) friends.
The diagrams in figures 1–3 below illustrate the distribution of the two groups’ mean responses when ranking the two most important dimensions of life.
Family was the most important dimension of life for both the Chinese and Swedish
groups. The majority of both groups ranked family at 3–5 on the scale, which resulted in the highest mean response of question 7a-e.
Figure 1. Q7d. Ranking of Family
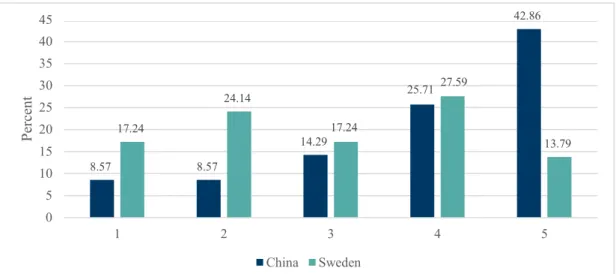
As the second most important dimension, the Chinese group ranked health. This was ranked as third most important by the Swedish group. The Swedish group showed a higher variance in their ranking, than the Chinese group, where the majority ranked health on 3–5 on the scale. Looking only at the number 5 bar, the discrepancy in the ranking between the two groups is clearly demonstrated.
Figure 2. Q7a. Ranking of Health
70 60 58.62 50 40.00 40.00 40 30 20 14.29 13.79 10 5.71 6.90 0.00 0.00 0 1 2 3 4 5 China Sweden 20.69 45 40 35 30 25 20 15 10 5 0 42.86 24.14 25.71 27.59 17.24 17.24 14.29 13.79 8.57 8.57 1 2 3 4 5 China Sweden Per ce nt Per ce nt
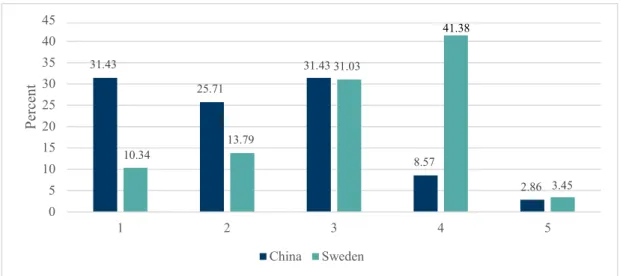
Even though a low number of respondents in both groups ranked friends as the highest on the scale, the overall mean results show that the Swedish students ranked friends as the second most important dimension of life, whereas the Chinese placed friends as the fourth most important.
41.38
Figure 3 Q7e. Ranking of friends
In tables 1–7 below, we list the survey questions divided into the two groups China and Sweden, followed by mean values (x̅), standard deviations, and significance level (p- value) of the differences in the mean responses.
Table 1 summarizes the overall mean responses for question 7a-e, along with the results of independent samples t-tests on the equality of the means for the two groups.
Table 1.
Statistical analysis of which priorities are important for the respondents’ well-being and balance in life
Survey questions Groups Mean x̅ Standard deviation p-value
Q7a. Ranking health. China 3.86 1.31 0.010***
Sweden 2.97 1.35
Q7b. Ranking work/study. China 2.74 1.40 0.797
Sweden 2.66 1.29
Q7c. Ranking own hobbies and interests.
China 2.06 0.94
0.842
Sweden 2.00 1.34
Q7d. Ranking family. China 4.06 1.03 0.490
Sweden 4.24 1.09
Q7e. Ranking friends. China 2.26 1.09 0.002***
Sweden 3.14 1.06 45 40 35 30 25 20 15 10 5 0 31.43 31.43 31.03 25.71 13.79 8.57 2.86 3.45 1 2 3 4 5 China Sweden 10.34 Per ce nt
The friends and health rankings show statistically significant different means for the two groups at or below the 1% significance level, where the Swedish group ranked
friends more highly than the Chinese group, and where health was ranked more highly
by the Chinese group than the Swedish group, as shown previously in figures 2 and 3. Insignificant results regarding differences in the mean responses are found for three of the dimensions; work/study, hobbies and interests and family.
Work/Study
The questions in table 2 examine the respondents’ perception of their work/life balance and whether the respondents experience enough time to relax and enjoy life. As the sample consists of students, the word “study” was added to question 7, 8 and 9. Question 9 was an open-ended question, where the responses were in the form of ratio data rather than ordinal data as in the Likert scale questions. The means of the two groups’ responses to question 9, for that reason, are quite different from the other means in table 2.
Table 2.
Statistical analysis of questions relating to work/study and leisure activities during a week
Survey questions Groups Mean x̅ Standard deviation p-value Q8. I feel I have a good balance
between work/study and my leisure activities.
China 3.60 1.00
0.452
Sweden 3.41 0.95
Q10. I feel I have enough time to relax and enjoy life.
China 3.74 1.01
0.112
Sweden 3.31 1.14
Survey question Groups hours/week Standard deviation Mean p-value Q9. Estimated hours of studies/work
per week.
China 35.5 16.9
0.199
Sweden 30.8 10.7
* p<0.10, ** p<0.05, *** p<0.01
The independent samples t-test shows that there is no significant difference between Chinese and Swedish students regarding the balance between work/study and leisure activities. Notable though, is that the sample of Chinese students study on average about 5 hours more per week than the sample of Swedish students (35.5 hours/week compared to 30.8 hours/week). This relationship is further analyzed in chapter 5.
Social relations
The questions in table 3 investigate the importance of family and social relations for one’s well-being, to what extent the needs of others are prioritized over one’s own needs and if being part of a social community is experienced as important.
Table 3.
The importance of social relations for well-being
Survey questions Groups Mean x̅ Standard deviation p-value Q19. Putting other people’s needs
before my own, makes me feel good.
China 3.23 0.88
0.003***
Sweden 3.97 1.02
Q20. One of my main goals in life is to make my family proud.
China 3.80 1.13
0.605
Sweden 3.66 1.08
Q24. Belonging to a social community is important for my well-being.
China 3.49 1.12
0.260
Sweden 3.83 1.28
* p<0.10, ** p<0.05, *** p<0.01
Question 19 shows that, in comparison to the Chinese students, the Swedish students on average respond more highly to putting the needs of others before their own for their well-being. This difference is statistically significant below the 1% significance level. The responses to the other two questions in the subcategory of social relations are not very different. Belonging to a social community was valued slightly higher by the Swedish respondents and making one’s family proud slightly higher by the Chinese respondents.
4.2 Happiness as balance Abilities and limitations to achieve
The questions in table 4 examine the respondents’ experiences of societal and cultural limitations for achievements in life. The abilities refer to the possibilities and freedom an individual has to pursue his or her desires regarding work and life in general. Question 23 relates to the other questions by specifically examining if independence is an important factor for the respondents’ well-being, as some individuals may not experience a lack of freedom as restrictive.
The differences between the groups in their mean responses to question 12, regarding to what extent they experience freedom to choose what they want to work with, are statistically significant below the 5% level, where the Swedish respondents experience a higher level of such freedom than the Chinese respondents. The differences in the mean responses to questions 13, 14 and 23 regarding freedom of choice and control, limitations on freedom to choose, and being independent, are not statistically significant.
Table 4.
Experiences of societal and cultural limitations for achievements
Survey questions Groups Mean x̅ Standard deviation p-value Q12. I have the freedom to choose what
I would like to work with.
China 3.51 1.17
0.029**
Sweden 4.14 1.02
Q13. I have freedom of choice and control over my life.
China 3.80 0.93
0.176
Sweden 4.10 0.82
Q14. Society’s expectations limit my freedom to choose how I want to live my life.
China 3.03 1.20
0.644
Sweden 2.90 1.05
Q23. Being independent is important for my well-being.
China 4.34 0.72
0.231
Sweden 4.10 0.86
* p<0.10, ** p<0.05, *** p<0.01
Achievements and goals
The questions in table 5 investigate what kind of goals the respondents value and the underlying reasons behind them. Questions 17 and 22 are about the preferences of short-term or long-term time-perspectives in setting one’s goals. Question 18 intends to capture whether the respondents have internal or external driving forces for pursuing achievements.
Table 5.
Statistical analysis on orientation of goals and achievements
Survey questions Groups Mean x̅ Standard deviation p-value Q11. I have a clear goal in my life. China 3.63 1.09 0.923
Sweden 3.66 1.11
Q17. I prefer to enjoy life now, rather than later.
China 3.63 1.24
0.405
Sweden 3.38 1.12
Q18. It is important to me that other people admire what I do.
China 3.17 1.15
0.164
Sweden 2.76 1.18
Q22. Finishing difficult long-term tasks is important for my well-being.
China 3.83 1.04
0.078*
Sweden 3.38 0.94
* p<0.10, ** p<0.05, *** p<0.01
In question 11, the Swedish and Chinese respondents express almost identical mean responses regarding having a clear goal in life. In question 17, the Chinese respondents score slightly higher on the preference of enjoying life now, rather than later. As
others admiring what they do, but the mean of their responses is not statistically different from that for the Chinese respondents. In question 22, finishing long-term tasks is more important for the Chinese students than for their Swedish counterparts on average. In question 22, there is a statistically significant difference in the mean responses for the two groups below the 10% level.
Acceptance and finding balance
The set of questions in table 6 measure to what extent the respondents are able to adapt and adjust to external circumstances beyond their control and their internal resilience to deal with limitations and changes in life. Question 25 refers to whether respondents feel that they themselves are agents for change or victims of circumstance.
Table 6.
Coping abilities and taking responsibility for finding inner balance
Survey questions Groups Mean x̅ Standard deviation p-value Q15. I feel frustrated when things out of
my control limit me from achieving my goals.
China 3.63 1.14
0.564
Sweden 3.79 1.11
Q16. I accept and adjust to the values in my culture over my own freedom to choose.
China 3.31 1.28
0.087*
Sweden 2.79 1.08
Q21. When things go wrong in my life, it generally takes me a long time to get back to normal.
China 2.83 1.34
0.086*
Sweden 2.34 0.86
Q25. I am responsible for my well-being. China 4.40 0.74 0.502
Sweden 4.52 0.63
* p<0.10, ** p<0.05, *** p<0.01
In question 15, the Swedish students report to a higher degree than the Chinese students on average, that things out of their control limit them from achieving their goals, but the difference is not statistically significant. The mean differences on the responses to questions 16 and 21 are statistically significant below the 10% level. In question 16 the Chinese students on average respond more highly than the Swedish students on accepting and adjusting to the values of their own culture over their own freedom to choose. In question 21, the Chinese students on average respond more highly than the Swedish students that it takes them a long time to get back to normal if they have experienced setbacks. Both groups reported similar means in acknowledging responsibility for their well-being.
Awareness of possibilities
The questions in table 7 intend to capture the respondents’ frame of reference when assessing their well-being and whether this assessment is done in comparison and in relation to other factors or not. No time reference was given for question 28, as it relates to the awareness of possibilities either now or in the future.