Akademin för Innovation, Design och Teknik
Lean Six Sigma for
In-Process Quality Improvement
- Case Study of a Battery Cell Production Process
Examensarbete
Grundnivå, 15 hp
Produkt- och processutveckling
Högskoleingenjörsprogrammet i Innovation Produktion och Logistik
Amiin Bihi
ABSTRACT
Purpose
The purpose of this thesis is to investigate the efficiency and performance of Quality control with focus on the inspections performed within production processes and how Lean Six Sigma can affect them. This can be done through mapping a current state to identify inefficiencies and wastes. The research will be used to answer following questions:
1. How can Lean improve efficiency for in-process quality control?
2. How can integration of Lean Six Sigma be applied to optimize processes? 3. Can Six Sigma techniques increase the performance of quality control?
Method
A production process approach to quality control was investigated through a case study. Data was gathered through Interviews, Observations, Measurements and a Survey. The case study was complimented with Theory through a literature study which provided data from books and scientific articles. The literature study also created more room for generalization within the study as connection and conclusions could be made with results found in other works.
Results
Through the case study it was discovered that the production process under examination was working with Lean practices to a certain degree. Regarding Six Sigma, not much trace was found of using the concept and its methods in practice. It was exposed through Lean that there was waste generated within the process defined as motion, transport and inventory which could be eliminated to improve efficiency. Through Six Sigma there was noticed that implementation could be made to increase the performance of operators to detect deviations and generate more data for quality management within their quality inspections.
Conclusion
The conclusion drawn within the research based upon the case study and literature study is that an integration of Lean Six Sigma can be made to improve efficiency as well as performance of quality control within a production process. Lean tools can be used to improve speed of the process and utilization of resources. Meanwhile Six Sigma can be used to increase the ability to detect deviations and perform quality work.
Keywords: Lean, Six Sigma, Value Stream, Quality Control, In-Process Quality Control,
SAMMANFATTNING
Syfte
Syftet med denna avhandling är att undersöka effektiviteten och prestanda för kvalitetsstyrning med fokus på de inspektionerna som utförs inom produktionsprocesser och hur Lean Six Sigma kan påverka dem. Detta kan göras genom att kartlägga ett aktuellt tillstånd för att identifiera ineffektivitet och slöserier. Forskningen kommer att användas för att besvara följande frågor:
1. Hur kan Lean förbättra effektiviteten för kvalitetsstyrning under processen? 2. Hur kan integration av Lean Six Sigma tillämpas för att optimera processer? 3. Kan Six Sigma tekniker öka prestanda för kvalitetsstyrning?
Metod
En produktionsprocess arbetssätt med kvalitetsstyrning undersöktes genom ett upplägg likt en fallstudie. Data samlades in genom intervjuer, observationer, mätningar och en undersökning. Fallstudien kompletterades med teorin genom en litteraturstudie som tillhandahöll data från böcker och vetenskapliga artiklar. Litteraturstudien skapade också mer utrymme för
generalisering inom studien då kopplingar samt slutsatser kunde göras med resultat från andra arbeten inom samma område.
Resultat
Genom fallstudien upptäcktes det att produktionsprocessen som undersöktes arbetade med Lean praktiskt till en viss grad. Gällande Six Sigma hittades det inte mycket spår utav användning av konceptet samt dess metoder inom praktiken. Det visades genom Lean att det fanns slöserier genererat inom processen definierad som rörelse, transport och lager som kunde elimineras för att förbättra effektiviteten. Genom Six Sigma märktes det att implementering kunde göras för att öka operatörernas prestanda för att upptäcka avvikelser och generera mer data för kvalitetsstyrning inom deras kvalitetsinspektioner.
Slutsats
Slutsatsen som dras inom studien som är baserad på fallstudien och litteraturstudien är att en integration av Lean Six Sigma kan göras för att förbättra effektiviteten såväl som prestandan av kvalitetsstyrning i en produktionsprocess. Lean verktyg kan användas för att förbättra
processens hastighet och resursanvändning. Samtidigt kan Six Sigma användas för att öka förmågan att upptäcka avvikelser och utföra kvalitetsarbete.
PREFACE
The author would like to give thanks to the participants of this work for their engagement and contributions.
A special thank you to Srdjan Milanovic, Test Engineer and Team Leader from Performance & Life Facility at Northvolt Labs AB.
Finally, I would like to give a sincere thank you to Anders Hellström at Mälardalen University for his continuous feedback, guidance and supervision throughout the thesis.
- Amiin Bihi
TABLE OF CONTENTS
1. INTRODUCTION... 8
1.1. BACKGROUND ... 8
1.1. PROBLEM STATEMENT ... 8
1.2. PURPOSE AND QUESTIONS... 9
1.3. SCOPE... 9
2. APPROACH AND METHOD ... 10
2.1. RESEARCH METHODS ... 10
2.1.1. Case Study ... 10
2.2. DATA COLLECTION METHODS ... 11
2.2.1. Survey... 11 2.2.2. Interviews ... 11 2.2.3. Observations ... 12 2.2.4. Measurements... 13 2.2.5. Literature study ... 14 2.3. DATA ANALYSIS ... 14
2.4. VALIDITY &RELIABILITY ... 15
2.4.1. Validity ... 15
2.4.2. Reliability ... 15
3. THEORETICAL REFERENCE FRAMEWORK ... 16
3.1. LEAN ... 16
3.1.1. Toyota Production System ... 16
3.1.2. 7+1 Wastes (Muda) ... 16
3.1.3. Kaizen... 17
3.1.4. 5 S ... 18
3.1.5. Value Stream Mapping... 18
3.1.6. Spaghetti Chart ... 20
3.2. SIX SIGMA ... 21
3.2.1. Motorola ... 21
3.2.2. DMAIC... 22
3.2.3. Control Plan... 22
3.2.4. Failure Mode and Effect Analysis (FMEA) ... 23
3.3. LEAN SIX SIGMA ... 23
3.3.1. Similarities ... 23
3.3.2. Differences ... 24
4. CASE STUDY ... 25
4.1. PRESENTATION OF COMPANY ... 25
4.2. CURRENT STATE:PROCESS FLOW AND QUALITY CONTROL ... 26
4.2.4. Current State Value Stream Map ... 35
4.3. IDENTIFIED WASTES AND IMPROVEMENT PROPOSALS ... 36
4.3.1. Identified Wastes ... 36
4.3.2. Improvement Suggestions ... 37
4.4. FUTURE STATE VALUE STREAM MAP ... 39
5. ANALYSIS ... 40
6. DISCUSSION, CONCLUSIONS AND RECOMMENDATIONS ... 41
6.1. DISCUSSION... 41 6.1.1. Literature Study ... 41 6.1.2. Case Study ... 41 6.2. CONCLUSIONS ... 43 6.3. RECOMMENDATIONS: ... 44 7. BIBLIOGRAPHY ... 45 8. ATTACHMENTS ... 46
8.1. CONTROL PLAN EXAMPLE ... 46
8.2. FMEAEXAMPLE ... 47
8.3. VSM–CURRENT STATE ... 48
8.4. SPAGHETTI CHART ... 49
ABBREVIATIONS
IDT Academy for Innovation, Design and Technology
MDH Mälardalen University
VSM Value Stream Mapping
TPS Toyota Production System
IPQC In-Process Quality Control
IQC Incoming Quality Control
OQC Outgoing Quality Control
DMAIC Define-Measure-Analyze-Improve-Control
WIP Work in Process
FMEA Failure Mode and Effects Analysis
AC-IR Alternating Current Internal Resistance
1. INTRODUCTION
This section describes the underlying base and starting point for the thesis work.
1.1. Background
Developing and structuring production processes for adolescent companies aiming to compete in the 20th century requires great strategic focus on the importance of working towards quality and efficiency. A commonly used example for excellence in production is the Toyota company, as they are well known for their work with creating Lean philosophies and methodologies. Lean is a concept that has become a staple in a plethora of industries, with the term Lean deriving from the successful Toyota Production System (TPS). The foundation of Lean production regards to elimination of wastes and minimizing lead-time for products while creating value within processes. With the knowledge and lessons learned from this system, countless companies have studied and implemented Lean Production and its tools connected to efficiency in production and continual improvement work (Liker, 2009).
On the other hand, there is also another widely known business methodology known as Six Sigma that was founded within the Motorola company. The difference of this approach
compared to Lean is that it specializes on the proven principles and techniques that are utilized to identify the causes for defects and variability within processes to create an error-free
performance (Pyzdek & Keller, 2009). The underlying similarities from both these concepts are process and quality improvement, these terms are commonly combined and referred to as “Lean Six Sigma” (Santos, 2019).
“Through integration of Lean Six Sigma tools and methods, an approach can be made to tackle problems at hand effectively” - (Salah, Rahim, & Carretero, 2010).
1.1. Problem Statement
Lean and Six Sigma has throughout the years invented multiple tools and concepts for use within production systems and processes to handle quality control. When looking into Lean it is apparent that the greater purpose of Lean is to eliminate all possible wastes to increase the value creation within a production system. Moments within processes which can be eliminated, should be removed or improved to decrease the lead time. Six Sigma on the other hand deals with increasing quality through careful management which when correctly utilized decreases the amount of errors and defects a business produces. Product quality can therefore be
improved through both concepts and applied to production in varying approaches. A common method and approach within production is to include a final quality inspection of produced product at end of production, meanwhile utilizing a few built-in methods for detecting deviations throughout the production line. Another approach is implementing in-process
quality control inspection stop points throughout a products production which can increase data generation and deviation detection. But the negative side of the approach to include multiple inspection throughout the production line can lead to increased production lead times and resource consumption for carrying out the inspections. The performance of in-process quality control can therefore be determined by its ability to accurately detect deviations during
production, the quality of the inspection work, the efficiency of resources used and the speed of the process (Januska & Faifr, 2017).
1.2. Purpose and Questions
The goal of this research is to investigate efficiency and performance of In-Process Quality Control methods and the process flow throughout a production process. Through mapping and utilization of tools and concepts, wastes and inefficiencies can be identified within a current state of quality control. Principles, Methods and Tools derived from the Lean and Six Sigma approaches will be identified and applied for utilization to create an overview with
recommendations to a future state of quality control. Question Formulations:
1. How can Lean improve efficiency for in-process quality control?
2. How can integration of Lean Six Sigma be applied to optimize processes? 3. Can Six Sigma techniques increase the performance of quality control?
1.3. Scope
To be able to answer stated research questions it is needed to first identify for the case study what factors specifies a product that is approved and within customer specifications. Within Li-ion battery cell productLi-ion it is the values derived from the Capacity, Internal Resistance, Dimensions and Weight of the produced cell. Quality control is a critical factor for companies and will be in this case investigated through an Li-ion cell production R&D sector. Within departments like these new materials, chemistries and production processes are continuously tested in order to push past limitations to create new products and processes for mass
production. R&D sectors are commonly smaller with low production volumes and staff. For this study the quality control of prototype production within a company is investigated to expose inefficiencies created within the production flow in regard to inspections and how that can have an effect on the products quality. Specific for Li-ion cells production, time that passes in-between charging and discharging processes can impact the product and quickly degrade quality as rechargeable batteries self-discharge when idle. The approach of in-process quality control will be investigated through the case study of the company Northvolt Labs AB and how it applies inspections for a process named “Formation & Ageing”. Selection of this particular company was due to the fact of close proximity and their acceptance of the proposed
investigation. The case study will be used as a method to map a current state of a process quality control from incoming product to finished outgoing product to identify and create an overview of a future state which can streamline the process and increase quality through integration of Lean Six Sigma.
2. APPROACH AND METHOD
This section describes the scientific approach and methods used for this thesis.
Before conducting scientific works or studies, it is required to define the research and working methods one will apply to the study. With this one can understand and know how to navigate throughout the study. These methods are chosen and based upon the goal and characteristics of the planned work to be carried out. These selections can be based upon if the works purpose is meant to describe, explore, explain or solve a problem or phenomenon (Höst, Regnell, & Runeson, 2006). As this thesis is meant to investigate how quality control can function to identify improvements and recommendations for a future state, the combination of exploratory and problem-solving purposes was defined as a basis. Where the early stages are exploratory, and the later stages of research are problem-solving.
- Descriptive studies research and explain how a subject function.
- Exploratory studies research to gain knowledge of how a subject function. - Explanatory studies research cause and effect to explain how a subject function. - Problem-solving studies research to find solutions for identified problems.
(Höst, Regnell, & Runeson, 2006)
2.1. Research Methods 2.1.1. Case Study
The research method of case study has within this thesis been utilized to investigate and collect data specifying the chosen case company and product. As the questions and problem statement weren’t clear within the early stages, case studying allowed the room for flexibility to be able to iterate between investigations to understand and create a smaller scope with accurate questions. Through interviewing employees, observing the production and measuring process times, important data was collected which could be used to explain the current state and identify areas for improvement or problem-solving. The method of case study is commonly used to investigate a specific case with certain predefined reasoning for it. Case studies include a wider range of flexibility where one can also adjust formulated questions and scopes in the early stages. With this method one is searching for a deeper understanding to be able to describe the case thoroughly (Höst, Regnell, & Runeson, 2006).
As this method studies a smaller part of a bigger picture to explain a “reality” one must be cautious as to the conclusions one draws, the conclusions aren’t generalizable as they lack statistic proof as surveying doesn’t since it utilizes random selection (Höst,
Regnell, & Runeson, 2006). To combat this negative it is common to combine results with other research methods to gather more data that can be related to the topic at hand (Ejvegård, 2009). Data collected with this method are mostly qualitative and gathered through Interviews, Observations or archive analyses (Höst, Regnell, & Runeson, 2006).
2.2. Data Collection Methods 2.2.1. Survey
To gather more basic knowledge and information regarding the current situation of the production process a survey was made and sent out to the different employees within the department. The survey was structured with questions that would bring the
researcher knowledge regarding continual improvement, production disturbances, Lean and Six Sigma methods use within the process. A survey can be structured in different ways depending on the type of questions and subjects included, answers from
participants can be either formulated as Yes/No, grading, selection or open. As the department is of rather small size containing 12 persons in total, a sample of 9 persons ended up partaking in answering the survey which was constructed with Yes/No questions or Grading alternatives. Depending on the size of studied group, the survey selects a sample to represent the whole group (Höst, Regnell, & Runeson, 2006). Therefore, the data collected through this method can be either qualitative or quantitative.
The survey helped by providing information from different employment levels within the department and how they view the process. According to research one can through surveying be able to describe certain phenomena for a study. With this method one can describe and, in some cases explain reasons as to why certain things happen within the studied field (Höst, Regnell, & Runeson, 2006). Compared to interviews, surveys are a less time consuming and more effective method of gathering data from subjects who are less experienced with the topic under research. Utilization of both methods can ensure follow up on confusions and more thorough answers (Ejvegård, 2009). For this research the method of surveying was utilized to gather knowledge and information from
Operators as well as Engineers to create a basis before conducting interviews.
2.2.2. Interviews
To gain a starting point for the thesis work a Non-structured interview was conducted with the manager of the process and an engineer who’ve both been working with the mentioned process since its startup in late-June 2019. The purpose of the interview was to find out and see where the company thought they needed improvements within, this resulted in an investigation within the Formation & Aging production process. The interview was constructed without any predefined questions rather than asking questions so that the subjects of the interview could elaborate on where issues and improvements are needed meanwhile taking notes of the important points and issues mentioned. Non-structured or sometimes referred to as an “Open” interview are carried out by allowing the person being interviewed steer and answer to what whom may prefer as it relates to the topic of discussion (Höst, Regnell, & Runeson, 2006). An interview of this kind might be seen as a conversation to the interviewee rather than an interview and classifies as qualitative (Saunders, Lewis, & Thornhill, 2012).
Once the specific area was selected a later step was to interview the current employees working in close contact with the production process. These interviews were carried out
with a few predefined questions to start off the interview. This to be able to keep the interview open but aimed at the areas of investigation which are the problems and bottlenecks the process was facing. The subjects of interview were questioned regarding the use of Lean and Six Sigma methods, the opportunities and issues they see. For proper data collection, the interviews were recorded with notes and/or audio recordings to capture the data (Ejvegård, 2009). Semi-structured interviews are known to have an elastic process which is a combination of the non-structured and structured approaches. The order of the Questions and how they might be formulated were adjusted throughout the interview to adjust to the interview situation or responses, this method classifies as qualitative (Saunders, Lewis, & Thornhill, 2012).
Another interview method mentioned by Saunders, Lewis and Thornhill (2012) that is used within research which can be conducted but for this case was not utilized are a structured interview. Structured interviews follow a strict and predefined process for the interview, where questions and order are created beforehand and followed in an exact way. The last-mentioned approach was not applied, the participants of the interviews had different roles within the company which required that the interviews had some adjustments towards their experiences.
2.2.3. Observations
To gain insight on how the process functions during production the method of
observing was utilized to see how the work is performed meanwhile detecting wastes and areas for improvement. Several iterations of observing were applied with different methods to gain more knowledge on how the processes was performed. The first occasion of observation was through the approach of Participant observing, this was together with the manager to get familiar with the department while they presented how the process works, the purpose of it, what resources are used and how it’s done by observing as well as asking operators questions throughout the process. These types of observations are according to Höst, Regnell & Runeson (2006) carried out by exposing yourself as an observer of another person performing a role, in this method the observer is not performing a role within the process but communicates with the persons in it. This approach opened up the possibility to ask questions during the observation and provided learning about the process. Notes and a few pictures were taken throughout the presentation to document observations.
Another method for capturing data can be through specific observations of the subject or object under research to complement previous observations. Through usage of technical tools and human interactions, one can generate data which correlates to certain situations. Therefore, it was suitable to conduct another observation as additional insight was required on how the operators perform their role within the production process. The second attempt at observing was also performed to decrease the amount of disturbance an observer asking questions cause, this time carried out through a Fully observing approach. The operators were observed from start of process to finish without being interrupted by the observer, additionally attempting to be as hidden as possible from the performer of the work (Höst, Regnell, & Runeson, 2006).
Lastly a third approach was applied were the observer were Fully participating, as the operators worked along the participant performing the process. This approach provided the freedom to try out different approaches to performing the tasks as a participant while focusing on performing the role rather than documenting observations. Höst, Regnell and Runeson (2006) also mentions one more approach which is a bit similar and can be utilized while conducting observations. Observing participants which are included in the process performing a role while exposing themselves as observing others performing roles within the process.
2.2.4. Measurements
Several measurements were made throughout this research to collect values specifically for Value Stream Mapping as well as to define the amount of time certain process steps require and timelines until certain production issues are resolved. Operators were undisturbed throughout time measurements for process steps and gave a visual signal for start and end of process steps. Process steps that were performed within machines already records values to provide which did not require any measurements, reason being that the machine specific process steps log different data points during charging/discharging every 1 second along with timestamp through a computer providing total elapsed time of process and start/end timestamp. To eliminate Gross
Errors that can be made through wrongfully reading instruments or mistakes in
documentation, the time settings of the computer were investigated to correlate with local time before utilizing its generated data (Höst, Regnell, & Runeson, 2006). Process steps that were not run through the computer were measured through timing with timers. To negate errors in timing, one person used the timer throughout all steps in a similar fashion. Errors are difficult to eliminate totally, therefore one should reduce the possibility for any factors contributing to errors according to Höst et. Al (2006). They also mention that within research purposes, measurements are used to connect numbers and expressions to attributes which aid in describing a phenomenon. In this case describing lead times or process speed to be presented in tables and maps. When performing measurements, the results gained can be classified in two categories, Direct measurements and Indirect measurements. A direct measurement can be when
measuring a length of an object, meanwhile an indirect measurement can be measuring speed where additional factors deduce the value of speed (Höst, Regnell, & Runeson, 2006). For measurements to be considered accurate, one must utilize the correct tools and practice caution while measuring. Errors taken into account within measurements are categorized by Höst et. al (2006) as following:
1. Gross Errors
a. These errors can be made through wrongfully reading instruments or mistakes in documentation.
2. Systematic Errors
a. These are constantly occurring and can be caused by constant disturbances to the instrument.
3. Temporary Errors
2.2.5. Literature study
With the use of literature studies, the researcher can gain knowledge from other researchers performed studies, this insight can be used to connect preexisting research with current ongoing study. Searching for existing knowledge can prevent a researcher from conducting research that would lead to existing knowledge. Therefore, it is critical that researchers present sources through citation for readers to be able to understand the research starting points (Höst, Regnell, & Runeson, 2006). The purpose of literature studying within this work is to complement the findings and analyses within the case study to create more room for generalization and confirming of conclusions through a scientific basis.
Literature cited within this study were collected through and provided by multiple sources. Books were accessed through Mälardalen University Library, Västerås City Library or Purchased. Scientific articles were accessed through Databases with access though Mälardalen University such as Emerald Insight, ResearchGate and
ScienceDirect. During research for literature keywords were used, these included: Lean, Six Sigma, In-Process Quality Control & Quality Control. Searching for literature with the keywords revealed a mass number of books and specifically articles, for these certain criteria were set to decrease the amounts. Articles published before 2010 were dismissed, books had no limitations on their publishing year and were including both Swedish and English. Selection of literature presented through searches were carried out by first applying the criteria mentioned as filters, thereafter, reading to find studies that apply or integrate Lean and Six Sigma within the work that complement each other. If either of concepts were not applied the literature was selected based upon their
inclusion of in-process quality control or description of Lean Six Sigma tools. Books used within the research were selected as they had been used by lecturers in previous university classes, been recommended by them or cited within other scientific articles.
2.3. Data Analysis
As data was collected for this research, methods to analyse such data has to be applied so that it can be presented or used. Data can be analysed in different ways but for data consisting of numbers it is accurate to analyse through an computer software which can provide an visual output (Höst, Regnell, & Runeson, 2006). Data collected from
measurements such as time were presented through tables, graphs and value stream maps. Data in the form of words which are gathered from interviews, surveys and observations can be analysed in several approaches. Interviews can be transcribed if recorded and surveys containing options for answers can be converted into statistics (Höst, Regnell, & Runeson, 2006).
For the research, collected data was also analysed in conjunction with the collected theory based on the varying topics to find connections and disconnections. With the reasoning to gain more generalizable findings but to also verify correct application of methods utilized.
2.4. Validity & Reliability
The terms Validity and Reliability within research studies specifies and exposes the quality of conducted research.
2.4.1. Validity
When research is conducted, the term validity correlates to the accuracy of gathering and utilizing correct data that is accurate to the research scope (Ejvegård, 2009). Methods utilized within a research will expose high or low validity, using one method to later find out within the research that the data gathered was incorrect proves low validity (Höst, Regnell, & Runeson, 2006). To reach for high validity the methods of case studying paired with literature study was conducted for this research. Further on data that was generated within the study were examined with the supervisor, managers and operators to ensure that correct data was utilized.
Triangulation can be applied for methods to increase validity, meaning that the researcher studies the object through different methods (Ejvegård, 2009). For this research triangulation was applied by conducting surveys, interviews and observations.
2.4.2. Reliability
The term contextualizes the reliability and usability of gathered data through a measuring instrument, which also applies to the unit of expression (Ejvegård, 2009). High reliability for measurements can be achieved when the measuring instrument or method can produce the same result on multiple attempts. For example, if one measures a distance then the measured length and unit of expression must be the same on
multiple attempts. This was applied to the study by measuring all process steps in multiple attempts with different operators, this would expose if there are any large differences in how the process might be performed with other operators or at different times during other days. Data gathered from machines were in abundance from earlier and recent runs with same procedure.
Reliability applies also to the analysis of data, presenting both the data collected and the analysis to the research candidates can expose misunderstandings or biases in candidate selection (Höst, Regnell, & Runeson, 2006). Therefore, documentation and analysis from interviews, observations and measurements were presented to different candidates from the company where they were collected and repeated in adjusted approaches.
3. THEORETICAL REFERENCE FRAMEWORK
This section describes the theoretical works that are used for investigating and answering the questions or problem statements researched within this thesis.
The primary sources researched for theories regarding Lean and Six Sigma was acquired from the well-known works from Liker (2009) and Pyzdek & Keller (2009). The secondary sources either cites works from the primary sources or were cited within the works by primary sources.
3.1. Lean
3.1.1. Toyota Production System
Toyota's successful production system has throughout the years inspired many people and businesses around the world. Countless companies are nowadays choosing to emulate the Toyota production system and all that it implies to create production of excellence. For researchers meanwhile, it is a fundamental area for research on how and why it creates excellence within production as well as how it can be applied in different cases.
3.1.2. 7+1 Wastes (Muda)
As mentioned, the purpose of Lean and its improvement work within a production company is to eliminate “Muda”. Waste drains companies as it increases their lead times, increases expenses and damages their competitive edge. Muda can be defined as many different things, but within Lean philosophy it has been broken down to 7 main wastes and 1 additional waste (The 8th waste). These will be crucial to identifying wastes within this study and how to define them, are they value adding or non-value adding? This question can be asked continuously, Liker (2009) defined the both as, value adding being work that through the customer eyes adds value to their requested product. An example of a value adding moment within a process can be mounting a part onto the product, but the non-value adding moment can be when the operator walks across the work floor to acquire the tool for the mounting. Identifying Non-value adding processes are not bound to only production, it can also be found within Administration and other non-production specific work. Muda was utilized in this study to categorize and identify wastes within our case study. Liker (2009) defines the 7 + 1 wastes as mentioned below.
1. Overproduction
a. Relates to producing additional parts and products which are in no need to fulfill current customer orders or producing products without confirmed orders from a customer (Liker, 2009). The waste generates increased logistic costs regarding labor, storage and transportation.
2. Waiting
a. Means having either products or staff in idle states awaiting continuation of production. This can be operators monitoring a process waiting for their next manual intervention or when operators are not able to perform any work due to bottlenecks within the production.
3. Transportation
a. Correlates to work in process (WIP) parts and products movement within the production factory, transportation between facilities or movement of
material from storage. 4. Over processing
a. Producing products through inefficient methods which can create defects and increased process times. This also includes producing better quality than customer specifications (Liker, 2009).
5. Inventory
a. Abundance of required materials, parts and products to fulfill customer orders are considered as a waste when they cause increased lead times, logistic requirements and defect generation. Liker (2009) also describe the underlying issues it creates as it can hide problems within lead times for production, purchasing and maintenance.
6. Motion
a. Inefficient workflows for staff lead to increased production times. Motion can be defined as searching for tools, walking in-between work moments or collecting work in process from other stations.
7. Defects
a. Producing defective products and parts which leads to additional resources spent on inspecting, correcting, repairing or scrapping products.
8. Non-utilized talent
a. Letting existing competence, knowledge and creativity of staff go to waste leads to minimized opportunities for growth.
3.1.3. Kaizen
“Kaizen” is a Japanese term that translates into the process that is one of key success factors for lean sustainability, continual improvement. The process for Kaizen events is carried out through minimal and extensive efforts to eliminate wastes and create value through improvement. Almost anything that is carried out to reach some kind of improvement can be included in Kaizen. Moving a tool from one place to another for minimization of motion or purchasing a new set of tools for a process to replace worn out ones can both be seen as Kaizen. Sustainability is key for continual improvement as the efforts teach practitioners the skill of working effectively in minimal groups to find solutions, document and improve processes, collect data, analyze data and practice autonomy (Pyzdek & Keller, 2009). The importance of continual improvement is that it reaches all levels of management as well as employees, teaching them valuable skills for collective decision making and implementation. Continual improvement is required to be sustain on a daily basis for fulfillment of the philosophy of TPS (Pyzdek & Keller, 2009). Kaizen should always be utilized, specifically within newly found companies as it can be an effective tool to grow rapidly.
3.1.4. 5 S
A crucial part of Lean methodology is visualization, through this one can expose as well as understand certain things in more depth. 5S is one of these tools that
complements Lean systems to achieve visual control and standardization. On a shallow level 5S might be explained as keeping workspaces clean and organized through an iteration of steps. The tools are one of continuous improvement nature, workspaces should continuously be standardized to make sure it’s cleaned daily, tools are placed in a manner that creates effective flow for the operators work and maintenance. To create effectiveness for the operator’s detection of deviations from sustaining 5S standard, visual management can be utilized to expose deviations through labeling, marking, color coding or boards. This tool requires commitment on all company levels, starting from higher management down to operators. Without this commitment the “sustain” part of 5S will suffer and therefore will cause the actions in earlier S’s be in vain. Liker (200) defined the 5S’s with short descriptions, this can be found in figure 1. Original figure was in Swedish which has been translated to English.
Figure 1: 5S translated from Swedish (Liker, 2009)
3.1.5. Value Stream Mapping
Visualization techniques such as value stream mapping are effective means to create holistic view and insight to how work within a current layout flows, wastes can be exposed with the use of this tool to be eliminated for a future state. Value stream mapping is therefore a proven practical and effective tool to visualize these disconnects and inefficiencies on how work is performed (Martin & Osterling, 2014). For
application to production, Value Stream Mapping is utilized to visualize information flow, material flow and lead time through a company, from incoming material to finished product for transport to customer (Liker, 2009). Within the VSM, Lead time is sought out for individual steps where value adding process times and non-value adding process times are calculated to provide metrics. The metrics calculated for all moments throughout the production are at the end utilized to define Production Lead Time, Value Adding Process Time and Non-Value Adding Process Time.
Sort • Clear out rarely used
items by red tagging
Set in order • Organize and label a
place for each thing.
Shine • Clean it Standardize
• Create rules to maintain the first 3
S's Sustain • Use regular management audits
Lead Time (L/T) refers to the elapsed time for one piece to go through a process or the
value stream as a whole, start to finish (Rother & Shook, 1999).
Cycle Time (C/T) refers to the elapsed time during a process, how often a product can
be completed by a process within the production (Rother & Shook, 1999).
Changeover Time (C/O) refers to the time it requires to spend on preparing a tool or
machine for processing (Rother & Shook, 1999).
Value Added Time (VA) refers to the moments within production where the product is
transformed in a manner that the customer is willing to pay for (Rother & Shook, 1999).
Non-Value Added Time (NVA) on the other hand refers to the moments within
production which the customer is not willing to pay for.
3.1.6. Spaghetti Chart
To visualize physical work motion and flow, spaghetti charts are utilized to identify wastes regarding motion in current states. The chart is designed through mapping the routes a product and the personnel involved travels to fulfill the production or process. Commonly it is structured by following an operator’s movements through the work floor, allowing it to be the visualizer of the product movement. The current state chart is later investigated to identify where changes in the layout can be made to create a
“Leaner “layout (Pyzdek & Keller, 2009).
3.2. Six Sigma 3.2.1. Motorola
During the 1970s the Motorola company were facing extinctive quality issues with their TV production which forced them to hand over a factory to a Japanese firm. This newly implemented management quickly created a change stretching from low-level to top-level. The changes resulted in the factory producing an impressively 1/20th the amount of defect TV sets compared to previous management. With this result it was also proven that utilizing existing resources can create a change as positive for business as declared, all without increasing spending and costs (Pyzdek & Keller, 2009). The following years came with continued success for both the company and responsible management. The practices and principles that were applied by Motorola for Six Sigma were built of previous existing quality management structures. Its basis is data in terms of statistics and facts which are inputs for analysis work. It also requires continual improvement culture within the company to minimize bottlenecks in performing Six Sigma actions within the organization (Smetkowska & Mrugalska, 2018). But the critical difference for the success of Six Sigma were the adjusted structure to achieve increased control and improvement efforts (Schroeder, Linderman, Liedtke, & Choo, 2007).
The Six Sigma model and its methodology are structured to create a disciplined approach which utilized can achieve process improvement in combination with increased quality and low variability within the process (Salah, Rahim, & Carretero, 2010). The structured approach is achieved by the “DMAIC” (Define, Measure, Analyze, Improve and Control) or “DMADV” (Define, Measure, Analyze, Design, Verify) which are applied for different stages within the product or services stage in development. DMADV is utilized while at the early stages of development to ensure Six Sigma quality from start while DMAIC is employed at later stages of development to incorporate Six Sigma within an existing product or service (Salah, Rahim, & Carretero, 2010).
3.2.2. DMAIC
Within Six Sigma activities, a model referred to as “DMAIC” is deployed for projects to provide structured framework for the approach and execution of Six Sigma. The DMAIC framework includes phases for the project that are predefined with purpose and criteria for fulfillment before entering new phases, Pyzdek & Keller (2009) refers to the framework as creating a “Gated Process” which in itself implements higher control of the project.
The DMAIC phases are structured and followed in a cycle fashion which always starts with the define phase. The previously mention DMAIC phases are described by Pyzdek & Keller (2009) respectively as following:
Figure 4: Overview of DMAIC (Pyzdek & Keller, 2009)
Creating a new system through DMAIC will require control of the systems
functionality, for example Material Requirements Planning (MRP) is a system that responsible of ensuring materials within production are in stock to be able to create products (Pyzdek & Keller, 2009).
3.2.3. Control Plan
Though its origins stem from ISO/TS 16949, a control plan is a tool often utilized within quality managements systems such as Six Sigma. The purpose for creating, updating and sustaining a control plan is to document and describe the factors as well as the specifications which the product must fulfill. The contents of a control plan will aid the production through detailing the requirements and actions needed in each
production step to maintain control of the output. The Control plan will include the control methods used within the production as well as reaction plans to out of specification products. (Automotive Industry Action Group, 2008)
As the Control Plan is a living document it is crucial to implement as early as possible, a control plan can be adjusted to the level a product is at in terms of development. With the first stage being the prototype stage, where the control plan can evolve along the product development. An example of a layout for Control plan document is presented within the attachments (See 8.1).
3.2.4. Failure Mode and Effect Analysis (FMEA)
FMEA is another tool that in later years have been utilized and incorporated within Six Sigma, before that is has been a staple within ISO standards. The technique originates though from the aerospace industry and was used to identify possible failures, their causes and what effect they can have on the system or a person as well as define these along the process (Pyzdek & Keller, 2009). Actions such as preventive or causing ones are also documented within an FMEA. The tool can be seen as an in-depth risk
assessment of larger topics, the technique is utilized in today’s market to investigate systems, designs, processes or services. A properly performed FMEA can also assist in eliminating failures, errors or problems. Within a FMEA all identified problems and risks are graded based on their effects and probabilities. Performing a FMEA requires a systematic approach to increase the effectivity of the technique (Liu, 2016). A layout for an FMEA document can be structured as the example within the attachments (See 8.2).
3.3. Lean Six Sigma
The integration of Lean Six Sigma can be structured in multiple approaches as they are based upon the company and its business. But the key to being able to integrate them are the similarities they share and their tools ability to complement each other. (Santos, 2019)
3.3.1. Similarities
Lean and Six Sigma are inherently two different concepts which standalone can provide great benefits to a company depending on their core business and provided
services/products. As Lean and Six Sigma was originally seen as a more
manufacturing-based concepts it is said to be more applicable to a certain sectors of businesses, but they’ve both proven to be applicable to non-manufacturing businesses as their methods, tools and principals can be adjusted to match almost any desired business. All though both concepts are adjustable towards different businesses, their focus area are the customers and providing quality products/services towards them which fulfill their needs or specifications (Santos, 2019).
Other similarities these two concepts share is the critical need for management involvement as well as dedicated cross functional teams to support and sustain the projects (Santos, 2019).
3.3.2. Differences
As stated, there are many similarities between the two concepts which opens up the possibility of utilizing them to complement each other. But since Lean and Six Sigma are two different concepts there are also differences which separate them from each other. The main difference is the required knowledge and training to utilize the concepts effectively with Six Sigma being the concept which require greater amount of training as well as higher amounts of investments. The difference in required training to utilize the concepts are mostly based on the fact that Six Sigma is structured through
frameworks such as DMAIC, Lean on the other hand does not require a framework for implementation (Santos, 2019).
As mentioned earlier, the differences also lie in focuses beyond the customer. Lean focuses on reducing waste, foremost regarding to minimizing lead times through streamlining (Santos, 2019). Six Sigma focuses on reducing the amount of variability within processes, in return it can create less defect generation which could increase capacity (Schroeder, Linderman, Liedtke, & Choo, 2007).
4. Case Study
This section describes the case study carried out at Northvolt and the work within their process Formation & Ageing. A current state and a future state are presented throughout the chapter.
4.1. Presentation of Company
Picture: Northvolt by Tengbom
Northvolt AB (NV) is a battery manufacturing company founded in 2016 with a mission to create the industry greenest Li-ion batteries through an environmentally friendly, sustainable and ethical approach. With backing and investments ranging over 1 billion euros the future for NV has since its founding been a bright one. One of the early projects for the company is the construction and finalizing of the Northvolt Labs entity including the NV Labs battery manufacturing factory, Research & Design Laboratory and Performance & Life facility all located in Finnslätten, Västerås, Sweden. The goal for these early projects is to qualify and industrialize their products and process for expansion with the collaboration of their present and future customers. Within the R&D laboratory designs for Li-ion batteries are developed with customers to be validated within the nearby located P&L facility. The final process for producing Li-ion batteries before delivery to customer or for Performance & Life Testing is a process known as Formation & Aging, a process which stabilizes and activates the battery cells through specialized charging processes.
Formation & Aging as a process requires small amount of manual hands-on work on the individual cells. The cells are within each process type processed within either a Formation Machine or Aging Chamber. In-between these processes inspections are made to document Capacity, Open-Circuit Voltage (OCV) and Alternating Current Internal Resistance (AC-IR) values, these values are compared to product specification to determine performance quality of each produced cell excluding Visual, Weight and Thickness qualities. The remaining qualities of the cell are inspected to detect and document Visual defects or damages, Loss of Weight through electrolyte leakage or other factors and lastly Swelling through creation of gas within each cell. Each of these inspections carried out throughout the production vary, Incoming inspection handle all qualities except Capacity, In-process inspections handle all qualities except Weight and Thickness, Outgoing inspection handles all qualities in depth.
4.2. Current State: Process flow and Quality Control
In the case study of Formation & Aging, the first focus is to explain the production process and its included quality control specifically through the inspections carried out. Information for the description of this production process was gathered through observing the process in three different occasions, measuring the time for execution of process steps twice,
researching documents related to the process steps provided by the company, interviewing as well as surveying managers, engineers and operators working with the process. The production process itself in short is what realizes and documents the capacity of
manufactured cells. These cells are produced with demands which require high standards regarding safety and quality. Any deviated will be sent for internal testing and any defect cell will be deactivated then scrapped. The focus since the process installation and startup in production late June 2019 has been to meet predefined standards during the production of early prototypes, these correlate to customer as well as regulatory standards. Since the production processes are in an adolescent state, production disturbances are prevalent which impacts the product quality and efficiency of the process.
As the production is of prototype character (Producing and verifying products for coming mass production) and the production is in its adolescence the company implemented quality inspections on all products passing through the production process, which means all quality inspections from incoming, in-process and outgoing are performed on all produced cells. This provides the company with increased amounts of data and traceability in regard to how the processes affect the cell. A Failure Mode and Effect Analysis (FMEA) was performed before the startup of the production by process engineers within the company to identify the different levels of risks throughout the process. The results from the FMEA strengthened the productions need for in-process quality inspections to increase early detection of defective cells as they can pose high risk. Worst case scenario for a cell is a thermal
runaway which causes intense heat and fire generation therefore, detection of defect cells is critical at the earliest stage possible. Regarding process efficiency, the implementation of inspections is decreasing efficiency as products move through production in a slower rate. For the production to operate with excellence improvements regarding execution of quality control and the productions overall processes was requested to be visualized, investigated and hopefully improved. This request goes in hand with the question formulations created and the scope of the research as it pertains to practical quality control and process
optimization with emphasis on the performance of quality control and efficiency within the inspection process.
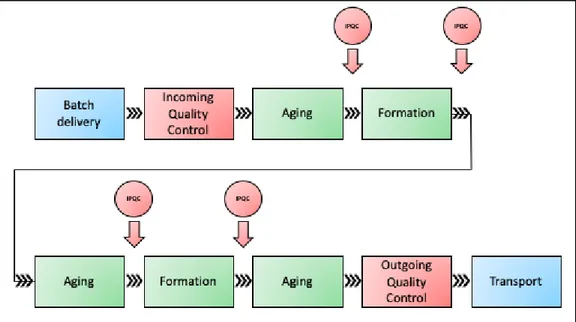
4.2.1. Process breakdown
The process of Formation & Ageing is performed as presented below with In-process quality control inspections carried out after each intermediate step within the process. The process is visualized with colour to differentiate Quality Control (Red), Process Steps (Green) and Transports (Blue). The overview was created and based upon documents provided by the company.
Batch Delivery
As the company’s production for cell assembly and Formation & Ageing are being performed in different facilities, the production part for our case starts once assembled cells arrives at the facility where Formation & Ageing is performed, the first step here is to receive the batch transported by their in-house logistics team and unload them into the facility for incoming quality inspection. Through interview of a manager it was explained that deliveries of new cells occur two up to three times per week. A forecast is provided from the Cell Assembly department for each work order to the manager, with intermediate updates on single deliveries throughout the work order which is informed to the operators and manager. The forecasts are on a weekly basis where deliveries are predicted, once delivery dates arrive the status are updated with time forecast if the delivery will be during the afternoon or postponed for early delivery following day. For the deliveries, cells are batched into 20 assembled cells per delivery. The number of cells per batch can be adjusted in cases of lower yield rate from the cell assembly department. Documents acquired from the company’s engineers emphasizes that these batched cells are all meant to follow the same procedure and timeline when processing through Formation & Aging, this implies all cells in a single batch have to be in the same stages until production completion. Therefore, all following process steps and their respective time measurements done for the value stream map calculations are based and performed on a standard delivery of 20 cells.
Incoming Quality Control (IQC)
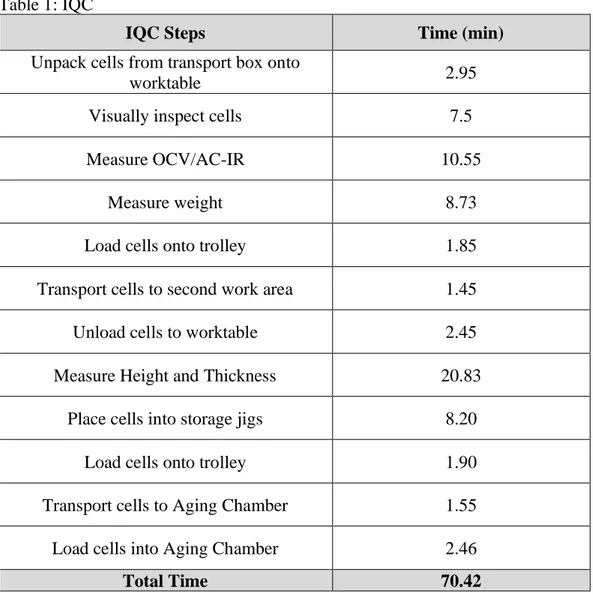
When the assembled and pre-charged cells arrive at the facility from the cell assembly department, they are inspected, documented and lastly prepared for processing within the shortest timeframe possible since delivery. Through observation of the workflow within the incoming quality control inspection, the operators measure the cells first for Open-Circuit Voltage and Alternating Current Internal Resistance values. If the cells pass the initial measurement they are continued for Thickness, Height and Weight measurements by transporting them to another room within the facility. Thickness measurements are performed with digital calipers and the weight through a precision scale. Throughout the process of measuring, the cells were also visually inspected for any defects stemming from transport, production or handling. Once the operators are finished the cells are placed into a respective holder and prepared for the Aging process. As the incoming quality inspection at the start of production process are not deemed as adding value to the product or the customers, then they will not be seen as additional value adding processes within the Value Stream Map. Its process times are still measured and added as Non-Value-Added Time.
Table 1: IQC
IQC Steps Time (min)
Unpack cells from transport box onto
worktable 2.95
Visually inspect cells 7.5
Measure OCV/AC-IR 10.55
Measure weight 8.73
Load cells onto trolley 1.85
Transport cells to second work area 1.45
Unload cells to worktable 2.45
Measure Height and Thickness 20.83
Place cells into storage jigs 8.20
Load cells onto trolley 1.90
Transport cells to Aging Chamber 1.55
Load cells into Aging Chamber 2.46
Total Time 70.42
Aging
The process of Ageing is performed through placing the cells in respective single cell holders known as “Storage Jigs” and then placing them within an Aging Chamber. The process is very simplistic as the cells are placed and stored for a specific time of 12 hours within a controlled temperature chamber. The aging process is repeated multiple times throughout the production with differing specifications regarding temperature. The process step is performed before first Formation, after first Formation, before second formation and lastly after second formation. The cycle time for the aging process does not vary depending on cell amount as the cycle time refers to 1 cell and the chamber can store upwards to 60 cells simultaneously for aging.
Table 2: Aging
Aging Steps Time (min)
Changeover times for Aging are implemented within previous or upcoming steps as quality control inspections are finished when the cells are placed within the Aging Chamber. The chambers are themselves set to certain specifications which are not adjusted within production.
In-Process Quality Control (IPQC)
The inspections the company implemented and performs throughout the production are somewhat minimal in comparison to the incoming and outgoing. In-between the aging and formation processes the values for Open-Circuit Voltage and Alternating Current Internal Resistance are measured on three separate occasions by the operators. As described by an engineer through an interview these values measured can describe the performance of the assembled cell and the effect of the Aging and Formation processes. A cell can be defect within itself which is blind to the human eye but can be exposed through these inspections. Cells that present alarming values or out of specifications values are either rejected or continued for internal testing by engineers.
As the in-process quality inspection within the production are not deemed as adding value to the product or the customers, then they will not be seen as additional value adding processes within the Value Stream Map. Its process times are still measured and added as Non-Value-Added Time in-between the Formation & Aging process steps. Table 3: In-Process Quality Control
IPQC Steps Time (min)
Unload cells to worktable 2.70
Measure OCV/AC-IR 11.20
Total Time 13.90
Formation
After the first Aging process is finished and an in-process quality inspection is
performed, the process of Formation continues the cells production with a specialized charging and discharging pattern which is done in an uninterrupted and controlled machine. These patterns are created by the company’s engineers and provided to the operators to apply. For this process the cells are loaded into a tray which in turn is inserted into the Formation Machine. Once the cells are within the machine the operator can start the automated pattern from a computer station with a software that connects to the machine. During the ongoing process the operator will monitor the process through the software, but the operator is not locked to constant monitoring as they can be performing other tasks meanwhile the process is running. This being enabled by the software and machinery used for Formation having built in safety protections and stop mechanisms in case of disruptions or problems. The Formation process is carried out twice in-between aging processes with differing patterns. The cycle time for the formation process does not vary depending on cell amount as the cycle time refers to 1 cell and the machine can process 20 cells simultaneously.
Table 4: Formation
Formation Steps Time (min)
Remove cells from Aging chamber 2.55
IPQC 13.90
Switch cells from storage jigs into
formation tray 7.5
Insert tray into Formation machine 1.55 Prepare process pattern on computer 2.73
Formation 540
Remove cells from Formation Machine 1.45
IPQC 13.90
Place cells into storage jigs 8.26
Load cells onto trolley 1.91
Transport cells to Aging Chamber 1.62
Load cells into Aging Chamber 2.83
Total Time 598.20
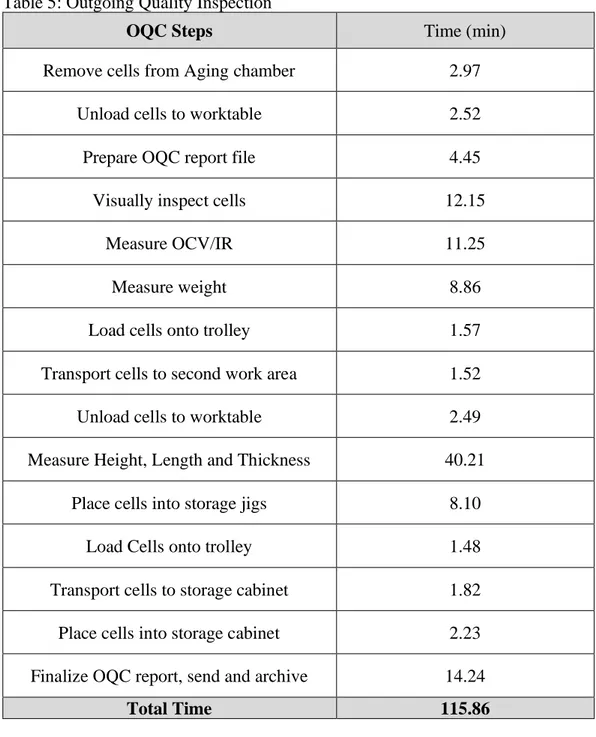
Outgoing Quality Control (OQC)
When cells have finished their production within Formation & Aging, they are thoroughly inspected before being either shipped to customer or to testing within the Northvolt facilities. The outgoing inspection incorporates the processes or qualities from incoming quality control and the IPQC with smaller additions.
The process starts by the operators unloading cells from the aging chamber and placing them on the first inspection table. There the cells are measured for OCV and IR,
thereafter they are weighed concluding the first part of the inspection. The cells are placed on a trolley for transport to the second inspection table placed within another room in the facility. The cells are then unloaded onto the second inspection table where they are measured for height and length, thereafter the cells thicknesses are measured through five-point measurements.
Once finished the cells are loaded back onto the trolley to be transported to the first inspection table where they are visually inspected and lastly placed in “Storage Jigs”, these are placed then within a battery storage cabinet. At this point the operator extracts the capacity data for each cell from the Formation process through the earlier generated data from second formation process, all measurements made within the outgoing quality inspection are collected within an inspection report. Time measurements for the process ends as the inspector’s work is completed. The quality department compare the
outgoing quality inspection results to production specifications, at this stage cells will be (if not earlier) defined for customer shipping, internal testing or scrapping.
Table 5: Outgoing Quality Inspection
OQC Steps Time (min)
Remove cells from Aging chamber 2.97
Unload cells to worktable 2.52
Prepare OQC report file 4.45
Visually inspect cells 12.15
Measure OCV/IR 11.25
Measure weight 8.86
Load cells onto trolley 1.57
Transport cells to second work area 1.52
Unload cells to worktable 2.49
Measure Height, Length and Thickness 40.21
Place cells into storage jigs 8.10
Load Cells onto trolley 1.48
Transport cells to storage cabinet 1.82 Place cells into storage cabinet 2.23 Finalize OQC report, send and archive 14.24
Transport
When cells have their defined destinations, the transports are carried out in differing procedures. Cells that are destined for customers are packaged by the operators into a specialized high security shipping box, the process for packaging cells into one of these boxes is simplistic and require no additional work other than placing the number of cells for shipment within it. On the other hand, cells that are destined for testing within the company aren’t shipped since the testing facility is the same facility as the
Formation & Aging process is placed within. The testing cells are handed over to the testing department as soon as the outgoing quality inspection is completed.
4.2.2. Deviations & Non-Conformities
Production disturbances, Product/Process Deviations and Product/Process Non-conformities are in the current state mostly reported to an internal quality department. Reports are made by operators once they experience issues within the production, these reports consist of description of issue, actions taken & if identifiable a root cause. Once the operator has sent their report, they continue their work and wait for follow up. These reports are followed up by a quality engineer within a one to two-day timeframe, their job is then to investigate how the issue has affected products or production with the help of the operator and the report. Reported open issues are closed and handled within a largely varying timeline. But through investigation of documents and reports made by operators as well as engineers the amount of issues reported regarding product cells in ongoing production are usually closed within a one to two-day timeline. 90% of reported issues from Formation & Aging regarding cells are later concluded to be continued in production but marked as internal cell, the remaining 10% are scrapped as can be seen through their yield rate for the production. As the quality of a cell is
negatively affected by prolonged wait times in-between processes, most cells which are concluded to have gained no negative effective of reported production issue are still marked as internal as they’ve deviated from the strict Formation & Aging procedure.
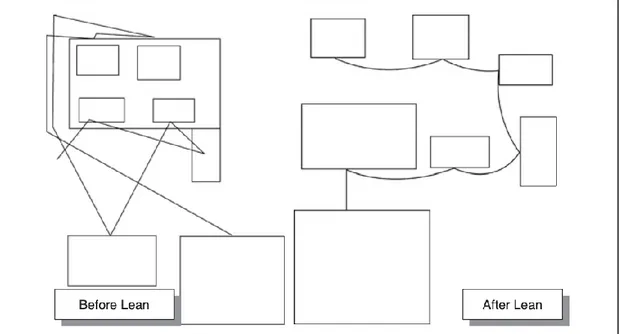
4.2.3. Spaghetti Chart (Quality Inspections)
The movement within the facility for the operators and the cells during the several quality inspections are presented below to visualize the inefficiencies in the workflow and work floor layout. The information gathered and needed to visualize for this chart were through observation of the process flow for the inspections with two operators performing the tasks. The chart is divided into the three different kind of inspections being carried out within the production process (See attachments for large view).
Figure 6: Spaghetti Chart – Quality Inspections (Amiin Bihi, 2020)
The incoming quality inspection is carried out as soon as the batch arrives at the
facility. The technician starts the process by unloading the cells onto the first worktable (2) to perform the first measurements. Then the technician transports the cells to the second worktable (3) to complete the remaining measurements. Once finished storage jigs are picked up from the storage location (7) to use with the cells on the worktable (3). After they are finished with the jigs, they transport the cells to the Aging machine (4).
The outgoing quality inspection shares close to the same process flow with start and end point from the Aging Machine (4).
The quality inspections carried out in-process are only performed on the first worktable (2) and the cells are taken out from the Formation Machine (5) and after inspection placed within the Aging Machine (4).
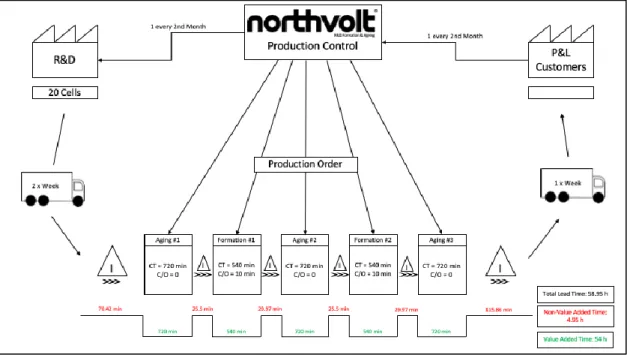
4.2.4. Current State Value Stream Map
The Value Stream Map presented below describes the products flow starting from received delivery until finalized product for shipment to customer. Within the value stream map all the lead time for the production is presented through the collection and measurements of time for process flows, information flows and transports required to produce the product. The value stream map is based upon a standard batch amount of 20 cells as previously mentioned (See attachments for large view).
Figure 7: Value Stream Map of Current State (Amiin Bihi, 2020)
Calculations for Figure 7 present the Total Lead Time, Non-Value Added Time and the Value Added Time for the Value Stream:
• Total Lead Time = Non-Value Added Time + Value Added Time = 3537.22 min
• Non-Value Added Time = Total Lead Time – Value Added Time = 297.22 min
4.3. Identified wastes and improvement proposals 4.3.1. Identified Wastes
Motion
Through the lens of Lean workflow, the separated workstation does not prove worthy of Lean status as they increase the process time for the incoming and outgoing quality inspections. The layout creates additional opportunities for defect products as they are moved in-between rooms which create more room for product damages created by human error. Additionally, the placement of Jig storage which is also separated from either workstation creates more moments where the employee needs to move around the facility to fulfil their task. A critical part of 5S is to also evaluate placements of tools required for processes, this creates to believe an improvement through 5S is possible.
Transport
As mentioned in this case the placement of production process includes additional transport of the product before it is finalized and transported to the customer. This increases transportation costs, opportunities for transport damages and longer lead time to finished product. For this issue a change is out of scope as it is not cost effective nor viable at this stage as it would entail a needed investment by the company to move the machinery to another facility and interruption of ongoing production which is not of interest to the company.
Inventory
When the destinations of produced cells are not decided before the finalization of the cell, the waste that is created is increased inventory of products which require logistic handling and regular interventions to measure OCV/AC-IR to monitor charge levels and if any cells might have suffered damages within the storage. Resources are wasted here as it could be utilized for other means through better handling of inventory and shipping.
Waiting
Another apparent waste within the process as a whole is the moments where waiting or idleness occurs. As the quality inspections can identify damages or leakages that the cells might have, the actions needed to be taken when that occurs are not structured and clear for the technician. This creates increased times for handling deviations within the quality inspections and creates waiting times as response from another department is required to decide if the cell should be rejected, scrapped or reworked. This is where Six Sigma techniques could be of great help.
The waiting that occurs while monitoring the process is in this case is an opportunity and therefore needs to be utilized to create value, this could be made through kaizen. The process requires low amount of monitoring as the systems can react and alarm the technician, therefore it is a good opportunity to not let this time go to waste for
monitoring more than required.
The issues mentioned within inventory is also affecting the packaging and shipping stages as they cannot perform their tasks before the destinations or selections of cells are not completed. In this case they will be in an idle state awaiting confirmation of what to pack and ship where.