Banking soundness in the
European Union
- The impact of the capital requirements regulation
MASTER THESIS WITHIN: Business administration NUMBER OF CREDITS: 30 hp
PROGRAMME OF STUDY: Civilekonom
AUTHORS: Ida Bergendorff 930404
Maria Osbäck 821102
Acknowledgments
We would like to thank and acknowledge both our supervisor and our seminar group, who have helped and supported us during this study with their valuable input and feedback.
Master Thesis - Degree Project in Business Administration
Title: Banking soundness in Europe – The impact of the capital requirements regulation Authors: Ida Bergendorff & Maria Osbäck
Date: 2015-05-22
Key terms: CAMELS, capital requirements, European Union, bank stability.
Abstract
Purpose – The purpose of the report is to investigate the impact of the capital requirements
launched by the European Commission in the CRD IV package, using accounting proxies for the CAMELS rating system. By using financial ratios as proxies for the CAMELS variables (capital, assets, management, earnings, liquidity and sensitivity), changes in the financial soundness in Europe can be detected and the impact of the new capital requirements can be understood.
Research design – The study is a quantitative research, as the data was collected from the
European Union’s 30 largest banks’ annual reports and it is therefore secondary data. The data was used in order to construct financial ratios to act as accounting proxies for the CAMEL variables, which have been used in order to construct a rating of the banks. These ratios were calculated for a five-year period, 2011-2015, in order to detect changes and give an indication of how the banks state and stability have developed during the timeframe.
Findings – The findings show that there has been clear changes in the banking sector during the
observe time span. The findings indicate a clear increase in capital ratios in the banks, due to the new capital requirements. The findings also show how profitability and liquidity is still too low to indicate a fully sound banking sector, but still may be attributable to the recent recession.
Contribution – The authors found indications that while the trend and over all well-being in the
banking sector is good there is still room for further improvement in both leverage and liquidity ratios as well as profitability.
Value – The sample shows that the have been improvements in the soundness in the banking
sector, but the results also indicated that capital requirements by itself is not enough to create stability and increased well-being for the banking sector. Several areas of importance to bank stability are still in need of improvement.
1.
Introduction ... 1
1.1 Background ... 1 1.2 Problem discussion ... 4 1.3 Purpose ... 52.
Frame of reference ... 6
2.1 Literature review ... 62.1.1 Development on the EU-level ... 6
2.1.2 CAMELS rating system ... 8
2.2 Theoretical framework ... 9 2.2.1 Deposit Insurance ... 9 2.2.2 Moral Hazard ... 11 2.2.3 Capital Requirements ... 12
3.
Method ... 15
3.1 Research Design ... 153.2 CAMELS measurements and variable selection ... 16
3.2.1 Capital ... 16
3.2.2 Assets ... 17
3.2.2.1 Total loans outstanding to total assets ... 17
3.2.2.2 Impaired loans to total loans outstanding ... 18
3.2.3 Management ... 18
3.2.4 Earnings ... 19
3.2.4.1 Return on Equity ... 19
3.2.4.2 Return on Asset ... 20
3.2.5 Liquidity ... 20
3.2.5.1 Loan to Deposit Ratio ... 20
3.2.5.2 Debt to Asset Ratio ... 21
3.2.6 Size... 21
4.
Empirical findings ... 24
4.1 Capital ... 24 4.2 Assets ... 24 4.3 Management ... 25 4.4 Earnings ... 264.6 Size... 28
5.
Analysis ... 30
5.1 Development of the banking sector ... 30
5.2 CAMELS ratings ... 33 5.2.1 Capital ... 34 5.2.2 Assets ... 34 5.2.3 Management ... 36 5.2.4 Earnings ... 36 5.2.5 Liquidity ... 37 5.2.6 Size... 38
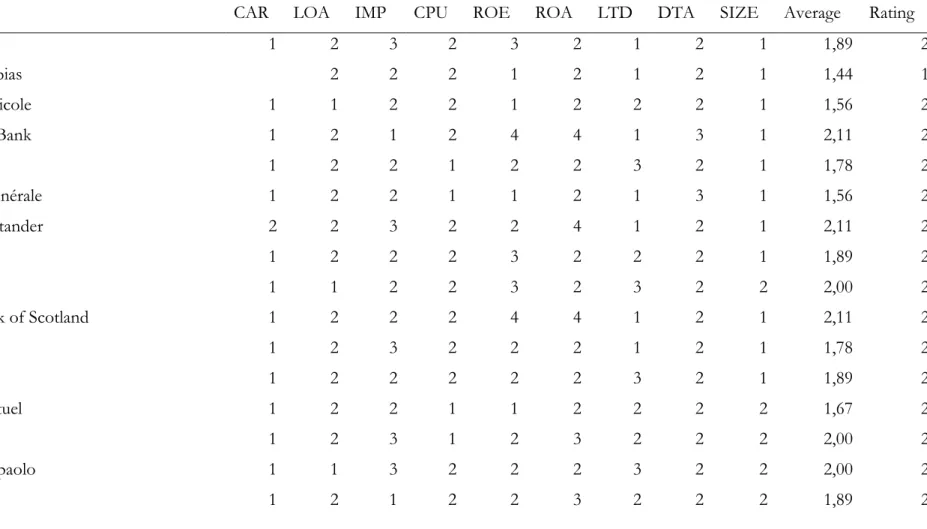
5.2.7 Final CAMELS rating ... 39
6.
Conclusion ... 42
7.
Discussion ... 43
Tables
Table 1 - CAMELS measurements and variable selection ... 23
Table 2 - Capital, Assets & Management ... 26
Table 3 - Earnings, Liquidity & Size ... 29
Table 4 - CAMELS ratings ... 40
Appendices
Appendix 1 - List of G-SIBS ... 1
Appendix 2 - CAR ... 2
Appendix 3 - LOA ... 3
Appendix 4 - IMP ... 5
Appendix 5 - CPU ... 7
Appendix 6 - ROE ... 8
Appendix 7 - ROA ... 10
Appendix 8 - LTD ... 12
Appendix 9 - DTA ... 14
Appendix 10 - SIZE ... 15
1. Introduction
______________________________________________________________________
In this section the authors will introduce the background and the reasons for the current regulation of the banking industry concerning capital requirements. In the problem section the discussion concerns the problem
of rating systems of banks and if the current regulation is enough to improve the banks stability, thereafter the purpose will be presented.
______________________________________________________________________
1.1 Background
The magnitude of a crisis in today's financial sector is larger than ever, this due to the ripple effect caused by the problem of contagion; most aspects in today's financial sector is interrelated (King, 2013). The finance world is more interdependent than ever, with increased and wider banking activities that connect most financial institutions in the world (Gofman, 2017). This phenomenon can be seen by the most recent financial crisis that began in 2007 that affected the entire global economy (Prabha & Whilborg, 2014). The financial crisis led to a renewed interest in how a crisis of this scale was permitted to happen in the first place and what type of regulation that could have been implemented in order to prevent it (Klomp & De Haan, 2012). This interest especially concerned the banking sector that received a lot of criticism in the way they conducted their operations. Pennacchi (2005) describes the need for bank regulation as a safety net to protect depositor and to avoid other monetary consequences. The traditional regulations that banks are subjected to are deposit insurance and capital requirements. Deposit insurance can be guaranteed by the government in the case of a bank failure in order to protect the depositors from losses, while capital regulations are put in place to increase the banks own responsibility in case of a crisis (Cooper & Ross, 2002). These two types of regulations have been the subjects of discussion for decades but there is continuous interest in the area both from researchers and legislators. Capital requirements have been a well-used tool to decrease the risk in the banking sector, it has been seen as the instrument to lessen the moral hazard created by deposit insurance, and have thus gained even more attention since the recent crisis. Although capital requirements might decrease the ability to raise money today,
it is a valuable tool to diminish the effects of asset shocks in times of crisis (Diamond & Rajan, 2000).
The discussion regarding the effect of regulations was further spurred by the new capital requirements, both from the Basel Committee on Banking Supervision (BCBS), at the request from the G-201, as well as by the European Commission’s capital package, often referred to CRD IV package (Carbó-Valverde, Benink, Berglund, & Whilborg, 2015). The BCBS main task is to create frameworks for improving bank sensitivity in times of a recession. The committee had before the financial crisis in 2007 released the framework Basel II, but due to the crisis the framework had yet to show its outcomes. In 2010 the BCBS presented the new framework, Basel III, in which a new standard of global regulatory on capital was introduced, with the year of 2013 planned as the year of earliest implementation. By increasing the bank's capital reserve the Basel III aims to create a more stable market for banks that will be able to resist a future recession in a better way than previously done. The adoption of the Basel III framework increased the capital regulations for banks through three key principles: liquidity requirements, a leverage ratio, and stricter capital requirements. The liquidity and leverage requirements have not yet been fully implemented and will thus not be a part of this study.
The European Commission transposed the new framework from the BCBS in 2013, and launched it under the name CRD IV (The European Parliament, 2013). This package contains one regulation (No 575/2013) and one directive (2013/36/EU) with the aim of creating bank stability in the European Union. The European Commission transposed the Basel III framework and created the CRD IV package, this since the Basel accords are not directly applicable legislation (The European Parliament, 2013). Other aspects of the CRD IV package, than the capital requirements which is the focus of this study, concerns improving risk management and governance as well as strengthening banks’ transparency and financial disclosures (BCBS, 2011; European Parliament, 2013). The CRD IV package is not the only legislations that are of importance when understanding the need for capital requirements in the banking sector. The Commission updated its deposit insurance
1 The G20 members: Argentina, Australia, Brazil, Canada, China, France, Germany, India, Indonesia, Italy, Japan, Mexico, Russia, Saudi Arabia, South Africa, South Korea, Turkey, United Kingdom, United States and European Union.
regulation in 2014 with Directive 2014/49/EU on deposit guarantee schemes to protect depositors of credit institutions (The European Parliament, 2014). It maintained the earlier deposit protection of €100,000. The directive states that when resolving bank failures it shall be through the use of funds from the financial institutions and not through the taxpayers (The European Parliament, 2014).
With this increased level of banking regulation there have been a broad discussion of how to best measure the impact of the legislative action. A variety of monitor systems have been used in order to assess banks performance and overall condition. In Europe, stress test and Z score is often used in evaluating the soundness of the financial sector (Hogan, 2015). The European Banking Authority (EBA) is in charge of overseeing and ensuring the stability of the financial system in the European Union in order to identify any potential risks that could become future problems they launch stress tests to assess the strength of the financial sector (The European Parliament, 2013). While stress test are a valuable tool for the EBA to investigate any potential weaknesses in the financial system, the information needed are often out of reach for researchers, thus they have to resort to models whereas publicly available information is enough. This has led to the popularity of the z-score to evaluate the soundness of financial institutions. This method to identify firms that are on the verge of financial distress was developed by Altman in 1968. Through a five-factor model that employs financial measures he created a model that have become a widely popular tool to assess the stability among financial institutions (Uhde & Heimeshoff, 2009).
In the United States the CAMELS rating system is instead often used to assess financial institutions, both by regulators and researchers. The CAMELS rating system developed by the Federal Deposit Insurance Corporation (FDIC) in the United States is designed to assess banks performance and overall condition through investigating six key measurements; capital, assets, management, earnings, liquidity and sensitivity (Cole & White, 2012). Officially it is called Uniform Financial Institutions Rating System (UFIRS), and it was developed in 1979 and was then only referred to as the CAMEL rating system. In 1996 the sixth component of sensitivity was added. This component is in some occurrences left out in research papers or substituted with another measure that can be calculated through financial ratios, such as size (Roman & Sargu, 2013). The rating for each bank is confidential and only released to top managers, this since a downgrade in the rating can be a risk to the stability of the banks and could possibly lead to a bank run (Kerstein & Kozberg, 2013). The
CAMELS rating system ranks banks from a scale from 1 to 5, with 1 representing a financially sound bank with little to no risk while a 5 on the rating scale symbolises a bank with large financial problems and possibly on the ruin of bankruptcy (Cole & White, 2012). A number of studies have through the use of accounting proxies correctly predicted bank failure, and found several proxy’s that have given robust links between financial ratios and the banks well-being (Chiaramonte & Casu, 2017; Cole & White, 2012; Kerstein & Kozberg, 2013).
1.2 Problem discussion
How to actually measure bank soundness have for a long time been a topic of discussion, how do one measure the risk contained in the financial sector? The z-score, stress testing and the CAMELS rating system are all well known monitoring systems that have been widely used. As aforementioned the CAMELS rating system is primarily used in the United States. The issue, and the subject of a lot of discussion is the proprietary nature of the ratings, as they are only available for top managers and the authorities conducting the rating. This have led to several researchers adapting the foundation of the model in terms of the six measurements but instead finding accounting proxies to be able to measure the banks well-being through financial ratios (Kerstein & Kozberg, 2013; Roman & Sargu, 2013; Swindle, 1995).
The other side of the coin is the current discussion of what actually led to the financial crisis and what actions that needs to be undertaken. The research has often focused on issues concerning bank efficiency or systematic risk in the financial sector (Barth, Caprio, & Levine, 2004). The changes that were hoped to occur after the new European Commission reform package on capital requirements has yet to be investigated. This has left a gap in the current research concerning the CRD IV package launched by the European Commission and the effect it has had on bank soundness. Therefore, this study will investigate if the new CRD IV package launched in 2013, in the aspect of the new capital requirements, has had an impact on the overall well-being using accounting proxies for the CAMELS rating system. Are the regulations enough to ensure a more sound and resilient banking sector? Due to the recent adoption of the CRD IV package from the European Union, acting as a revised version of the Basel III framework, this study will be conducted on banks residing in the European Union. Regulation in the form of capital requirements have created discussions among academic writers for a long time, with opinions both for and against
increased regulation of this sort (e.g. Demirgüç-Kunt & Detragiache, 2011; Barth et al., 2004; Leaven & Levine, 2009). Nonetheless, this well researched subject does leave some room for this study’s contribution. To the authors knowledge there has been no research on the impact of the CRD IV package on banks in Europe, through the use of the CAMELS rating system.
1.3 Purpose
The purpose of the study is to investigate the impact of the capital requirements, launched by the European Commission in the CRD IV package, in order to assess the banking soundness in the European Union using accounting proxies for the CAMELS rating system. By using financial ratios as proxies for the CAMELS variables, changes in the financial soundness in Europe can be detected and the impact of the new capital requirements can be analysed.
The rest of the study is structured in the following way: Chapter 2 lays out the CAMELS rating system and discusses the theoretical aspects of capital requirements. Chapter 3 will extend on the methodology and present the CAMELS variable selection; thereafter the findings are presented in chapter 4. Chapter 5 contains the analysis and the CAMELS rating and chapter 6 concludes the study.
2. Frame of reference
______________________________________________________________________
In this chapter the authors present the actions that have led to the current legislation, the concept of too big to fail and the CAMLES rating system is further introduced. In the theoretical framework the concept of
moral hazard, deposit insurance and capital requirement is covered.
______________________________________________________________________
2.1 Literature review
2.1.1 Development in the European Union
Since the financial crisis in 2007, researchers as well as legislators have tried to find the right way to regulate and curb the risk taking in the financial sector. The BCBS updated their Basel accords with the new Basel III framework in response to the financial crisis and the European Union launched their CRD IV package, a package that transposes the Basel accords. The commonly referred to CRD IV package contain two different types of legislation. One regulation that is directly applicable law in the member states, this regulation touches upon the aforementioned capital requirements and in addition to this it regulates a new leverage coverage ratio and a solution to the liquidity problems that have prevailed in Europe since the financial crisis. This regulation, Capital Requirements Regulation, henceforth referred to as CRR, and the capital requirements it put into legislative action will be the main focus of this study. The CRD IV, containing both a directive and a regulation, was needed for two reasons. Firstly, the Basel accords are international set standards that act as guidelines while the CRD IV package is a legislative action. Secondly, the Basel accords are only applicable to large international banks; the capital directives are instead pertinent to all financial institutions in the member states (European Parliament, 2013). The legislation also extends to other aspects that had been identified as the cause to the financial crisis and the banking instability that have been present in the European Union. These aspects include remuneration and bonuses, prudential supervision and corporate governance (European Parliament, 2013).
Demirgüc-Kunt, Kane & Laeven (2015) found in an extensive overview of deposit insurance that deposit insurance was one of the measurements governments around the world used in order to stabilize the financial market. The countries that could afford to broaden the deposit
insurance coverage did so in order to increase the safety net and restore confidence among depositors. The European Commission was no exception to this trend and 2014 the Commission updated their deposit insurance regulation, Directive 2014/49/EU. The directive maintained a deposit protection of €100,000 but did update other features. The key changes concerned: shortened time limit for pay-outs from twenty to seven days by 2024, improved information to depositors and ensured that the funds of the guarantees are funded by the banking sector (The European Parliament, 2014). Having explicit deposit insurance is an important cornerstone in order to understand both the need and impact of minimum capital requirements since it plays a vital part in the existence of capital regulations.
Another argument that has been expressed by researchers such as Boyd, Chang, & Smith (1998) is that banks that are widely dispersed in their activities and are able to build their efficiency on economies of scale, often become huge institutions that are subjected to the problem of “too big to fail”, and this in turn may lead to moral hazard problems. Moral hazard is defined as when someone takes the decision on how much risk to take, while someone else bears the consequences of the action (Krugman, 1999, 2008). This is an important aspect when understanding the additional legislation the CRD IV package contained in regards to these types of institutions. The capital requirements launched in the legislation, mentioned specifically the problem of banks that are subjected to the “too big to fail” problem. These types of large institutions, called global systemically important banks (G-SIBs) in the legislation, are addressed because of the problems they can create in case of their failure. The CRR ensures that in the event of their failure, the banks will have sufficient funds available in order for authorities to implement a resolution that will minimize the impact on the stability in the financial sector (The European Parliament, 2014). This will ensure that the depositors are protected and will hinder the exposure of public funds to loss. The problem with organizations of this size, and the problem the European Commission tries to minimize is the moral hazard that comes from the implicit deposit insurance that these types of organization are subjected to. Since the impact of a potential bankruptcy will afflict a large number of stakeholders, the banks expect that they will be protected by implicit deposit insurance, anticipating that the government will intervene in case of their failure. The Financial Stability Board (FSB) and BCBS regularly report and update the list of G-SIBs. These types of institutions face extra capital requirements due to their large size. Currently 30 banks in the world have been identified; out of these, 13 banks reside in the
European Union member states (FSB, 2015). The additional capital requirements are applied in five different buckets depending on how large the institutions are (see appendix 1). 2.1.2 CAMELS rating system
Due to the recent financial crisis, both national and international legislators and researchers have found a renewed interest in investigating the soundness and well-being in the financial system, but most importantly in the banking sector. This renewed interest comes from the recent bank failures that have spurred both governments and private depositors to find the best way both to curb the risk of losing their deposits but also to detect banks on the verge of failure. There exists two main reasons for supervising bank information; problem in the banking sector might serve as an early warning sign to deteriorating conditions in the world economy in general. The second reason is by the use of bank supervision, one could detect changes in lending behaviour, something that could affect the economy as a whole (Peek, Rosengren, & Tootell, 1999). The Federal Reserve and the FDIC developed a rating system, known as the CAMELS framework. This framework was specifically developed for detecting financial distress in the banking sector. The need for a rating system of this sort originated from the previous unregulated view on banking monitoring which lead to banks being bailed out with tax-payers’ money, something that wanted to be avoided at all cost. Originally the CAMELS rating system was developed in order to identify risky banks, but the usefulness of the rating system has led to wider uses in research, such as identifying the soundness of the financial system or predict bank failures.
The CAMELS framework uses a rating system ranging from 1 to 5 for each of the six measurements: capital, assets, management, earnings, liquidity and sensitivity (Kupiec, Lee, & Rosenfeld, 2017). Based on these scores an aggregated measurement is used to evaluate the overall score. If the bank receives a score of 1 or 2 it is considered to be well functioning bank with little risk, while a score of 4 or 5 is given to banks with problems or even on the verge of bankruptcy (Peek et al., 1999). A score of this scale will lead to even further investigation, and more frequent follow-ups (Division of Banking Supervision and Regulation, 2016). The continued investigation and more frequent follow-ups stems from that regulators do not use the CAMELS rating system to predict bank failures as it main purpose. Instead it is used to focus attention on problems that may exist in the bank and take action to reverse the down turn to a better and healthier bank (Cole & Gunther, 1998). In 1996 the CAMELS framework was updated to include a sixth measurement:
sensitivity. This measures the degree to which changes in different rates, commodity prices and equity prices will affect the profitability, capital or liabilities that are subjected to market risk (Division of Banking Supervision and Regulation, 2016).
Even though the CAMELS framework is used by the FDIC to evaluate banks and the risk they impose on the financial sector, it has very little regulatory burden since the ratings are confidential and only released to top managers. On the other hand, the ratings serve their function as they monitor other regulatory actions’ impact on the banks operations. The CAMELS ratings were until 2009 used to determine the different banks insurance costs, categorized after the ratings received (Kerstein & Kozberg, 2013). The CAMELS framework have for a long time been used as a bank supervision instrument, and several researchers found that CAMELS ratings are linked with both performance and general bank soundness (Chiaramonte, Croci, & Poli, 2015). Because of the confidentiality that surrounds the ratings, researchers have tried to recreate the CAMELS ratings in order to prove their accuracy of bank failure using accounting proxies. This off-site monitoring has shown that the CAMELS rating system can, to a large extent, be replicated using proxies based on available financial information (Cole & Gunther, 1998; Roman & Sargu, 2013). Kerstein and Kozberg (2013) found that accounting-based proxies for each of the six categories of CAMELS were significantly associated with the probability of bank failure. Their research thus suggests that using accounting proxies for CAMELS ratings could help both depositors and investors to evaluate the overall well-being of the bank. Cole & Gunther (1998) found the CAMELS ratings useful, but reached the conclusion that the ratings do decay rapidly. They found in their research that the official CAMELS ratings were equal or better at predicting bank failure than off-site monitoring but only if the ratings were less than six months old. If the ratings were given before that time frame, off-set monitoring, like the use of financial ratios was better at predicting bank failures.
2.2 Theoretical framework
2.2.1 Deposit Insurance
The financial sector is a cornerstone in today’s global world and the impact it can have on the world economy has never been clearer than after the financial crisis that started in 2007. Since banks are in a peculiar position of having a large number of dependents because of their size and the existence of information asymmetries, regulation of this sector
has existed for decades (Berger, Herring, & Szegö, 1995). The underlying theory behind regulations in the banking sector comes from the problem of moral hazard. Paul Krugman (2008) defined moral hazard as “any situation in which one person makes the decision about how much risk to take, while someone else bears the cost if things go badly”. This problem originates from the deposit insurance that exists in most developed economies. There is a consensus in economic theory that deposit insurance will help stabilize the financial markets in times of crisis and help it be able to resist the shock in the event of a bank run (Nier & Baumann, 2006). In the seminal article by Diamond & Dybvig (1983), they demonstrated the importance of deposit insurance in the sense that it calms the bank industry. Since banks always have been exposed to the risk of bank runs, some sort of insurance is needed. During a bank run, depositors panic and start to withdraw their deposits from banks at a rapid pace and the bank may be forced to have a fire sale of their assets at a loss (Diamond & Dybvig, 1983). To prevent these runs at the banks many countries implement the use of deposit insurance in order to calm the public that their money is safe (Keister, 2016). Without the guarantee of deposit insurance depositors may rush to the bank out of fear that a bank will not be able to repay all depositors in full, and through this action fulfil the banks failure. In a subsequent article by Diamond & Dybvig (1986) they concluded that deposit insurance is the only known effective measure to prevent bank runs without preventing them from creating liquidity.
Deposit insurance is said to act as a “safety net” in the event of a bank run, when depositors withdraw their savings at a rapid pace (Barth et al., 2004). The deposit insurance thus provides assistance to banks in cumbrance as well as protecting the bank’s customers. Governments often introduce explicit insurance deposits with the aim to curb the risk of systemic failure (Cull, Senbet, & Sorge, 2005). It is assumed that the deposit insurance will stabilize the financial system by backing the banks in order to prevent fire sales of assets that can lead to the entire financial system being contaminated (Diamond & Rajan, 2011). The explicit deposit insurance is often used in developed economies, but even in countries without an explicit guarantee there is often the assumption of an implicit insurance that may be a factor in moral hazard problems. The implicit insurance deposit here refers to the phenomenon that even without explicit deposit insurances there is an underlying assumption that the bank will not be allowed to fail, the government will intervene since there are too many that will be negatively affected by the bankruptcy. Prabha & Wihlborg (2014) research on the matter showed that implicit guarantees are an important aspect for discussion
when talking about the financial crisis, this also shown through the adoption of the new CRD IV package. “Too big, to connected, and too complex to fail” is often seen as an implicit guarantee that may affect banks views on risk since they are often subjected to implicit deposit insurance (Diamond & Rajan, 2000). Prabha & Whilborg (2014) research showed that these types of banks often face higher and stricter capital requirements to compensate for the impact they may have on the financial system in the event of their failure, and this could be seen by the additional requirements in CRD IV.
2.2.2 Moral Hazard
It has been argued that the usage of deposit insurance creates some problems when stabilizing the bank industry, moral hazard being one of the most important ones. Deposit insurance creates moral hazard since it frees the banks from the consequences of their actions (Ngalawa, Thcana Tchana, & Viegi, 2016). The thought that the use of deposit insurance leads to moral hazard problems is almost unanimous among researchers (Gropp & Vesala 2004; Cooper & Ross, 2002; Boyd et al., 1998). Both depositors and banks themselves are subject to the moral hazard. Depositors, since they are guaranteed their deposit back in the event of failure, no longer assess the credit-risk of the bank, and moreover choose a bank based on interest rates rather than the state of the bank's financial statements (Ngalawa et al., 2016). Even though deposit insurance may lead to a decline in depositors assessing the credit risk, there is still the problem of information asymmetries. It is problematic as a private person to monitor the banks full activities and financial statements due to both information abundance and asymmetries; therefore the need of deposit insurance still exists even though it may show some negative consequences (Demirgüc-Kunt & Detragiache, 2002). On the banks side, the deposit insurance guarantees that increased risk-taking in their portfolio will not bear any consequences other than increased profit since any negative consequences will not befall upon the depositors. Thus, deposit insurance creates moral hazard since none of the parties bear the full weight of their actions. Demirgüç-Kunt & Detragiache (2002) found in their research on the subject of deposit insurance that institutions that used deposit insurance experienced an increase in bank fragility. If this in turn were combined with weak institutional settings, the moral hazard would increase even more. The authors conclusion was that where institutions are well functioning, moral hazard problems are likely to be limited; due to the offset regulators can offer in those environments.
Boyd et al. (1998) found evidence for the theory that large deposit insurance escalated the moral hazard problems. If the banks know that they will not have to bear the consequences of the risks they are taking since they know that the government will bail them out, this can lead to a more risk filled portfolio. Buser, Chen, & Kane (1981) also made a well-known contribution to the subject of deposit insurance effectiveness. The authors argue that there is a pricing issue, if the insurance costs are less than the deposit-rates, the bank will increase the risk in their portfolios, since the gain is larger than the potential loss. Several other empirical studies have shown that the moral hazard created by having deposit insurance is dependent on other factors, such as ownership structure, institutional settings and different governance characteristic (Laeven & Levine, 2009).
2.2.3 Capital Requirements
Capital requirements have been seen as a counterweight to the moral hazard created by the deposit insurance. An argument that often is mentioned when discussing the need for capital requirements is that without capital regulation, unsuitable institutions may set up operations and through the use of capital requirements they may be discouraged (Morrison & White,
2005). According to VanHoose (2007) the reality of capital requirements often differentiate
from what researchers present, in reality only a small fraction of banks are actually restricted by capital requirements.
Capital requirements exists in most developed economies, even more so after the recent crisis, where both the BCBS and the European Union tightened the rules on capital adequacy and created a more stringent view on liquidity. Even though capital regulations often have been used in the financial sector, research has been divided if the current regulation is effective in creating stability in the banking sector. Demirgüc-Kunt & Detragiache (2011) conducted research whether compliance with the Basel Core Principles for effective banking supervision decreases the bank risk by measuring banks z-scores. They found no statistical evidence for a link between compliance with the Basel principles and improved bank soundness. Barth, Lin, Ma, Seade, & Song (2013) argued for that a too aggressive approach to monitoring could reduce efficiency, by creating higher costs and lower growth. In addition Chami & Cosimano (2010) research on the matter showed that while capital requirements may be necessary they often lead to banks retaining a capital buffer well above the minimum requirement, which in turn amplifies the effect and makes the capital buffers in banks larger than the legislators planned. Another argument for
increased capital regulation is that the financial sector is much riskier than other industries and when implementing capital regulations it reduces the banks’ ability to take risks since it limits the capital available for investments. This was also evidenced by Corona, Nan, & Zhang (2015) who found that implementing capital requirements restrains the banks risk taking behaviour, this in contrast to the research made by Kim & Santomero (1988) which instead shows that capital requirements have the opposite effect on risk taking. Another argument for an increased regulation of capital requirements was made by Cooper & Ross (2002) in which they extend the well-known model about deposit insurance by Diamond & Dybvig, and argues that capital requirements will mitigate moral hazard since it will force banks to invest in less riskier assets to compensate for the higher capital required. In addition to the argument that capital requirements and deposit insurance are important measurements to ensuring bank stability, Hellmann, Murdock & Stiglitz (2000) made a contribution to the research. In a dynamic environment, capital requirements are not enough. They proposed that capital requirements are not enough to ensure that bank restrain themselves from high-risk taking, this needs to be combined with deposit rate controls. The deposit-rate controls will lessen the weaknesses that capital requirements expose. Thus, the authors conclude that this combined use of capital requirements and deposit-rate control can be a valuable tool to reduce the moral hazard created by deposit insurance (Hellmann et al., 2000).
Another argument that illustrates the divided research on the impact of capital requirements comes from Dell'Ariccia, Laevan & Suarez (2017) research which shows that the effects of capital are impacted both from if the banks are in a risis period as well as by the interest rates. They found that poorly capitalized banks are less affected by the effect interest rates has on bank risk taking. Rajan & Stein (2002) argues that capital regulation is the necessary action that needs to exist in order to achieve long-term solvency, since it acts as a buffer. As soon as liabilities exceed assets the bank will face trouble paying their commitments, this in turn may lead to bankruptcy (Barrios & Blanco, 2003). With the fragility banks face, due to their high leverage ratio (Berger, et al. 1995) this type of proposed purpose for a capital buffer play a large role in mitigating the risk of insolvency.
Even though capital requirement have been proven to be of importance when discussing how to create stability in the banking sector there have been some critics. Research has been divided regarding the efficiency of capital requirements and criticism against current policies
has been extensive. Chiaramonte & Casu (2017) found that banks that faced large problems during the crisis still had capital levels well above the required level, thus implying that capital requirements are not enough to ensure soundness in the financial sector. Other researchers present the argument that by implementing capital requirements; the risk taking actually increases instead of the estimated decrease (Kim & Santomero, 1988; Behn, Haselmann, & Wachtel, 2016). If the cost for raising capital to meet the minimum level is too high, the bank may increase the risk to be able to raise capital to reach the required level (Blum, 1999). Calem (1999) also made an argument that when increasing the capital buffer, the banks instead choose a risker asset portfolio to compensate for the lower expected return. The lower return that comes with capital requirements was supported by Tran, Lin, & Nguyen (2016) research, they found evidence that higher capital requirements may lower a banks profitability since it requires a higher cost of capital. This may also lead to banks choosing to operate outside of the core business in which they can expect a higher return, thus increasing the risk (Kim & Santomero, 1988). Another argument often made in regards to the negative sides of capital requirements is the new innovative ways banks take to reach the same pre-capital returns, these new ways include using different more risky instruments or pre-capital arbitrage (Jones, 2000).
3. Method
______________________________________________________________________
In the following chapter the authors present the research design and the data collection. The data is collected from financial statement from the European Union 30 largest banks of the period of 2011-2015. The data collected is used to create financial ratios to act as accounting proxies in the CAMELS rating system.
______________________________________________________________________
3.1 Research Design
The data used in this study was hand collected secondary data from financial statements during the period 2011-2015. The sample is composed of the 30 largest commercial banks in the European Union; the sample is chosen based on asset size (Relbanks, 2017). This approach of identifying banks via asset size is often used when categorizing and ranking banks in order of size (Barth, Prabha, & Swagel, 2012). Government owned banks are excluded due that they do not report as explicitly as the commercial banks and thus lacked the necessary data in order for the authors to conduct their study. To evaluate and analyse the impact the new CRD IV package launched by the European Commission, accounting-based proxies for the CAMELS measurements will be used. The use of accounting proxies to evaluate bank soundness was used with success in Kerstein and Kozberg’s (2013) research. Their research concerned if accounting proxies could be used to predict bank failures as effectively as the FDIC’s proprietary CAMELS measures. They found that accounting proxies with the purpose to capture the same economic value as the CAMELS measurements: capital, asset, management, earnings, liquidity and sensitivity is positively associated with the probability of bank failure. They reach the conclusion that using accounting-based proxies for the CAMELS ratings could aid investors and customers to detect the risk of bank distress in the future. Other researchers have also used the CAMELS rating system through accounting proxies with successful results (Betz, Oprica, Peltonen, & Sarlin, 2014; Swindle, 1995; Chiaramonte et al. 2015).
Even though using off-site monitoring is a popular tool for researchers, there still exist room for errors. This since there can exist more factors than researchers have access to that affect the result, as opposed to on site monitoring where additional information can be observed that may be of proprietary nature. In addition to this the study do not take macroeconomic
variables into account and hence only relies on bank specific financial measurements. While macroeconomic measures have been found statistically linked with predicting bank failure (Betz et al., 2014), this study will be based on accounting proxies for the CAMELS rating system only. Consequently, a disclaimer should be issued that the data used in this study is dependent on the quality of the accounting information it is based on, this in line with Cole & Gunther’s (1998) research on the limitations of off-site monitoring systems.
In Altman’s (1968) seminal article where he developed the z-score, he found evidence that financial ratios are relevant in predicting bank difficulties. This statement still stands as proven by the continued use of his developed z-score and other measurement systems that still utilize financial ratios for predicting bank failure (Chiaramonte et al., 2015). The ratios acting as accounting proxies for the CAMELS measurements, as well as the tables displaying the findings were all calculated using Excel. All financial data used was converted into Euro (see appendix 12), and the results will be presented using 4 decimals. The final ratings, which have been based on the results of the accounting proxies are presented in the analysis section, where all banks have been allocated with a rating between 1 and 5, 1 representing the highest ranking a bank can be awarded.
3.2 CAMELS measurements and variable selection
3.2.1 Capital
The first component in the CAMELS rating system is capital. The accounting proxy used to measure the capital adequacy is the Basel III calculation that was implemented in 2013 (BCBS, 2011). This is a minimum requirement both from the BCBS, as well as a legislative requirement, taken into action by the European Parliament. According to regulation (EU) No 575/2013, from the European Commission, the level of the banks own fund requirement is 8 per cent. This means that the banks must have at least 8 per cent in total capital adequacy ratio. The capital requirement consists of two parts, the core capital (tier I) and supplementary capital (tier II), these two together form total capital of the bank. Tier I is considered to be the key element of capital and consists of shares and disclosed reserves, such as retained earnings. Supplementary capital, tier II, consists of undisclosed reserves such as undisclosed profit or revaluation reserves. Tier II capital is limited to 100 per cent of Tier I capital. The capital reserves are then put into proportion to risk weighted assets to calculate the ratio.
Risk weighted assets are regulated in their calculation through the Basel III framework and in turn the CRD IV package. The assets are weighted according to three categories of risk; market, operational and credit risk. Safe assets such as cash are ignored in the calculation while certain loans are considered more risky and get a higher final weight. The purpose of using risk-weighted assets is that if a bank holds riskier assets, they are also forced to retain a higher capital buffer to compensate for the additional risk. In additions to weighing the assets on the banks’ balance sheet the banks must also weigh in risks concerning off balance sheet assets. These off balance sheet assets may be concerning credit card or loan commitments (European Parliament, 2013).
In this study, the calculation for capital is through the capital adequacy ratio provided by Basel III and enforced by the CRD IV package to investigate if any change can be seen in the banks during the period 2011-2015, before and after the CRD IV package was implemented. The variables are collected from the banks’ balance sheet. The calculation used is as follows:
CAR - (Tier 1 capital + Tier 2 capital) / Risk weighted assets 3.2.2 Assets
3.2.2.1 Total loans outstanding to total assets
Asset quality have long been considered an important aspect to bank soundness. The asset quality is often associated with the risk of banks. In the event of a bank run, assets may be sold off at a rapid pace, which requires a good quality asset base in order to avoid a fire sale at a loss (Diamond & Dybvig, 1983). The majority of banks assets are compromised of the outstanding loans, making an estimation of the quality of the loans an important ratio when evaluating the asset quality in banks. Although banks assets should be comprised of loans to an extent, there is a risk to having a too high ratio since it may make the bank more exposed to loan losses (Roman & Sargu, 2013). With increasing loan losses a too high ratio may indicate that the bank will have trouble in meeting its commitments due to both low liquidity but also a rapidly dwindling asset base. Niu (2016) research showed that loans comprised 52 per cent of all assets held by American banks in 2013, but also states that size and the ratio of outstanding loans to assets are correlated. The larger the bank the lower the ratio of outstanding loans to total assets is. In addition to this, Jin, Kanagaretnam, & Lobo
(2011) found that growth in overall loans can act as a predictor of bank failure, since a large growth in loans outstanding may indicate an incremental increase in riskier loans. The components for the total loans outstanding include both loans and advances to customers as well as to credit institutions and central banks. The calculation is based on the values found in the banks’ balance sheets. The calculation used is as follows:
LOA - Total loans outstanding / Total assets
3.2.2.2 Impaired loans to total loans outstanding
Chiaramonte et al. (2015) used the impaired loans to total loans outstanding in her research as an indicator of asset quality. The higher the ratio, the lower the perceived quality of the loans is. The ratio of impaired loans to total loans outstanding is also often associated with the perceived risk of the banks’ assets, and a dependent variable to the banks’ capital ratio, making it a proxy to measure a banks risk (Shehzad, de Haan, & Scholtens, 2010). The two variables are dependent by each other since an increase in impaired loans affects retained earnings which in turn causes the capital ratio to decline, unless the bank attracts new additional capital. Niu (2016) research showed that size and impaired loans are correlated, the larger the bank that higher the ratio of impaired loans becomes. Impaired loans were retrieved from the banks income statement and the total loans outstanding from the balance sheet. The calculation used is as follows:
IMP - Impaired loans / total loans outstanding
3.2.3 Management
The management component of the CAMELS rating system has long been considered the most difficult one to measure through the use of accounting proxies. This since it is considered a qualitative aspect and to grasp the real value, internal information is needed. Because of its elusiveness this component of the CAMELS model is often left out (Cole & Gunther, 1998). Since the internal information containing management systems, compliance and other parts of the management is not included in the financial statements, finding the suitable proxy have been widely discussed by researchers. Kerstein & Kozberg’s (2013) used enforcement actions as a proxy in their research since this could be seen as an indicator of noncompliance. Roman & Sargu (2013) used the operating expenses as a percentage of total
assets and total interest expense as a percentage of total deposits. DeYoung (1998) found that management of a bank was best measured through unit cost. He found that poorly managed banks averaged a 29 per cent higher unit cost than well-managed banks, and therefore this will be the ratio used. In addition to this he also evidenced that the M component of the CAMEL rating system is found to be statistically significant with the final CAMELS rating received. Operating costs was collected from the banks income statement and outstanding loans were obtained from the balance sheet. Therefore, in this report the management component is calculated as follows:
CPU - Operating cost / outstanding loans
3.2.4 Earnings
3.2.4.1 Return on Equity
Banks have long been seen as special institutions, this since they are subjected to a higher level of regulation than other corporations, but their aim is still to generate profit and give return on investors’ investments. Because of this, the earnings component is often measured by return on equity (ROE) or return on assets (ROA) (Poghosyan & Cihak, 2011; Kerstein & Kozberg, 2013). Other researchers have also used ROE as an indicator of the management component of the CAMELS rating system (Jin et al., 2011). Tran et al., (2016) research suggests than capital requiremnts may impact the ROE negatively since it leads to a higher cost of capital.In addition to this Bhattacharya (2013) investigated the effect and pattern of ROE and found that the mean for ROE remained more or less constant during the period of 1950-2004. The assumption is that banks want to maintain the same pre-CRD IV ROE, as after the introduction of the reform package, this statement adopted from Schmaltz, Pokutta, Heidorn, & Andrae (2014) research on the impact of the Basel III framework implementation. Bhattacharya (2013) also found that when the capacity for generating return is negatively affected by implementing capital requirements, banks seeks to find assets or business with higher return to compensate for the reduced size of money for investments. Thus, if the ROE remains constant or even increases while the bank at the same time shown increases in the capital held, the return comes from riskier assets, hence the risk in the banking sector increases (Bhattacharya, 2013). If the assumption that the same ROE should remain even after the implementation of the CRD IV package, something else is affecting the earnings since the bank will have less capital to invest. Tran et al. (2016) found in their study of .S banks during the period 1996-2013 that the average ROE for large banks
was 4,4 per cent. The net income was collected from the banks income statements and total assets were collected from the balance sheet. The calculation used is as follows:
ROE – Net Income / Equity
3.2.4.2 Return on Asset
The second measurement for earnings is ROA; this measurement is an indicator if the banks have managed their investments more efficient. Betz et al. (2014) found in their research during the period 2000-2013, that ROA had an average of 0,01, however they used the measurement of ROA as an indicator of asset quality and not the earnings component. ROA have often been used in research as an overall indicator of profitability (Altman, 1968). Sinkey, Terza, & Dince (1987) tested the probability of failed banks using financial ratios and reached the conclusion that ROA is one of the most comprehensive measurements of bank performance there is. He found a clear link between banks that had a higher ratio of ROA and non-failed banks. The failed group of banks had about half the ratio compared to the non-failed group he conducted the research on. ROA have often been used as a measure of bank profitability and soundness and is therefore a good indicator for the CAMELS earnings component (Kerstein & Kozberg, 2013; Cole & White, 2012; Poghosyan & Cihak, 2011). The ratio is based on net income that was found in the income statement and total assets were obtained from the balance sheet. The calculation used is as follows:
ROA - Net Income / Total Assets
3.2.5 Liquidity
3.2.5.1 Loan to Deposit Ratio
A common measurement for a banks level of liquidity is the use of the loan to deposit ratio (Bologna, 2015). This ratio measures the banks total outstanding loans to the total deposits. Ritz & Walther (2015) reached the conclusion that banks with stronger deposit base have done better since the crisis, and found evidence for the trend that banks have the goal of reducing their loan to deposit ratio back to 100 per cent. They also found that banks with a
high loan to deposit ratio experienced a stronger drop in lending during the crisis, a vital element for continued operations. Bologna (2015) reached the same conclusion, loan to deposit ratio is an important measurement and vital to the banks continued stability. The author also reaches the conclusion that there is a clear need for regulatory liquidity conditions by supervisory agencies, since it can signal potential vulnerabilities better than management action. The values retrieved include both loans and advances to customers and to central banks and credit institutions. Both total loans outstanding and total deposits were obtained from the banks’ balance sheet. The calculation used is as follows:
LTD - Total loans outstanding / Total Deposits
3.2.5.2 Debt to Asset Ratio
The second measurement used in rating the liquidity in the banking sector is the common financial ratio that compares the total liabilities to the total assets. Altman (1968), while investigating financial ratios as a predictor of firm insolvency, describes the crucial element for assets to exceed the liabilities otherwise the company becomes insolvent. This ratio is commonly referred to as debt to assets ratio. Banks often have the highest leverage ratio of firms across any industry (Berger et al., 1995). Compared to non-financial firms banks tends to show that debt often constitutes about 90 per cent of a bank balance sheet (Bushman, 2014). Thus, the debt to asset ratio is expected to be rather high in the sample, but it is still an indicator of the liquidity of the firm. The use of the ratio of total liabilities to total assets as a measure of financial leverage and in turn the company’s liquidity was used by Sturm (2013). The two components for the ratio used in the study were obtained from the banks’ balance sheet. The calculation used is as follows:
DTA - Total liabilities / Total Assets
3.2.6 Size
The CAMELS model includes the component of sensitivity to market risk (Division of Banking Supervision and Regulation, 2016). To calculate this measurement, internal information from the bank investigated is often needed, since the component is dependent on the variation of the financial assets prices. Since this poses several difficulties in obtaining the data, and it cannot be measured through financial and accounting data only, the authors of this study have exchanged the variable. Several studies shows that size is an essential
component when investigating bank soundness. Prabha & Whilborg, (2014) argues for the importance of size in their research since large banks are expected to be more diversified. The notion that diversification decreases the risk in a banks portfolio is a fundamental fact in portfolio theory, and thus decreasing the risk of the bnks failure (Demsetz & Strahan, 1997). Therefore, in this study the sensitivity component will be exchanged with bank size instead. This use of the CAMELS rating system, exchanging sensitivity with bank size, follows the approach by Roman & Sargu (2013). Growth has been proven to impact a bank’s performance negatively and is therefore of interest in the sense that if the banks have increased in size it might have an impact of their performance (Fahlenbrach, Prilmeier, & Stultz, 2012). The ratio that represents the bank size used in the study will thus be the ratio of bank assets to total assets in the banking sector. Since this research is based on the banking soundness in the European Union, the total assets in the banking sector will include the total assets held by banks in the member states. The sample chosen contains 13 banks that have been identified as G-SIBs by BSBC and FSB (FSB, 2015). The total number of assets of the banking sector used in the calculation was collected from the ECB database2 (European Central Bank, 2016). The calculation used is as follows:
SIZE - Total assets / Total assets of the banking sector
2http://sdw.ecb.europa.eu/quickview.do?
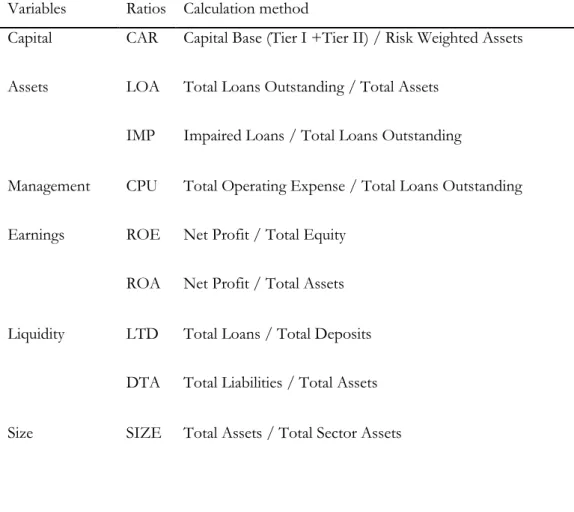
Table 1 - CAMELS measurements and variable selection
Variables Ratios Calculation method
Capital CAR Capital Base (Tier I +Tier II) / Risk Weighted Assets Assets LOA Total Loans Outstanding / Total Assets
IMP Impaired Loans / Total Loans Outstanding
Management CPU Total Operating Expense / Total Loans Outstanding Earnings ROE Net Profit / Total Equity
ROA Net Profit / Total Assets Liquidity LTD Total Loans / Total Deposits
DTA Total Liabilities / Total Assets Size SIZE Total Assets / Total Sector Assets
4. Empirical findings
______________________________________________________________________
In the following chapter the authors present the reader with an overview of the findings resulted from the accounting proxies used and how they have changed during the period of 2011-2015.
______________________________________________________________________
4.1 Capital
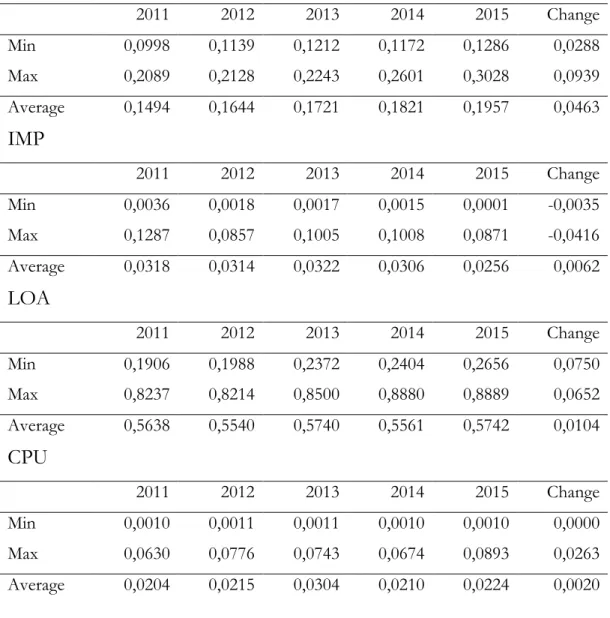
The measure of banks capital adequacy was done through the use of the capital adequacy ratio (CAR) that puts the total capital of the financial institution in relation to the risk weighted assets. The findings are displayed in table 2. The required level of CAR is 8 per cent and this requirement is fulfilled by the entire sample over the observed time span. No observation is ever below the 8 per cent limit with the minimum level of CAR measured at 0,0997 in 2011. This is still above the required level of capital held and the average for the entire sample during 2011 was 0,1444. The increase from 2011 to 2015 showed that the average of the sample increased by 0,0463 to 0,1957 in 2015. The maximum values measured for the entire period has increased with almost ten per cent, with the starting values at above 20 per cent. The findings show that the current average of CAR exceeds the required level with over 10 per cent. The complete CAR sample data can be found in appendix 2.
4.2 Assets
The ratio loans outstanding to total assets (LOA) is an indicator of the part of assets that is comprised of loans outstanding. The higher the ratio the riskier the bank is perceived since liquidity may be low as an effect of having a too high ratio (Roman & Sargu, 2013). The values included in the data collection are loans and advances to both customers and credit and bank institutions, and can be found in table 2. The average LOA over the period registered an increase, going from 0,5638 to 0,5742. The increase during the observed period did however only reach about one per cent. This is higher than the average ratio presented in Niu (2016) research of the LOA in American banks, which observed a value of 0,52. The average value of the LOA may not give a clear view of the total loans outstanding in the observed sample since large differences can be seen both between the years and the banks. With observations in 2011 ranging from the minimum value 0,1906 (Deutsche Bank), while
other banks during the same year showed a LOA of 0,8236 (ABN AMRO). The findings did however show that some banks are still struggling with a decrease of outstanding loans during the timespan observed. The complete LOA sample data can be found in appendix 3.
The asset quality was also measured by the second ratio between impaired loans to total loans outstanding (IMP). Since the main part of the bank’s assets consists of loans, the ratio is of importance when determining the quality of assets (Chiaramonte & Casu, 2017). A lower ratio indicates better asset quality, thus a decrease in the percentages of impaired loans indicates an improved asset base. The findings concerning the IMP can be found in Table 2. The average IMP observed has decreased from 0,0317 to 0,0256 during the period with the total difference during the period from 2011 to 2015 of -0,0061. Lloyds showed the maximum value of 0,1287 in 2011 and this value was also the highest value observed during the entire timespan, which gave the bank a very high IMP ratio. Lloyds ratio has since then decreased with 0,1078 showing a clear improvement. The complete IMP sample data can be found in appendix 4.
4.3 Management
The cost per unit measured through the ratio of operating costs to outstanding loans (CPU) is an indicator of management in line with DeYoung (1998) research. The observed period did see an increase in the average CPU of the observed banks. The findings are displayed in table 2. With the average cost per unit detected in 2011 of 0,0204 compared to the cost in 2015 of 0,0224, the results show a lack of the expected improvement in the management component. The largest increase in the CPU is observed in DeutscheBank, which experienced an increase by 0,0263 in CPU. Nine out of the 30 observed banks did however show a decrease in the cost per unit. The findings also showed the minimum value experienced zero change during the timespan, with the same starting and ending CPU of 0,001. The complete CPU sample data can be found in appendix 5.
Table 2 - Capital, Assets & Management
CAR
2011 2012 2013 2014 2015 Change Min 0,0998 0,1139 0,1212 0,1172 0,1286 0,0288 Max 0,2089 0,2128 0,2243 0,2601 0,3028 0,0939 Average 0,1494 0,1644 0,1721 0,1821 0,1957 0,0463IMP
2011 2012 2013 2014 2015 Change Min 0,0036 0,0018 0,0017 0,0015 0,0001 -0,0035 Max 0,1287 0,0857 0,1005 0,1008 0,0871 -0,0416 Average 0,0318 0,0314 0,0322 0,0306 0,0256 0,0062LOA
2011 2012 2013 2014 2015 Change Min 0,1906 0,1988 0,2372 0,2404 0,2656 0,0750 Max 0,8237 0,8214 0,8500 0,8880 0,8889 0,0652 Average 0,5638 0,5540 0,5740 0,5561 0,5742 0,0104CPU
2011 2012 2013 2014 2015 Change Min 0,0010 0,0011 0,0011 0,0010 0,0010 0,0000 Max 0,0630 0,0776 0,0743 0,0674 0,0893 0,0263 Average 0,0204 0,0215 0,0304 0,0210 0,0224 0,0020 Source: Authors own calculations based on financial statements.4.4 Earnings
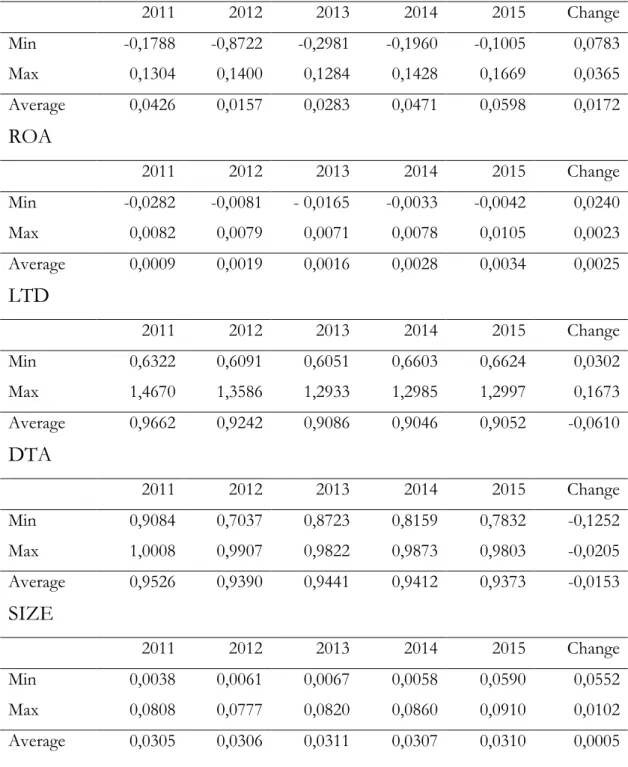
The quality and development in earnings is measured by the use of two common financial measurements. The first one, return on equity (ROE) shows the return on the investor’s investment and can be found in table 3. The difference of the average ROE of the observed sample is 0,0172. The observed ROE increased from 0,0426 in 2011 to 0,0598 in 2015. Dexia bank is excluded from the calculation of the average ROE of 2011 since they had an observed value of -36,3781, due to an equity of - €320m. The highest difference registered during the period was, with the exception of Dexia bank, made by UniCredit that went from a negative
ROE of -0,1788 in 2011 to 0,0338 in 2015, with a difference during the observed period of 0,21265. Five banks had a negative ROE in 2011, this number have improved to only three banks in 2015. Two out of the three banks showing a negative ROE in 2015 did not experience this in 2011. Thus, only one bank had a negative ROE during the entire sample period, but twelve banks did though show a negative development, decreasing their ROE over the time span. The complete ROE sample data can be found in appendix 6.
The observed sample shows a small increase in Return on assets (ROA), the second measurement of the earnings component in the CAMELS rating system and the findings are displayed in table 3. The average value of the sample in 2011 showed a result of 0,0009, which increased by 0,0025, resulting in an average of 0,0034 in 2015. Similar to the ROE findings, the number of banks that registered a negative ROA decreased during the observed timespan. Five banks experienced a negative return on assets in 2011 compared to the three banks in 2015. The three banks that had a negative ROA were the same ones that experienced a negative ROE, this due to having a net loss. The maximum value for the period was observed in 2015, which showed a ROA over 0,01 for the first time in the observed period. While only three banks had a negative ROA, eight banks did experience decreases in the ratio during the observed time span. The complete ROA sample data can be found in appendix 7.
4.5 Liquidity
The liquidity ratios used in order to observe the change in this study is total outstanding loans to total deposit (LTD) and total liabilities to total assets (DTA). These two financial ratios are often used in order to observe the liquidity of a firm (Bologna, 2015), and the findings are presented in table 3. A too high LTD may indicate a lack of liquidity and thus can contribute to creating bank fragility. The sample shows a decrease in the LTD during the period by -0,0610. The average LTD observed in 2011 was 0,9662 and by 2015 it had decreased to 0,9052. Eight banks had a LTD of more than 1 in 2011, which indicates low liquidity in the bank. In 2015 this number had decreased to seven banks. The maximum value observed occurred during 2011 by Lloyds that had a loan to deposit ratio of 1,4669. Dexia bank went against the trend of decreasing LTD and instead showed an increase in the ratio by 0,2312 during the period and by 2015 it had a ratio of over 1, something that it did not experience during 2011. Barclays experienced the largest decrease in the LTD with a
difference during the period of -0,3794, but still recorded a ratio above 1 in 2015. The results of the LTD differs from the EBA reports on the issue, this since this study takes both loans and advances to customers and to credit and central banks into consideration. According to the EBA’s report the loan to deposit ratio in 2015 was 120,9%. The complete LTD sample data can be found in appendix 8.
The results from the sample show how the DTA has decreased during the observed time frame with a difference of -0,0153, but it still remained higher than the expected 90 per cent in line with Bushman (2014). The average went from a value of 0,9526 in 2011 to 0,9373 in 2015. Only in 2011 did the observed maximum value exceed a ratio of 1 since Dexia had negative equity during this year. The largest escalation was observed by Intesa Sanpaolo, which increased their DTA with 0,0229. On the other side of the spectrum with the largest decrease, Barclays showed a diminishing DTA with a difference of -0,1766 going from 0,9597 to 0,7832. Only two banks showed an increase in the DTA during the observed period, Nordea and Intesa Sanpaolo. The complete DTA sample data can be found in appendix 9.
4.6 Size
As aforementioned, previous researchers have substituted the original measurement of the last component, S, from sensitivity to size (Roman & Sargu, 2013). To investigate the impact the size of the bank’s assets are compared to the total sector assets (SIZE). The observed results show that there has been an increase in the SIZE. During the observed period the average bank assets increased from 0,0305 to 0,0310, an increase of 0,0005. Ten banks in the sample showed a decrease in size during the period, with Royal Bank of Scotland showing the largest decrease with -0,0222. The largest growth within the SIZE ratio was observed by HSBC with an increase of 0,0173. The findings also show how the samples combined assets have decreased in value during the time period with almost 8 per cent. The complete SIZE sample data can be found in appendix 10.