Review of paleo-, historical and current
seismicity in Sweden and surrounding
areas with implications for the seismic
analysis underlying SKI report 92:3
2017:35
Authors: Björn LundRoland Roberts Colby A. Smith
SSM perspective Abstract
The report contains a review of the current state of knowledge on Swedish paleoseismic events, as well as information on the Swedish earthquake catalogue updated to early autumn 2016 and the revised Nordic earthquake catalogue (Fencat). It includes a section on the possibilities to assess spatial and temporal variations in seismicity, given the sparse early catalogues and the low earthquake activity rate in Fennoscandia. The updated earthquake data is compared to the SKI Technical Report 92:3 (SKI 92:3) data and it comments on how this may affect the ground motion spectra and how this work could continue. SKI 92:3 contains envelope ground response spectra especially developed for Sweden in a joint research project between the Swedish nuclear power inspectorate (SKI) and the Swedish licensees. It was not within the scope of this study to perform a quantitative assessment of how the existing spectra are affected by the updated data set.
Background
The number and quality of instrumentally recorded earthquakes in Fenno scandia have significantly increased since the publication of SKI 92:3, mainly depending on the expansion and modernization of the Nordic seismic net works. The Fencat catalogue accordingly contains many more events than when data were extracted for SKI 92:3. In addition, the historic part of the catalogue has been updated with new estimates of location and magnitude of the larger events, and cleared of a number of frost and blast related events. The large number of smaller earthquakes recorded in the last two decades give a good indication of current spatial variability in the earthquake rate and it is also making it possible to outline fault systems in Sweden that are cur rently seismically active, although with a low rate.
Therefore, the Swedish Radiation Safety Authority (SSM) has commissioned Seismology group at Uppsala University to carry out the present study with the objective as it set out below. SSM especially emphasized the need to include information on paleoseismic events, which are not included in the SKI 92:3 data.
Objectives of the project
The objective was to review the current status of paleoseismology and historical earthquakes in Fennoscandia and to update and evaluate the earth quake data used in SKI 92:3, as well as to qualitatively assess how the new results would affect the envelope ground response spectra in SKI 92:3. Results
There are twelve confirmed post- or endglacial fault scarps in Sweden where glacial landforms have been displaced. For many of these there is, however, lack of stratigraphic information which would help constrain both the timing of the events and whether they formed as a result of a single rupture or not. It will also provide information critical to magnitude calculations. There are, however, no indications of observations of multiple large ruptures on the endglacial faults.
Swedish paleoseismic events associated with a fault scarp, as well as con firmed events from Norway and Finland are included in the final inventory. The report presents an updated table of events with location, timing and magnitude, as needed by a seismic hazard assessment.
Based on comparisons of different time slices of Fencat, it could be find that on the large scale the spatial variation in seismicity in Sweden has been rela tively stable during the last century.
The results in SKI 92:3 are not expected to be affected by the paleoseismic data, if analysed with the SKI 92:3 methodology.
Occurrence rates estimated with only the recent Swedish earthquake data or the Fencat data indicate that the SKI 92:3 estimate may be conservative for earthquakes of magnitude 5 and smaller but that it may underestimate the rate of large events.
Project information
Contact person SSM: Kostas Xanthopoulos Reference: SSM20154962
2017:35
Authors: Björn Lund 1), Roland Roberts 1), Colby A. Smith 2)
1) Uppsala University, Uppsala
2) Geological Survey of Sweden (SGU), Uppsala
Review of paleo-, historical and current
seismicity in Sweden and surrounding
areas with implications for the seismic
analysis underlying SKI report 92:3
This report concerns a study which has been conducted for the Swedish Radiation Safety Authority, SSM. The conclusions and view-points presented in the report are those of the author/authors and do not necessarily coincide with those of the SSM.
Summary
The Swedish Radiation Safety Authority (SSM) initiated a project with the Seismology group at Uppsala University in order to update and assess the earthquake data which forms the basis of the currently used envelope ground response spectra for Swedish nuclear power plants in SKI Technical Report 92:3 (SKI, 1992). SSM especially emphasized the need to include information on paleoseismic events, which are not included in the SKI (1992) data. In this report we will perform an initial comparison of the SKI (1992) data and the updated earthquake catalog and comment on potential qualitative effects on the earthquake occurrence probabilities. A quantitative assessment of how the existing spectra are affected by the updated data set is not within the scope of this project.
The literature on post- or endglacial faulting in Sweden has been reviewed in Appendix 1 of this report. We conclude that there are 12 confirmed endglacial fault scarps in Sweden where glacial landforms have been displaced. For many of these there is, however, lack of stratigraphic information which would help constrain both the timing of the events and whether they formed as a result of a single rupture or not. There are no indications in the literature of observations of multiple large ruptures on the endglacial faults. We discuss claims of paleoseismicity in the absence of surface ruptures and find that there is great uncertainty in many of them, in terms of occurrence, location, magnitude and timing. Only paleoseismic events associated with a fault scarp are included in the final inventory. We add to the inventory of Swedish paleoseismic events the confirmed events from Norway and Finland and present an updated table of events with location, timing and magnitude, as needed by a seismic hazard assessment. It should be noted that research on postglacial faults in Fennoscandia is currently developing very rapidly, bringing new information about the known faults and possibly identifying new ones.
Since the publication of SKI (1992) there has been a tremendous increase in the number and quality of instrumentally recorded earthquakes in Fennoscandia, thanks to the expansion and modernization of the Nordic seismic networks. The joint Nordic
earthquake catalog Fencat (Ahos & Uski, 1992; FENCAT, 2016) therefore contains many more events than what it did when data were extracted for SKI (1992). In addition, the historic part of the catalog has been updated with new estimates of location and
magnitude of the larger events, and cleaned of a number of frost and blast related events. The large number of smaller earthquakes recorded in the last two decades not only give a good indication of current spatial variability in the earthquake rate, it is also slowly making it possible to outline fault systems in Sweden that are currently seismically active, although with a low rate. Comparing different time slices of Fencat we find that on the large scale the spatial variation in seismicity in Sweden has been relatively stable during the last century. There are significant temporal variations in the seismicity rates, both in the country as a whole and in different subareas. Much of this variability is, however, related to varying degrees of observational efforts and, later, instrumental deployments, making it difficult to draw firm conclusions about variations in crustal processes.
The seismic data underlying the analysis in SKI (1992) is not explicitly described, neither the area used nor the magnitude range included. It is therefore difficult to make
comparisons of the updated data to the SKI (1992) values for seismicity rate per area and year and the variation of that rate with size of the events, as expressed by the seismic moment. We find for the paleoseismic data that these are unlikely to affect the results of SKI (1992) if analyzed with the SKI (1992) methodology. However, in a modern
probabilistic seismic hazard analysis they are likely to increase the estimated hazard. Occurrence rates estimated with only the recent Swedish earthquake data (2000-2016) or the joint Fennoscandian earthquake data (Fencat) for a region including Sweden, Finland and the Baltic and two different time periods (1970-2012, magnitude 2 or larger and 1875-2012, magnitude 3 or larger) indicate that the SKI (1992) estimate may be
conservative for earthquakes of magnitude 5 and smaller but that it may underestimate the rate of large events. These conclusions do, however, depend on which data were included in the SKI (1992) estimates and that we do not know.
Advances in data acquisition, hazard methodology and international recommendations has made SKI (1992) outdated. We suggest that an update of SKI (1992) is considered, and emphasize the need for expertise in intraplate seismicity if such a project is initiated. We see a number of important issues related to the Fennoscandian intraplate seismicity that needs to be addressed in future analysis: the level of paleoseismicity in Sweden, the stationarity of earthquake occurrence, the maximum possible magnitude and uncertainties in ground motion prediction.
Sammanfattning
Tillsammans med seismologigruppen vid Uppsala universitet initierade Strålsäkerhets-myndigheten (SSM) ett projekt för att uppdatera och utvärdera de jordbävningsdata som ligger till grund för de markrörelsespektra, dokumenterade i SKI Technical Report 92:3 (SKI, 1992), som styr hur jordskalvsrisker behandlas vid svenska kärnkraftverk. SSM pekade särskilt på behovet av att inkludera paleoseismiska data, något som inte alls berörs i SKI (1992). I detta projekt har vi sammanställt och uppdaterat seismiskt data och
kvalitativt jämfört nya jordskalvsfrekvenser med de i SKI (1992). Det har inte ingått i projektet att kvantitativt utvärdera hur de existerande spektra skulle förändras med ändringar i den bakomliggande jordskalvskatalogen.
Vi har sammanställt en litteraturstudie över postglaciala jordskalv i Sverige (i Appendix 1 i denna rapport) och finner att det finns 12 bekräftade postglaciala förkastningar i Sverige som förskjutit sediment från den senaste istiden. Många av dessa saknar dock stratigrafisk information vilken skulle kunna minska felmarginalerna på uppskattningar av både när skalven inträffade och huruvida de inträffade som enstaka stora händelser eller som flera mindre. Det finns i sammanställningen inga indikationer på att dessa förkastningar skulle ha rört sig upprepade gånger i stora skalv. Vi diskuterar också de paleoseismiska
händelser som definierats utifrån spår i lösa sediment, där det inte finns en förkastning på jordytan. Tolkningen av dessa data är som regel är behäftade med stora osäkerheter; om det verkligen är ett skalv som orsakat sedimentstörningarna, när skalvet inträffade, var det hade sitt epicentrum och hur stor magnituden i så fall var. Endast postglaciala skalv med en förkastning synlig på ytan är medtagna i den slutgiltiga listan över svenska
postglaciala jordskalv i denna rapport. Till den listan har vi lagt bekräftade postglaciala skalv från Norge och Finland och vi presenterar en uppdaterad tabell över skalvens lokalisering, magnitud och när de inträffade, parametrar som alla behövs för en seismisk riskstudie. Vi noterar att forskningen om postglaciala jordskalv i Fennoskandien utvecklas mycket fort just nu med ny information om kända förkastningar samt indikationer på skalv på nya platser.
Sedan SKI (1992) publicerades har det skett en enorm ökning i antalet jordskalv som registrerats instrumentellt i Fennoskandien, och i kvalitén i bestämningen av skalven. Detta beror framförallt på utbyggnaden och moderniseringen av de nordiska seismiska nätverken. Den samnordiska jordskalvkatalogen Fencat innehåller därför betydligt fler skalv idag än den gjorde vid tiden för datauttaget till SKI (1992). Den historiska delen av Fencat har dessutom uppdaterats med nya bestämningar av lokaliseringar och magnituder för många av de större skalven och rensats på händelser som visat sig vara relaterade till frostknäppar eller sprängningar. Det stora antalet småskalv som registrerats under senare år ger inte bara en god bild av skalvens rumsliga fördelning, det har under senare tid visat sig att de sakta men säkert börjar ge en bild av förkastningssystem i Sverige som är seismiskt aktiva. Genom att jämföra den rumsliga fördelningen av jordskalv i olika tidsperioder i Fencat ser vi att den storskaliga skalvfördelningen i Sverige är relativt stabil över det senaste århundradet. Det finns signifikanta tidsvariationer i datat, både i Sverige som helhet och i olika mindre områden. En stor del av den variationen måste tillskrivas variationer i hur noggrant man samlat in data från allmänheten, och senare i hur
instrumenteringen sett ut, vilket gör det svårt att dra slutsatser om geologiskt signifikanta variationer.
De seismiska data som ligger till grund för SKI (1992) är tyvärr inte beskrivna i detalj. Inte vilket område som inkluderats och inte heller vilka magnituder som tagits med i
beräkningarna. Det är därför svårt att göra jämförelser mellan det nu uppdaterade datat och siffrorna i SKI (1992) på skalvaktiviteten per år och ytenhet, och hur aktiviteten varierar för olika stora skalv. För de postglaciala skalven finner vi att dessa inte påverkar resultaten i SKI (1992) om analysmetoden i SKI (1992) används. En modern seismisk riskanalys (s.k. PSHA) skulle dock inte vara komplett utan de postglaciala skalven, och de skulle öka risken. Skalvaktivitet beräknad utifrån det moderna svenska datat (2000-2016) eller från Fencat för ett område som innefattar Sverige, Finland och Östersjön under två tidsperioder (1970-2012, magnitud större än 2, 1875-2012, magnitud större än 3) tyder på att siffrorna i SKI (1992) är konservativt uppskattade för skalv med magnitud 5 eller lägre, men att de skulle kunna underskatta risken för större skalv. Dessa slutsatser vilar dock på ofullständig information om hur SKI (1992) tagit ut sitt seismiska data. Förbättringar i datainsamling, riskanalys och internationella rekommendationer har gjort att SKI (1992) nu är föråldrad. Vi föreslår man överväger att uppdatera SKI (1992), och betonar att om ett sådant projekt initieras är det viktigt med expertis inom så kallad ”in-traplate” seismologi, d.v.s. jordskalv i geologiskt gamla områden långt ifrån plattgränser-na. Vi ser att ett flertal viktiga frågor om den Fennoskandiska seismiciteten behöver bely-sas ytterligare, som t.ex. hur stor var den paleoseismiska aktiviteten, hur stabil är jord-skalvsaktiviteten i tid och rum, vilken är den största magnitud vi kan ha i Sverige och hur kan osäkerheter i markrörelseberäkningar kvantifieras på ett rimligt sätt.
Table of contents
Summary ... 1
Sammanfattning ... 3
1. Introduction ... 6
2. Brief review of the relevant sections of SKI (1992)... 7
2.1. Earthquake occurrence data ... 7
2.2. Ground motion data ... 9
3. Update on Fennoscandian seismicity ... 10
3.1. Paleoseismicity ... 10
3.2. Development of Fencat ... 14
3.3. Earthquakes in Sweden 2000 – 2016 ... 18
4. Temporal and spatial variations in seismicity ... 22
4.1. Temporal variations ... 23
4.2. Spatial variations ... 26
4.3. Recurrence times ... 27
5. Implications for the results of SKI (1992) ... 29
5.1. Accounting for paleoseismicity ... 29
5.2. The SKI (1992) seismicity function ... 30
5.3. Ground motion prediction equations ... 32
5.4. Further work ... 33
6. Conclusions ... 35
7. Acknowledgement ... 36
References ... 37
Appendix 1: Literature review of post-glacial paleoseismic events in Sweden 43
1. Introduction
The Swedish Radiation Safety Authority (SSM) initiated a project with the Seismology group at Uppsala University in 2015 in order to assess and update the earthquake data which form the basis of the currently used envelope ground response spectra for Swedish nuclear power plants in SKI Technical Report 92:3 (SKI, 1992). SSM especially
emphasized the need to include information on paleoseismic events, which are not included in the SKI (1992) data. It is not within the scope of this project to quantitatively assess how the existing spectra are affected by the updated earthquake catalog, the project will only perform an initial comparison of the data sets and comment on potential
qualitative effects on the earthquake occurrence probabilities.
During the last decade a number of probabilistic seismic hazard analysis (PSHA) projects have been performed for planned or existing nuclear power plants. These projects include for example the PEGASOS Refinement SSHAC Level 4 project in Switzerland
(Swissnuclear, 2013), the Thyspunt SSHAC Level 3 project in South Africa (Bommer et al., 2015) and two projects in Finland, one for the planned Fennovoima power plant at Hanhikivi (Korja & Kosonen, 2015) and one for the existing power plants in Lovisa and Olkiluoto (TVO/Fortum project, no public reports). The projects have developed methodology for PSHA and also analyzed problems, and application of procedures, related to various tectonic environments. The Fennovoima and TVO/Fortum projects were collaborative efforts between seismological and geological institutes in Finland, Sweden, and for TVO Estonia, designed to take into account expertise from the countries included in the areas of influence for each site. These two projects also initiated a study to revise the joint Fennoscandian earthquake catalog, Fencat, maintained at the University of Helsinki, in order to remove events that were not earthquakes and homogenize
magnitudes. The final results of the Finnish projects are not yet in the public domain, but may be acquired from the companies and could be used as a starting point if SKI (1992) was to be updated.
This report contains a review of the current state of knowledge on Swedish paleoseismic events, information on the revised Fencat catalog and the Swedish earthquake catalog updated to 30 September 2016. We include a section on the possibilities to assess spatial and temporal variations in seismicity, given the sparse early catalogs and the low earth-quake activity rate in Fennoscandia. The updated earthearth-quake data are compared to the SKI (1992) data and we comment on how this may affect the ground motion spectra and how this work could be continued.
2. Brief review of the relevant sections of SKI
(1992)
The earthquake data which form the basis for the occurrence rate relations used in SKI (1992) are discussed in Report No. 1 of the six report compilation that is SKI (1992). The fundamental parameters used in the relations are the scalar seismic moment and the hypo-central distance. Report No 1 contains five Appendices, of which Appendices 2-5 discuss the earthquake data underlying the conclusions in Report No 1. As we will refer frequent-ly to these Appendices we denote them SKI (1992) A2 to SKI (1992) A5. Earthquake data for the spectral characteristics and ground motion attenuation with distance are most-ly discussed in Report No. 2 of SKI (1992).
2.1. Earthquake occurrence data
The earthquake data in SKI (1992) come mainly from the joint Fennoscandian earthquake catalog Fencat (Ahjos & Uski, 1992; FENCAT, 2016), maintained at the University of Helsinki but contributed to by seismic networks in Sweden, Finland, Norway, Denmark, Estonia and NW Russia. The SKI (1992) analysis includes Fencat data until 1987. As the depth estimates for the Fencat data up until 1987 usually had high uncertainties, SKI (1992) used the earthquake depth distribution from Slunga et al. (1984), based on data from the FOA southern Sweden seismic network of 1980-1984. In addition, SKI (1992) A2 & A3 support the analyses by use of the western Scandinavia data from Ambraseys (1985), analyses by Slunga and collaborators (Norrman & Slunga, 1984; Slunga et al., 1984; Slunga, 1986) and various European and international earthquake catalogs (e.g. Leydecker, 1986; Karnik, 1969,1971; Bulletin of the International Seismological Centre, U.K, and the Preliminary Determination of Epicenters from the U.S. National Earthquake Information Center). When discussing seismicity rates in the appendices it is worth noting that the authors had instructions to focus on the Ringhals and Barsebäck nuclear power plants, so the seismicity analysis did not include earthquakes north of latitude 61°. In SKI (1992) A2, Slunga argues that the temporal variability in seismicity and the difficulty in predicting where larger earthquakes occur implies that the seismic zones defined around the nuclear power plants should reflect a larger, regional seismicity rate. For Barsebäck he proposed the area in Sweden south of the Tornqvist zone (a major geological boundary east-west through northern Skåne), including Zealand in Denmark. For Ringhals, Slunga proposed to use the seismicity in all of southwestern Sweden west of the Protogine zone (another major geological boundary that runs north-south from Värmland, through Vättern to northern Skåne), including the Kattegatt area north of the Tornqvist zone. There is no analysis of the frequency – magnitude distribution around the nuclear power plants in SKI (1992) A2. However, Slunga presents frequency - magnitude relations for various circular areas around the 1904 Oslofiord magnitude 5.4 earthquake. He notes that the radius has to be at least 500 km for the 1904 event to fall within the (extrapolation) of the frequency-magnitude distribution of the events in the area. There are no results in terms of the Gutenberg-Richter a- and b-values.
Arvidsson et al. in SKI (1992) A3, proposed a different zonation scheme based both on the seismicity and a then recent map of tectonic lineaments and faults in southwestern Sweden (Kornfält & Larsson, 1987). They propose 6-7 seismic source areas in
southwestern and southern Sweden, and Denmark. Ringhals would be in a zone along the southwest coast, north of northwestern Skåne. For Barsebäck, it is unclear from SKI (1992) A3 which zone it would belong to, either the zone along the Tornqvist zone, or the zone comprising Denmark. There is no analysis of the frequency – magnitude distribution in SKI (1992) A3.
In SKI (1992) A4, Skordas & Wahlström analyze frequency – magnitude distributions for Barsebäck and Ringhals, using circular areas centered on the power plants with radii 50, 100, 150 and 200 km. The data used come from the merged Arvidsson et al. catalog in SKI (1992) A3 (it is not explicitly stated but probably refers to Appendices I and II in Arvidsson et al.) and comprises events from 1497 to 1985. It is unclear if the study uses epicentral or hypocentral distances. Skordas & Wahlström use both a linearized least-squares method and the Aki (1965) maximum likelihood method to estimate the a- and b-values of the Gutenberg-Richter distribution. The numbers stabilize for radii of 100 km or more, when there are enough events in the analyses. The maximum likelihood method gives b-values of approximately 0.9 – 1.1 for Barsebäck and for Ringhals 1.0 – 1.1. As is evident from the above, SKI (1992) A2-A4 give three different suggestions as to how zonation around the power plants should be done. In the main text of Report No. 1, none of these schemes were eventually used. Instead the main report compares the various frequency-magnitude estimates from the appendices and other studies (Norrman & Slunga, 1984; Ambraseys, 1985) and adopts a more conservative “large-scale
Fennoscandian average” frequency-magnitude (actually a frequency – scalar seismic moment) relation, referred to as the “seismicity function”. It is not clear from SKI (1992) which data or region were actually used for the calculation of the epicentral density used in the seismicity function. The report states that averaging over hundreds of thousands to millions of square kilometers can produce a reliable assessment of the epicentral density for magnitudes up to approximately 5. The report also states that the seismicity function “is basically determined on the basis of earthquake observation data extracted from Fencat (1987) […] comprising 733 events in Scandinavia”. This number is the same as that quoted in Arvidsson et al. in SKI (1992) A3 for their Fencat data for only Sweden, south of latitude 61°. It seems, however, unlikely that this very restricted data set is the basis for the seismicity function as the number of large earthquakes is very small (five events with local magnitude above 4.5), it does not include Norwegian nor Danish seismicity, not even the large 1904 event, and the frequency-moment comparisons in Figure 7 of Report No. 1 indicate that a much larger data set was used to produce the seismicity function.
The seismicity function has a fixed point (“is anchored” in the language of SKI (1992)) at seismic moment M0 = 1015 Nm. The number of earthquakes per square kilometer and year
with seismic moments which exceed M0 = 1015 Nm is referred to as the epicentral
occurrence density NA and is anchored at NA(M0 = 1015 ) = 1.5·10-7. As discussed above,
it is unclear how this number was obtained and which area was used. Since SKI (1992) uses the scalar seismic moment instead of a magnitude, magnitudes from Fencat has been converted to scalar seismic moments. This has been done using the relationships between macroseismic magnitudes, local magnitudes and scalar seismic moment outlined in Slunga et al. (1984). Unfortunately, there is no analytical expression in Slunga et al. (1984) for the relationships used between macroseismic magnitude, local magnitude (Wahlström, 1979) and seismic moment for seismic moments larger than 1013 Nm. We
have only the two graphs of the relationships provided in Appendix 2 of Slunga et al. (1984), making it difficult to repeat the calculations in SKI (1992). Reading off the
graphs, the SKI (1992) anchoring moment corresponds approximately to local magnitude 4.7 and macroseismic magnitude 5.0. We note that on the moment magnitude scale (Hanks & Kanamori, 1979), used nowadays for larger magnitude events, the anchoring moment corresponds to MW 3.9.
The frequency – moment function adopted in SKI (1992) is: log NA = a – b' · log M0
where the b'-value is different from the usual frequency – magnitude b-value as it has to incorporate the relation between the magnitude scale and log M0. SKI (1992) uses a b' of
0.87. How this value was obtained is not discussed. Figure 7 of Report No 1 compares various frequency-moment distributions from Appendices 2 and 4 and from other studies. The b' of 0.87 may just be an adaption to these results. SKI (1992) does not incorporate events with moments larger than 3·1018 Nm, corresponding to a local magnitude of
approximately 6.5 and a moment magnitude of 6.3. Such a “cut-off” is referred to as the maximum possible magnitude in the area of interest, Mmax, in current earthquake hazard
analyses. SKI (1992) notes that the cut-off does not affect the statistical result “very much”, as the contribution from events with moment larger than 1018 Nm is “fairly
small”.
In order to produce estimates of the occurrence rates of different magnitude earthquakes at different distances from the power plants, SKI (1992) uses the hypocentral distance and integrates over crustal volumes at various distance intervals. Although not explicitly stated in the text, Figure 1 in Report No. 1 indicates that the seismogenic crustal thickness is assumed to be 35 km. This figure also defines the hypocentral depth distribution and distance intervals used in the calculations of the tabulated values in SKI (1992) A1.
2.2. Ground motion data
As data on ground motion characteristics from larger earthquakes in Fennoscandia were very scarce in the late 1980s, and still are, SKI (1992) turned to the so called Standard Response Spectra for rock sites in Japan (Hisada et al., 1978; Ohsaki, 1979; Watabe & Tohdo, 1979; Katayama, 1982; Ohta et al., 1983). These are about 300 acceleration spectra with mathematical models for the description of the spectra in terms of e.g. Peak Ground Velocity (PGV) or spectral velocity (Sv). As the spectra come from Japanese earthquakes in a plate boundary setting where both the earthquake source functions and the wave propagation effects can be markedly different from those in the Fennoscandian intraplate environment, SKI (1992) identified three main factors which cause significant differences between Japan and Fennoscandia; (i) the earthquake stress drop, (ii) the fault area and associated strong motion duration, (iii) the anelastic attenuation along the wave path. All these three effects were analyzed and the spectra modified accordingly.
The Japanese magnitudes, M, were converted to scalar seismic moments using the relationship: log M0 = 9.1 + 1.5·M, in accordance with Slunga (SKI (1992) A5).
The modeled response spectra for Swedish hard rock sites were compared to data from three earthquakes in the Eastern USA and Canada. The comparisons indicate that the Swedish response spectra agree fairly well with the Eastern North America data at fre-quencies below approximately 10 Hz, but that they underestimate the response at higher frequencies.
3. Update on Fennoscandian seismicity
The 24 years that have passed since the publication of SKI (1992) has seen a significant increase in data and knowledge on Fennoscandian seismicity. The evolution of seismic instrumentation, data acquisition and processing power has made possible a large expansion of the Nordic seismic networks, especially in Sweden where the Swedish National Seismic Network (SNSN) grew from five analogue and one digital seismic station in 1997 to 65 modern digital broadband stations in 2012. The denser seismic networks now detect much smaller events and thus the number of analyzed earthquakes has grown rapidly. From the year 1497 to August 2000, when the SNSN entered automatic network processing, there are approximately 1,400 earthquakes in Fencat within the Swedish territory. From August 2000 to September 2016, the SNSN has recorded almost 7,900 earthquakes within Sweden, increasing the database by more than a factor 5. The implications of the new instrumental data are discussed in Section 3.3 below.
A second strong trend in the last decade or so has been a renewed interest in postglacial, or endglacial, faulting. As will be reviewed in Section 3.1, new Lidar (Light detection and ranging) data have revolutionized geomorphological studies and made possible a new way to identify and analyze postglacial faults. In addition, reflection seismic studies, microearthquake studies, InSAR and a host of geophysical studies have been performed over some of the faults, see below.
3.1. Paleoseismicity
Quoting Bolton (2015), “The aim of paleoseismology is to generate a record of past earthquakes (i.e. magnitude, recurrence interval, timing, etc.) from a range of geological observables preserved within a landscape. This is achieved by identifying features
associated with a single paleoearthquake as opposed to the long-term deformation along a fault or within a basin.” As the written historical earthquake record in Fennoscandia, which goes back approximately 500 years, contains very few large earthquakes, paleoseismology could potentially be a powerful tool to complement the data on
occurrences of large events. However, in contrast to more seismically active areas, faults suitable for trenching that have been seismically active in the last few thousand years are difficult to identify in Fennoscandia, due to the low seismicity rate. There is one notable exception to this, the large post- or end-glacial fault scarps mostly found in northern Fennoscandia, see Figure 1.
In Appendix 1 of this report we review the current knowledge on post-glacial paleoseismic earthquakes in Sweden. The conclusions of the review are:
“According to the literature, there are twelve scarps in Sweden that appear to cross cut glacial sediments. These 12 features often include multiple segments and complex geometries. Most of these structures are in the northern part of the country, but examination of LiDAR-derived imagery has revealed previously unknown scarps in central Sweden. For all of these features, fault rupture is interpreted to have occurred around the time of deglaciation generally between 10,500 and 9,500 years before present. Magnitude estimates for the seismic events associated with fault ruptures range from as low as Mw=6.1 to as high as Mw=8.2 [range for the different faults]. Review of the
literature has also revealed the complete lack of stratigraphic information relating to most Figure 1. Copy of Figure 3.2.3.1 from Korja & Kosonen (2015). Inventory of post-glacial
fault scarps in Fennoscandia. Note that since the publication of this Figure, the
Nordmannvikdalen fault has been reclassified and is no longer considered to be tectonic (Redfield & Hermanns, 2016).
of the scarps. Stratigraphic information would not only help constrain the timing of fault rupture, but also provide information critical to magnitude calculations. The assumption that each scarp formed as a result of a single event remains untested on six of the ten scarps.
Despite the vast body of literature related to proposed paleoseismicity in Sweden in the absence of surface rupture, great uncertainty surrounds many of these claims. Sediments may be disturbed in a number of different ways in a glacial environment, and they do not necessarily indicate paleoseismicity. The assigning of ages and magnitudes to proposed
paleoseismic events defined by disturbed sediments is often ad hoc or attained through misuse of published empirical data. Without the presence of a scarp, significant uncertainties exist regarding the location (ie occurrence), timing, and magnitude of proposed paleoseismic events. Thus, they are excluded from the current inventory.” There is little evidence for paleoearthquakes in the time period between the apparent burst of seismicity occurring as the ice sheet disappeared, 11,000 – 9,500 years before present (BP), and the start of written historical records. Mörner (2004) reports five events, based on soft sediment disturbances, with associated magnitudes between the time of the Pärvie rupture (~9,500 years BP) and 5,000 radiocarbon years BP. In addition, Mörner (2009) reports an additional eleven events between 4,800 radiocarbon years BP and 900 radiocarbon years BP, stating however that only two of these are “recorded by multiple factors and firmly dated.” One of the two was later assessed by Gregersen and Voss (2014) as an unlikely earthquake. As the uncertainties in occurrence, location, timing and magnitude of these soft sediment based events may be significant, as pointed out in Appendix 1, we will not include them in the paleoseismic catalog here until they are more thoroughly investigated.
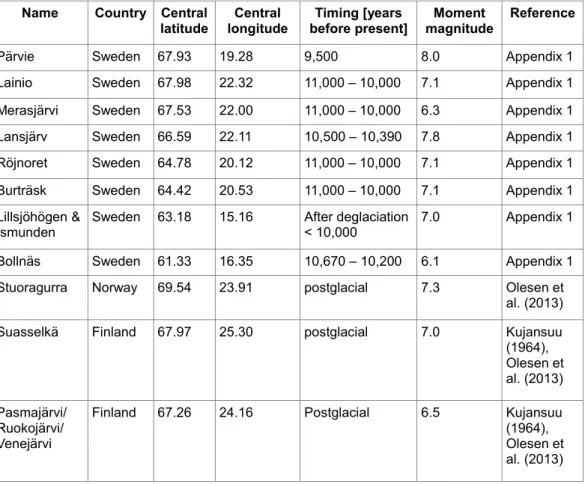
For the purpose of this report, i.e. assessing how paleoseismicity may affect the seismic hazard analysis in SKI (1992), the events need to have an associated magnitude. Of the twelve paleoearthquakes identified in Appendix 1, only eight have reported magnitudes. These are listed in Table 1, taken from Table 1 in Appendix 1. Of the four
paleoearthquakes without magnitude estimates in Appendix 1, two have fault scarp lengths of approximately 40 km and two have shorter scarps (11 and 17 km), see Table 1 in Appendix 1. Depending on the depth of the rupturing fault and the amount of slip in the event, the magnitudes of these events are probably in the 6-7 span. The apparent
mismatch between the magnitude of the Pärvie event in Table 1, and the magnitude range given in the conclusions quoted above comes from an earlier magnitude estimate for Pärvie, discussed in Appendix 1. As pointed out in Appendix 1, there are significant uncertainties associated with the magnitude estimates for the endglacial events. The estimates are usually based either on statistical relationships between surface rupture or fault offset and magnitude (e.g. Leonard, 2010) or the moment magnitude definition from the scalar seismic moment, which is estimated from surface rupture length, width of the fault plane from the seismogenic thickness of the crust and an average slip often taken as the observed surface offset. In addition, the faults are always assumed to have ruptured the full extent at one instance in time. There are no indications in the literature of observed multiple large ruptures of the same endglacial fault. Many of the assumptions needed for a magnitude estimate are not as strongly based in the data as would be desired, and therefore the magnitude estimates are often worst case scenarios. With the review in Appendix 1, we conclude that during a time span of up to 1,500 years around the disappearance of the ice sheet, Sweden experienced at least a dozen earthquakes of magnitudes 6 – 8.
Large endglacial faulting also occurred in Norway and Finland, see recent reviews in Lund (2015) and Korja & Kosonen (2015). In Norway, the NEONOR project (Olesen et al., 2013) investigated a large number of claims of neotectonism and concluded that only two endglacial faults could be identified with certainty, the Stuoragurra fault in Finnmark and the Nordmanvikdalen fault in Troms. Recently, the Nordmanvikdalen fault has been reclassified as non-tectonic (Redfield & Hermanns, 2016). In Finland, recent Lidar investigations have revealed a number of new endglacial faults and extended the length and complexity of some of the previously known faults (e.g. Sutinen et al., 2014; Korja &
Kosonen, 2015). In Table 1 we have included those faults which have been confirmed as postglacial and have a magnitude estimate documented in the literature.
A few claims of end- or postglacial faulting have been made in Denmark and northern Germany. In Denmark, Sandersen & Jörgensen (2015) used Lidar, borehole and airborne electromagnetic data to analyze irregularities on the Tinglev outwash plain in
southwestern Denmark. They interpret these as Holocene strike-slip movements along graben faults, but do not identify the causative faults and can therefore not provide location or magnitude of the proposed events. In Germany, Brandes et al. (2012) identified meter-scale faults in a Pleistocene age alluvial-aeolian sand complex and inferred that movement on these was due to one or more earthquakes on the nearby Osning Thrust fault system, some 16,000 – 13,000 years before present. The causative earthquake locations were, however, not identified and therefore no magnitudes could be estimated.
Name Country Central
latitude longitude Central before present] Timing [years magnitude Moment Reference
Pärvie Sweden 67.93 19.28 9,500 8.0 Appendix 1
Lainio Sweden 67.98 22.32 11,000 – 10,000 7.1 Appendix 1 Merasjärvi Sweden 67.53 22.00 11,000 – 10,000 6.3 Appendix 1 Lansjärv Sweden 66.59 22.11 10,500 – 10,390 7.8 Appendix 1 Röjnoret Sweden 64.78 20.12 11,000 – 10,000 7.1 Appendix 1 Burträsk Sweden 64.42 20.53 11,000 – 10,000 7.1 Appendix 1 Lillsjöhögen &
Ismunden Sweden 63.18 15.16 After deglaciation < 10,000 7.0 Appendix 1 Bollnäs Sweden 61.33 16.35 10,670 – 10,200 6.1 Appendix 1 Stuoragurra Norway 69.54 23.91 postglacial 7.3 Olesen et
al. (2013) Suasselkä Finland 67.97 25.30 postglacial 7.0 Kujansuu
(1964), Olesen et al. (2013) Pasmajärvi/ Ruokojärvi/ Venejärvi
Finland 67.26 24.16 Postglacial 6.5 Kujansuu (1964), Olesen et al. (2013)
Table 1. Large paleoseismic earthquakes in Sweden, Norway and Finland with
associated location, timing and magnitude. Coordinates give the approximate midpoints of the faults, see Figure 1.
As alluded to above, research on endglacial faulting has been significantly revived in the last decade. New faults have been found (e.g. Appendix 1) and some old faults have been reclassified as probably not end- or postglacial (e.g. Olesen et al., 2013; Redfield & Her-manns, 2016). Doubts on the estimated magnitudes come from e.g. Lidar data which in-dicate that perhaps the Pärvie fault did not rupture all at once (Appendix 1) and new
mi-croearthquake data from Burträsk which indicate that the fault may not have ruptured through the entire seismogenic crust (Lund et al., 2015). More geophysical techniques such as reflection seismics (e.g. Ahmadi et al., 2015), magnetics and gravity (e.g. Malehmir et al., 2016), lake bottom mapping (Vogel et al., 2013) and electromagnetics (Kamm et al., 2016) are being applied to the faults to determine their extent and orienta-tion, and satellite techniques such as InSAR have been used to try to infer current surface motion (Mantovani et al., 2013). A deep drilling project on the Pärvie fault (DAFNE) is in the planning stages in order to probe the fault at depth (Kukkonen at al., 2011). In addi-tion, the last decade has seen renewed modeling initiatives in order to better understand the mechanics of the process of endglacial faulting (e.g. Lund et al., 2009; Steffen et al., 2014). It is likely that our knowledge of endglacial faulting will continue to expand in the near future, and that this will increase our understanding of the potential hazards that such faulting, and the current activity on the faults, pose to our society.
3.2. Development of Fencat
The current version of the Fencat joint Nordic earthquake catalog contains events from 1375 up until the end of 2012 and has a total of 21,385 events, 4,582 of which occurred prior to 1 January 1988, see Figure 2. As SKI (1992) does not explicitly describe the data set used we do not know how many of the latter events were part of the 1987 Fencat edition used for the seismicity function. SKI (1992) probably extracted data in some specific region, with some specific quality and magnitude thresholds.
The earthquake data in Fencat come from a wide variety of sources. The early data are assembled from publications by natural scientists, often on other topics, and from church records in Sweden and Finland which from 1749 were required to note information also on odd and unusual events. The establishment of the Royal Swedish Academy of Sciences in 1739 created a forum for notices and discussions that included earthquake phenomena but it was not until the end of the 19th century that systematic collection of
earthquake information in Sweden was initiated by the Swedish Geological Society. This function passed to the Geological Survey of Sweden after the large earthquake of 1904. The other Nordic countries saw similar developments.
Instrumental recording of earthquakes in the Nordic countries started with the installation of a Wiechert long-period seismograph in Uppsala in 1904. This was followed by
seismographs in Bergen in 1905 and Helsinki in 1924. These first seismographs were not very sensitive to local or regional earthquakes, and from the records of felt earthquakes it seems that even earthquakes with magnitudes up to 4 in the Nordic countries were sometimes not recorded by these instruments. This is, however, a point for further research. Seismic networks that were sensitive enough to pick up most of the felt events were not in place until the late 1960s, early 1970s for all of Fennoscandia. Note that the earthquake maps in Figure 2 only contain Fencat data, implying that the lack of events in northern Germany and Poland is incorrect. Incorporating data from a European wide catalog is necessary to assess seismicity there. It is unclear how this was addressed in SKI (1992).
The long time span implies that a number of different magnitude scales have been used over the years. Definitions of macroseismic scales, based on reports of felt ground motion and intensity estimates (also on different scales) have varied over the years. The
instrumental local magnitude scales in Fencat. Seismic hazard studies require a uniform magnitude definition for the events used, which makes it necessary to homogenize the magnitudes in the catalog. As discussed above, in SKI (1992) this was done by conversion to a seismic moment scale.
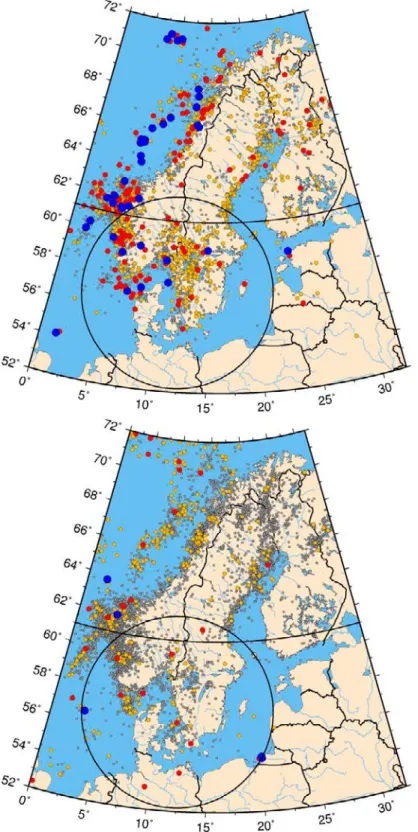
Figure 2. Map of earthquakes from Fencat. Small grey circles, magnitude M < 3, yellow
circles, 3 <= M < 4, red circles 4 <= M < 4.6(5.0) and large blue circles correspond to
at N61° indicates the cut-off used in SKI (1992) and the circle shows a one million square kilometer circular area around Ringhals. Top) Events prior to 1/1 - 1988. Bottom) Events between 1/1 – 1988 and 31/12-2012, plus the 2014-09-15 Sveg (M4.1) and 2016-03-19 Bottenviken (M4.1) events.
The recent seismic hazard projects in Finland (e.g. Korja & Kosonen, 2015) initiated a review of Fencat for the relevant areas (500 km and 300 km radius circles centered on the locations of the future and current nuclear power plants, respectively) and a new effort of homogenization of the magnitudes. This process is now complete for earthquakes in Finland but not yet for all of Sweden. For Norway and Denmark the process has only begun. For Sweden and Finland we have returned to the references where the early data were compiled during the late 19th and early 20th centuries in an attempt to identify events
that have erroneously been classified as earthquakes. We have also reviewed particular issues such as proximity to known blast sites (mines, quarries, military etc) and
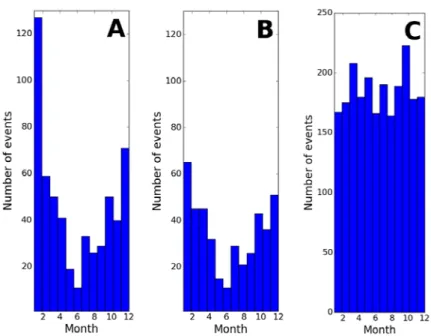
temperature. One problem in the data prior to about 1920 is a strong seasonal signal, see Figure 3A. The prime suspect for that is frostquakes, cracking of the frozen ground with accompanying loud noise and sometimes also shaking. We acquired weather data from the Swedish and Finnish Meteorological Institutes for a number of locations, going back to approximately 1845. We also received the Uppsala temperature series, which starts in 1722. For some time periods we also had snow cover data, which aids the analysis since thick snow cover insulates the ground and prevents frost cracking. For Sweden in the time period 1904 – 1965 we have only investigated events with estimated magnitude over 3.5. We studied temperature fluctuations around the dates of the earthquakes and could identify a number of events which correlated with a rapid decrease in temperature from around zero to below -10. In some instances these “events” were also accompanied by cracking of the ground, as noted in the original descriptions. The events remain in Fencat, but are marked as doubtful. Most of the frost related events are small, but our analysis of the 2-4 January 1894 events indicates that the mainshock, assigned macroseismic magnitude 5.1, is actually widespread frostquakes in south-central Sweden and southern Finland. It is extremely unlikely that a magnitude 5.1 earthquake in Sweden would cause cracks in the ground in Finland. After removal of the frost and blast related events, the seasonal distribution can be seen in Figure 3B. We see that there is still an obvious seasonal signal, indicating that it is likely that there are more frost quakes in the data, but that this signal is now significantly reduced as compared to Figure 3A. In Figure 3C we show instrumentally recorded data from Fencat for 1965 – 2012, and we see that the seasonal signal is not present in that data.
During the investigation we also corrected the dates for the early events where the conversion from the Swedish version of the Julian calendar to the standard Gregorian calendar had not been properly performed. We also marked as doubtful some events which are likely to be mining induced, or rock bursts, and some events which are likely to be blasts from Navy operations.
The magnitudes of small historical earthquakes are difficult to assess and often rely on only a few observations in a small area, leading to considerable uncertainty. Not even for the very largest earthquakes is it always straightforward to assign a magnitude, as it very much depends on the reliability and interpretation of reports of shaking. Recent studies of the 1759 Kattegatt and the 1819 Lurøy earthquakes, probably the largest in Fennoscandia, have caused a significant debate on the interpretation of both distant reports of shaking and nearby reports of non-shaking (e.g. Huseby & Kebeasy, 2004, 2005; Wahlström, 2004; Bungum & Olesen, 2005). The magnitude estimate for e.g. the Lurøy event varies from MS 5.1 to MS 5.8. Since the time of data collection for SKI (1992) in 1987 there has
(1987) for Norwegian events, Bungum et al. (2009) for the 1904 Oslofiord event and the studies referred to above.
Figure 3. Seasonality in the earthquake data in Fencat. Number of events versus month.
A) All events in Fencat 1375 - 1920. B) Events considered to be frost, weather and blast related removed from 1375-1920. C) Instrumental earthquake recordings 1965-2012 (note the different scale).
Summarizing, a revision of the Fencat catalog has been performed for Finland and Sweden from the first entry to 1903. For Finland, the catalog has been cleaned up to the most current entry, while for Sweden only events with magnitude larger than 3.5 have been checked between 1904 and the present. The smaller events will be investigated in the near future. A number of events with magnitude greater than 4 have been considered doubtful during this process, most importantly the 1894 event with macroseismic magnitude 5.1 (corresponding to M0 just above 1015Nm, using the graphs in Appendix 2
of Slunga et al. (1984)), which probably has direct implications for the SKI (1992) anchoring point considering the low rate of earthquakes of that size. The revisions imply that Fencat is soon ready for a modern study of earthquake hazard in the Baltic Shield. However, since the Norwegian and Danish catalogs are still under revision, a study of seismic hazard to Swedish nuclear power plants, using a standard circular area with 500 km radius, will require further scrutiny of the relevant Norwegian and Danish entries in Fencat.
We see clearly in Figure 2 how seismic activity varies spatially in Fennoscandia and how most of the larger magnitude events are associated with the Norwegian west coast region. We may not have been able to reproduce the exact same magnitude/moment
homogenization scheme as SKI (1992), the blue circles in Figure 2 show events with our estimated moment larger than 1015 Nm. However, it is unlikely that SKI (1992) would
have a significantly different number, or distribution, of these events. Figure 2 then shows how important it is to properly define which area is included in the calculation of the “seismicity function”. We also note that there are very few larger magnitude events in the
Baltic Shield (i.e. the region from the Swedish-Norwegian Caledonian mountain range to western Russia), four events prior to 1988 and two events after. Looking more in detail at the post-1987 map in Figure 2, we see the two, surprising, earthquakes with moment magnitudes around 5 in Kaliningrad in 2004. These occurred unexpectedly in an area which has seen very little seismicity in the last centuries (Gregersen et al., 2007). The blue circle in the North Sea west of Jutland is an event in the Ekofisk oil field in 2001 induced by water injection (Ottemöller et al., 2005) and it would therefore be excluded as man-made in a seismic hazard analysis. The remaining two larger events belong to the Norwegian west coast seismicity and occurred in 1988 and 1989.
The Fennovoima (Korja & Kosonen, 2015) and TVO/Fortum seismic hazard projects used the Fencat earthquake catalog for the PSHA. Just as in SKI (1992) the magnitudes had to be homogenized but this was done not by conversion to scalar seismic moments but instead to moment magnitudes. The homogenization process took advantage of the seismic moments routinely calculated by the SNSN and then added published information on moments for Fennoscandian events, usually for single larger events. The homogeniza-tion process is based on the local Helsinki magnitude scale, and the result is a piece-wise linear function between seismic moment and magnitude, with one linear relationship for moments below log(M0) = 13.5 and another linear relationship for larger moments. The
details of this is not yet in the public domain. As the homogenization process was per-formed primarily for events within the zones of interest for these two studies, it is not possible to directly apply to all event of interest for a similar Swedish study, as the Nor-wegian events would have to be investigated in more detail first.
3.3. Earthquakes in Sweden 2000 – 2016
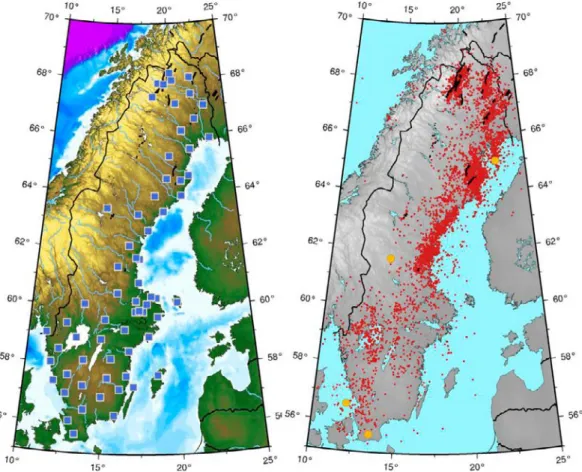
The modernization and expansion of the Swedish National Seismic Network (SNSN) from 1998 to 2012 (Bödvarsson & Lund, 2003; Bödvarsson et al., 2006) has provided a significantly more detailed picture of earthquake activity in Sweden than was previously available. Figure 4A shows the current station network and Figure 4B shows the
seismicity. Comparing Figures 2A and 4B, we note that the large scale features are the same, the northeast coast and the Vänern areas have the highest seismicity whereas the mountain range and the southeast have very low seismicity. Perhaps the most striking difference between the two maps is the clearly mapped seismicity along the endglacial fault scarps in northern Sweden. Pärvie, Lainio, Merasjärvi, Lansjärv and the Burträsk faults are all seismically active and the events occur along and southeast of the fault scarps, as expected from the inferred reverse mechanisms, with faults dipping to the southeast. Although the large ruptures are inferred to have occurred some 10,000 years ago, the faults are still active. Other pronounced areas of earthquake clustering are the events in a north-south extension in the Bay of Bothnia, and a northeast-southwest
lineament of seismicity from north of Hudiksvall to Arbrå, which has no obvious geologic structure associated with it. Since the SNSN is able to record very small earthquakes, down to magnitude -1, we start to see more activity on some structures where earthquakes have been previously absent, or very rare. One such location is on a branch of the
Tornqvist zone, on land from the Bjäre peninsula eastward along Hallandsåsen, which potentially links the area of magnitude 4+ events in Kattegatt with an onland extension. Other locations are the weak line of earthquakes coincident with the
Lillsjöhögen/Ismunden endglacial fault and the line south of the Burträsk fault. During the time period of the modern SNSN four events with magnitude larger than 4
have occurred in, or in close vicinity to, Sweden: the 2008 M4.3 Lund, the 2012 M4.1 Kattegatt, the 2014 M4.1 Sveg and the 2016 M4.1 Bottenviken events. This is an interesting temporal clustering of large events, as no earthquake with magnitude above 4 occurred between 1986 and 2008 in Sweden. Incidentally, a similar cluster of four M4+ events occurred between 1983 and 1986. Temporal clustering thus seems to be a recurring phenomenon and these temporal clusters and the long hiatus in between strongly suggests that the occurrence of larger events is not stationary in Sweden. In SKI (1992) A2, Slunga points out that two of the largest events in Fennoscandia, the 1819 Lurøy and 1904 Oslofiord events, occurred in areas which did not have a high prior seismic activity. Although significantly smaller, the recent M4+ events follow a similar trend. The Lund and Kattegatt events may be associated with the geologically very significant Tornqvist zone, but there is not much prior seismicity there, see Figures 2 and 4. The Bottenviken event occurred in a more seismically active region, whereas the Sveg event occurred in an area almost void of earthquake activity, Figures 2 and 4.
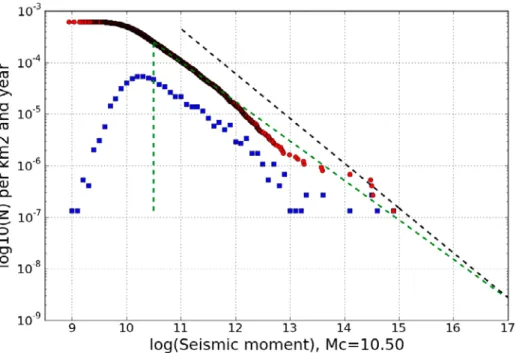
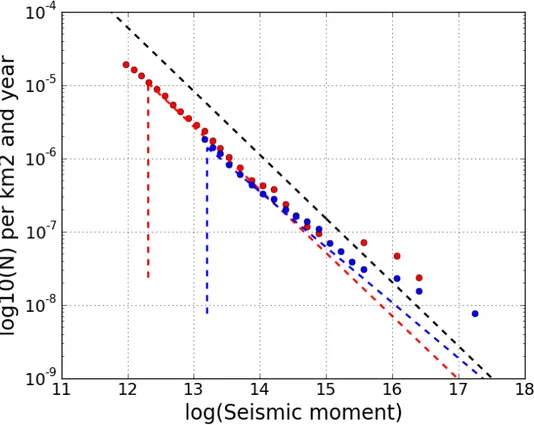
Since the modernization of the SNSN in 1998 local magnitudes are calculated using a seismic moment based scale derived from the work of Slunga et al. (1984). In Figure 5 we show the frequency-moment curve for earthquakes occurring within the SNSN network (and azimuthal gap less than 180 degrees) between 2000 – 2016. In addition, all four M4+ events are in Figure 5, in-spite of the fact that not all of them have an azimuthal gap of less than 180 degrees. The number of events has been normalized to the area covered by the outermost stations of the SNSN, 465,983 km2 and the 16 years of
operation of the modern SNSN. It should be noted that the SNSN expansion took place over many years, starting in 2000 and finishing in 2012, which distorts the areal normalization. This has not been taken into account here. The b'-value (using the nomenclature of SKI (1992)) for the SNSN data is 0.77, estimated after Aki (1956) and Marzocchi & Sandri (2003) and with a formal uncertainty of 0.02. In Figure 5 we have also added the seismicity function of SKI (1992). We see that the frequency-moment distribution lacks events with moment larger than 1015 Nm, and that there is a deficiency
of events with moment higher than about 1013 Nm. There is also a bending of the curve
starting just below 1012 Nm, which is similar to the bend in Slunga's curves in Figure 7 in
SKI (1992) Report No. 1. The SNSN curve cuts 1015 Nm at 8.8·10-8 events per square
kilometer and year, below the SKI (1992) seismicity function at 1.5·10-7. However, due to
the lower b'-value the SNSN function predicts a larger number of events with moment above 1017 Nm. The formal uncertainty of the b'-value is very small, due to the large
number of events in the calculation. As is evident from Figure 5, that uncertainty is not appropriate to describe the uncertainty associated with the SNSN frequency-moment distribution for extrapolation beyond the data, and not even for the larger events in the data, as the distribution is not linear. The non-linearity could be due to the short period of observation, methodological problems in assessing the moment for large and small events consistently or actual physical differences in the faulting mechanisms.
Figure 4. Left) Stations in the Swedish National Seismic Network (SNSN). Right)
Seismicity recorded by the SNSN between 2000 and 2016 (red circles), events with magnitude 4 or larger (orange circles). Black lines show endglacial fault scarps.
Figure 5. Frequency – seismic moment distribution of the events recorded by SNSN
be-tween 2000 – 2016 which have an azimuthal gap of less than 180°. Cumulative numbers (red circles), histogram (blue squares), the green dashed lines shows the “moment of
completeness”, Mc = log(M0) = 10.5, and the b' = 0.77 ± 0.02 line. The black dashed line
4. Temporal and spatial variations in seismicity
At plate boundaries, large earthquakes tend to occur in relatively well defined zones in the vicinity of the boundaries. Just as important is that large earthquakes tend to recur in the same zones. This is in contrast to intraplate seismicity where there is still considerable uncertainty as to where large earthquakes occur and whether or not they tend to recur in similar locations. Much interest in intraplate seismicity has been fueled by the New Madrid earthquakes in central USA (e.g. Stein et al., 2009), and the efforts to estimate seismic hazard in the region. With even the most recent GPS networks being unable to detect strain accumulation in the New Madrid region, Stein et al. (2009) propose that intraplate seismogenic faults interact in a complex system which cannot be understood by analyzing an individual fault, and that hazard assessments focusing on recent seismicity therefore may overestimate the risk in one region and underestimate it in another. The model has been proposed also for the migrating system of large events in northern China (Liu et al., 2011), where in the last 2000 years no large earthquake has occurred on the same fault twice. Calais et al. (2016) go one step further and propose that the concept of recurrence for large intraplate earthquakes may even be incorrect. Instead they argue that earthquakes in stable continental regions (SCR) are better explained by transient
perturbations of local stress or fault strength that release elastic energy from a prestressed lithosphere. As a result, they propose that SCR earthquakes can occur in regions with no previous seismicity and no surface evidence for strain accumulation.
In Fennoscandia, the crustal deformation field is dominated by glacial isostatic
adjustment (GIA) both in the vertical and horizontal directions (e.g. Lidberg et al., 2010; Kierulf et al., 2014). Any estimate of a tectonic signal in the strain rate field must therefore attempt to remove the GIA affect, which is very difficult within the uncertainty limits of the GPS signal (e.g. Scherneck et al., 2010; Keiding et al., 2015). It has not been possible to estimate strain accumulation on individual fault systems in Fennoscandia, which makes it very difficult for quantitative models of temporal and/or spatial variations in seismicity. Stress measurements and focal mechanisms in Sweden and Finland
generally show strike-slip to reverse faulting conditions (e.g. Slunga, 1991; Lund & Zoback, 1999; Uski et al., 2003, 2006; Heidbach et al., 2008) with the maximum horizontal stress directed approximately NW-SE. This has led a number of authors to conclude that the Fennoscandian stress field is dominated by ridge-push (e.g. Slunga, 1991; Bungum et al., 2010). Redfield & Osmundsen (2015) on the contrary propose that Fennoscandian seismicity is principally the product of locally derived stress fields and that far field stress from the oceanic domain is unlikely to penetrate deeply into a hyperextended continental margin.
In the subsections below we investigate events in the Fencat catalog located east of a line along the Swedish-Norwegian border down to Zealand in Denmark, for which
magnitudes have been homogenized. The homogenization scheme is the one developed in the Finnish nuclear power plant projects discussed in Section 1 and is a magnitude scale based on scalar seismic moments and scaled to be consistent with the Helsinki local magnitude scale. The details of this are not yet in the public domain but will be released. Homogenized magnitudes are important in the comparisons below as a difference in magnitude of 0.3 translates to a factor of 2 difference in occurrence rate, if the b-value is close to 1.
4.1. Temporal variations
Already the descriptions of the Fencat data above make it clear that there will be temporal variations, such as varying numbers of reported earthquakes per year or the number of events larger than a certain magnitude per year. The largest sources of temporal variation are the variation in observation techniques, and in the pre-instrumental period varying interest in earthquakes as a phenomenon and to some extent also variations in population density. Extracting information on real, physical, temporal variability from the data is therefore not easy in our low seismicity area.
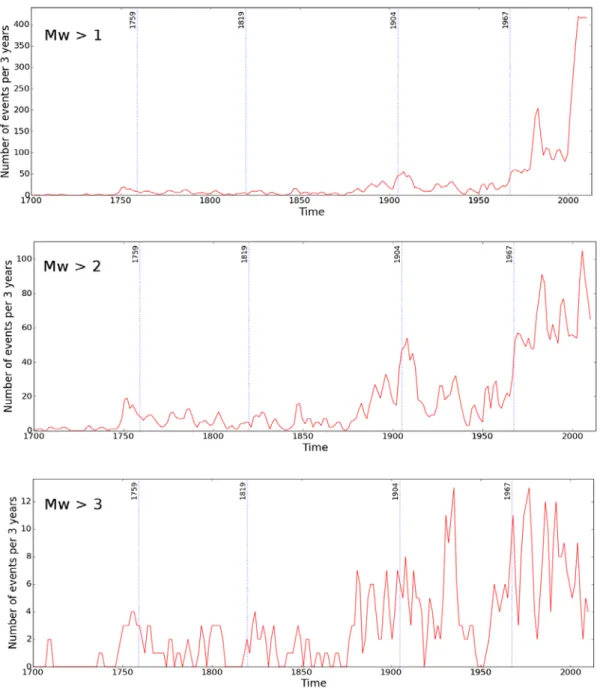
In an attempt to study temporal variations in the data we use the homogenized catalog for Sweden, Finland and the Baltic described above. In Figure 6 we plot the number of events in three-year central sliding windows for three different magnitude intervals, magnitudes larger than 1, 2 and 3. The upper panel in Figure 6 clearly shows the impact made by the modernization of the Swedish and Finnish seismic networks in the early 2000s, when the rate soars. The peak in the 1980s is due to the FOA network in Sweden, a temporary deployment of seismic stations that was significantly more dense, and more modern, than the then existing permanent network. The middle panel provides a better picture of the earlier seismicity. This shows the improvement in detection and location that came about through the modernization and expansion of the seismic networks in the mid to late 1960s and this figure seems to indicate that after approximately 1970 we record most of the magnitude 2 and larger events in Sweden and Finland. We still see a peak associated with the FOA deployment, and peaks in 1994 and 2006 which require further investigation before they can safely be deemed to have a natural cause. The middle panel also shows a concentration of events in the early 1900s, with the 1904 earthquake and its aftershocks and perhaps an elevated general awareness of earthquakes after the 1904 event and the 1908 Messina disaster. We see a significant decline in seismicity during the two world wars, and in their aftermath. This is probably to some extent an artifact of a lower public focus on earthquakes. Finally, the middle panel shows a marked change in awareness and interest after the events of the 1750s. First the Swedish north coast event of November 1751, then the Lisbon earthquake of 1755 and finally the large 1759 Kattegatt earthquake. In the lower panel of Figure 6 we show the variation in magnitude 3 or larger events. We now see the effect of the start of systematic gathering of earthquake related data in the late 1870s. Again there are dips in the rates during the two world wars and well into the postwar 1950s. The cause of this absence of M3+ events is not clear to us. There seems to have been a decline in M3+ events since 2000, when the seismic networks grew. It should be more closely investigated if this is related to methodological differences in the pre- and post-2000 periods. Although the simple qualitative analysis above cannot provide proof of either stationarity or non-stationarity, the occurrence of the very largest events, with magnitudes of 4 or larger, strongly indicate non-stationary behavior, as discussed in Section 3.3 above.
It should be pointed out that Figures such as Figures 6-8 can become a little complicated when aftershocks are taken into account. There are clearly aftershocks to the 1904 event in Figure 6 in the upper and middle panels, which broadens the peaks. Even smaller events, such as a magnitude 3 event could have aftershocks of magnitude 2. Aftershock sequences in intraplate regions may also last for a very long time (e.g. Stein & Liu, 2009). In addition, there seems to be a general increase in earthquake awareness after larger events, as clearly seen in the historical data. These figures must therefore not be interpreted as temporal variations of independent events.
Figure 6. Temporal variation in the number of earthquakes in a sliding three year period
in Sweden, Finland and the Baltic from 1700 to 2012. Homogenized magnitudes. All events above magnitude 1 (upper), 2 (middle) and 3 (lower). Large Fennoscandian events are indicated by blue dotted lines.
In general, however, we observe that the recent large events in Sweden have had very few, less than 10, aftershocks with generally very low magnitudes, less than 1.5. Real physical temporal variations seem difficult to conclude from the data set used in Figure 6. It may be easier if a more confined area is considered, one with a higher seismicity rate. In Figures 7 and 8 we repeat the exercise by extracting data from southwest Sweden, Figure 7 and the Burträsk area, Figure 8.
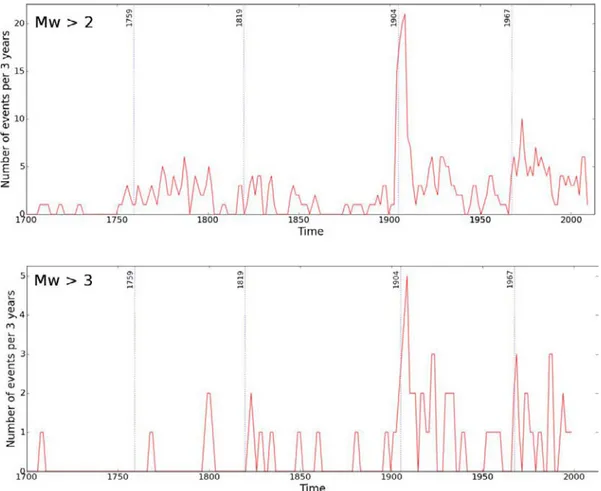
The data in Figure 7 come from an area approximately from Skagerack to Vättern east-west (longitude 11.2 to 14.7) and from Göteborg to Sunne (latitude 57.8 – 59.8) north-south. The panels mirror some of the features we observed for the whole data set, such as the significant change in observations from about 1750, the peak after 1904 (this area includes the 1904 earthquake and aftershocks), the low activity in the 1940-1950s and the increase after 1970 due to better seismic networks. A little surprising is the hiatus after about 1860 and the lack of the clear increase associated with better reporting in the 1870s.
Figure 7. Temporal variation in the number of earthquakes in a sliding three year period
in southwestern Sweden from 1700 to 2012. Homogenized magnitudes. All events above magnitude 2 (upper) and 3 (lower). Large Fennoscandian events are indicated by blue dotted lines.
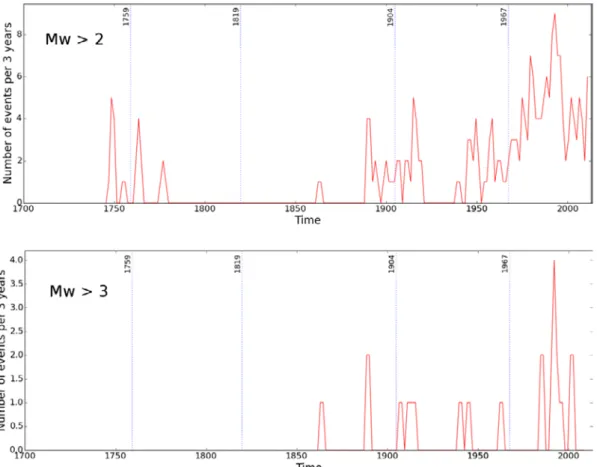
The Burträsk seismicity is displayed in Figure 8 and although we see in the data from about 1970 onward that it is just as seismically active as southwestern Sweden (the Bur-träsk area here is only 30% the size of the southwestern Sweden area above), the data from the early times are quite different. The events in 1750 have clearly left their mark in Figure 8, and this is due in part to Mr. Gissler, a teacher in Härnösand who enthusiastical-ly studied events in northern Sweden between about 1710 to 1760. There is then a long time period of almost no events until the resumption of earthquake studies in the 1870s. Interestingly, the Burträsk region has some seismicity during the wars, but virtually no larger activity between 1920 and 1939. This is an interesting point which should be fur-ther looked into.
Figure 8. Temporal variation in the number of earthquakes in a sliding three year period
in the Burträsk area, northern Sweden from 1700 to 2012. Homogenized magnitudes. All events above magnitude 2 (upper) and 3 (lower). Large Fennoscandian events are indicated by blue dotted lines.
In summary we see that the apparent temporal variations in seismicity are mostly affected by human activity and interest, and with little chance to draw solid conclusions on the behavior of the Earth's crust. Only for the very largest events does there appear to be some level of significant non-stationarity, as discussed in Section 3.3. Due to the low sensitivity of early seismic networks and the low seismicity rate we may have a larger chance to find variations that could be related to the crust itself if we study small events in a small area. Such studies may provide very relevant results, but may also only be ap-plicable to the studied area.
4.2. Spatial variations
That there are spatial variations in the Fennoscandian seismicity has been clear since at least the start of more systematic collection of earthquake data in the 1870s. Kjellén (1910) published a seismicity map of Sweden, based only on pre-instrumental data, which is very similar to the seismicity distribution we observe today, except that he had no ob-servations from the endglacial faults of northernmost Sweden. We have discussed spatial variability above and will not discuss it in any detail here, but in the maps in Figure 2 and 4 we see that on the large scale there are significant spatial variations in seismicity both in Fennoscandia and within Sweden. Any determination of earthquake rate will therefore be