Kalmar ECO-TECH '07 KALMAR, SWEDEN, November 26-28, 2007
INDUSTRIAL SOLID WASTE STRATEGIES AND
POLICIES FOR THE SOUTH REGION OF RIO
DE JANEIRO STATE
Dar/an Pereira
1Manuel Fonseca Almeida
1 1University of Kalmar, Sweden
2University of Porto, Portugal
ABSTRACTThe aim of this investigation was to propose guidelines (based on Europeans strategies and policies) in order to develop a plan for the industrial solid waste management in the South Region of Rio de Janeiro State (Brazil), This region is an industrial area with significant waste management problems. In order to properly manage waste production in this region, one must know the amount, type, and composition of industrial wastes, as well as the management practices of the industries involved. In this investigation, questionnaires and secondary data analysis were used to collect infonnation regarding methods of waste management used in 30 large-size manufacturing industries that produce 5.5% of the total waste generated. It was observed that paper and cardboard, plastic, wood, and metals were the most common types of waste, mainly generated from packaging (69% of the total volume), as well as material used in containers and for unwrapping products. Serious problems were observed, like industrial solid waste being sent to municipal landfills and irregular dumping. An overview of the current solid waste management situation gives rise to a brief discussion on waste-to-energy opportunities and an integrated industrial waste management system for the region.
KEYWORDS
Industrial waste; Waste management; Waste fuel. I. INTRODUCTION
The economy of all developed societies is based on production and consumption of products and services. Industries, like other waste sources, are associated with numerous waste-related environmental problems. In the last decade, the global economy has undergone radical changes that have had significant implications for the development of industrial operations [ 1 ,2].
There is no specific model that can be applied in any environmental management system; however, waste management strategies can be defined following a particular hierarchy: minimization, recovery and transformation, and land disposal [3). Most industrialized nations has been adopting this hierarchy as the menu for developing solid waste management sustainable strategies, such as integrated waste management. Sustainable waste management means waste management systems that are environmentally effective, economically affordable and socially acceptable for a particular region and its individual circumstances.
A wide range of waste management systems currently operate in Europe, such as energy recovery and a material recovery system developed in Sweden [I] and co-processing of waste by cement industry in the United Kingdom and France (4]. An evolutionary trend has been observed that begins with waste management primarily addressing the issue of public health and safety introducing a new concept: "eco-industrial park", which integrates business, environmental excellence, and community relations to create economic opportunities and improved ecosystems (4,5].
The European environmental policies are an example that can be followed by developing countries. It is based on the belief that high environmental standards stimulate innovation and business opportunities, integrating social aspects and environmental policies.
2. THE SOUTH REGION OF RIO DE JANEIRO STATE
The attention given today to the production of solid waste is incipient and, unfortunately, in Rio de Janeiro State (Brazil), it is disproportional to the population growth and inadequate to the industrial development. In the last decade, the accelerated industrialization and economic development have caused a huge increase in solid waste generation. The annual disposal of solid waste increased from I 2,300 tons in I 989 to I 6,200 tons per day in 2000.
No official criteria for solid waste were established in Brazil. The National Policy of Waste (Project of Law no. 203/9 I), that has been discussed for I 5 years, is still waiting for approval in the Brazilian Congress.
The South Region of Rio de Janeiro State (SRJ) produces 76% of the total industrial waste in the State and 38% of hazardous waste. This Region is also characterized by many environmental protection areas, such as parks and forests, which are visited by Brazilians and foreigners throughout the year. Those areas are surrounded by urban centers with companies, businesses, and industries, which try to coexist in harmony in the region.
The SRJ is not the main industrial area of Rio de Janeiro State; most industries have medium to small sizes. The economic activity is mainly related to manufacturing processes, such as: chemicals, metals, motor vehicles, and textiles. There are I ,636 manufacturing industries in SRJ that produce more than 80% of the industrial waste in the region, as estimated by the environmental protection agency of the State [6].
Some difficulties were experienced during the collection of reliable data regarding the industrial solid waste generation. The Environment Ministry Resolution known as CONAMA 3 I 3/2002 obliged all Brazilian States to perform an "Industrial Solid Waste Inventory", as the accuracy and volume of data were not enough and reliable to endorse a deep analysis at that time. The Final Report about industrial waste produced in Rio de Janeiro has not been concluded yet, but partial surveys estimate that the Rio de Janeiro State generates 4 I 7,700 tons of industrial waste per month, of which 24,700 tons are hazardous waste.
The unreliable estimate of waste generation in the SRJ is only one of the problems of the region, as approximately 50% of the industries in activity do not have an efficient system of waste management that operates in compliance with Brazilian policies and standards. This percentage includes industries that have already reported environmental accidents or received notifications issued by the state environmental agency [7].
Kalmar ECO-TECH '07 KALMAR, SWEDEN, November 26-28, 2007
Other problems regarding industrial waste management in the SRJ were identified by local governments or reported by industries; in particular, some wastes are illegally dumped in areas not designated for that purpose and industrial solid waste are disposed of in municipal landfills. Besides that, some kinds of wastes that could be recycled or reused are dumped in landfills,
There is no exchange of infon11ation between waste generation and management systems in the industries of the SRJ. To change this scenario, an implementation of an integrated waste management system could decrease pollution, reduce the negative environmental impact, and actively promote waste minimization as a solution to waste management. However, the design of such a system must be based on waste characterization: types and amounts produced. Waste characteristics also provide essential data for planning waste treatments and disposal facilities.
Most European countries are committed to develop and implement waste-to-energy technologies associated with energy recovery, composting for waste avoidance, and recycling and reuse. In Brazil, the concern is still about the best options to treat and dispose of waste. This investigation was developed according to the scenario of inadequacy of the industrial solid waste management in the South Region of Rio de Janeiro State (SRJ) and the potential improvements on recycling, energy recovery, and waste disposal, which aims to explore alternatives for the industrial solid waste management based on European policies and strategies,
The study was performed through a preliminary survey of industrial solid waste generated by 30 industries in the SRJ, which includes analyses of waste characterization, waste management systems, and disposal practices.
3 METHODS
3 . I. Classification of industrial activities
The amounts and types of industrial wastes are connected to characteristics of each industrial activity. In this paper, industrial activities were classified according to the Nomenclature Statistic of the Economic Activities in the European Community, Rev, 2 (NACE Rev.2). 3.2 Waste classification
Among the methods to analyze the production and types of industrial waste [8], two were chosen: a questionnaire survey and an empirical approach using available industry infon11ation for complementary data.
The Environment Ministry Resolution CONAMA 313/2002 presents a questionnaire to be applied for the inventory of wastes in each Brazilian State. Information such as the amount and type of industrial wastes generated, details of the waste management, and control methods used is required. Other information include: classification of industrial activity and geographic localization; number of employees; number of employees involved in the production line; type of waste produced and at which point in the process; volume of waste per month; waste management practices for each type of waste produced; type of storage and containers; final disposal methods and geographic localization; and private companies for waste management, transport and disposal,
The codes for waste classification present in the original questionnaire suggested by CON AMA 313/2002 were replaced by the European list of waste (Directive 2000/532/EC) in order to obtain more details about the waste characteristics and types for each industry. The questionnaire was sent to 30 selected industries in the SRJ. A total of 16 correctly answered questionnaires were collected. To complete the infonnation, estimates based on other available industry information were performed (empirical approach). Data from industrial activity, production process, water and energy consumption, number of staff involved in the production process, type of raw material used, and consumption were collected for the estimating process.
Two other sources were used for this estimation process: similar industrial process data available in different Brazilian States and Best Available Techniques (BAT) reports [9], 4. RESULTS
4.1 Classification of industrial activities
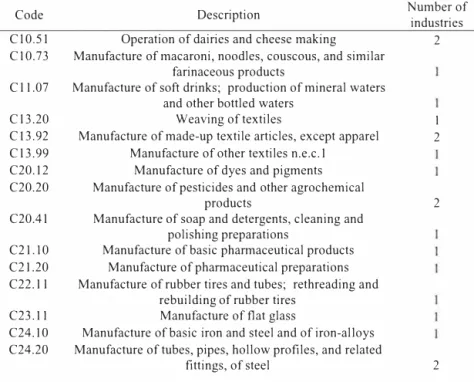
Table I shows the classification of the industrial activities selected in the South of Rio de Janeiro State (SRJ).
Table I: Industrial Activity classification.
Number of
Code Description industries
CI0.51 Operation of dairies and cheese making 2
CI0.73 Manufacture of macaroni, noodles, couscous, and similar farinaceous products
Cl 1.07 Manufacture of soft drinks; production of mineral waters and other bottled waters
Cl3.20 Weaving of textiles I
Cl3.92 Manufacture of made-up textile articles, except apparel 2 Cl3.99 Manufacture of other textiles n.e.c. I
C20.12 Manufacture of dyes and pigments C20.20 Manufacture of pesticides and other agrochemical
products 2
C20.41 Manufacture of soap and detergents, cleaning and polishing preparations
C2LI0 Manufacture of basic pharmaceutical products C21.20 Manufacture of phannaceutical preparations C22.ll Manufacture of rubber tires and tubes; rethreading and
rebuilding of rubber tires C23.II Manufacture of flat glass
C24.I0 Manufacture of basic iron and steel and of iron-al Joys C24.20 Manufacture of tubes, pipes, hollow profiles, and related
Kalmar ECO-TECH '07 KALMAR, SWEDEN, November 26-28, 2007
Table 1: industrial Activity Classification (continued),
C24.31 Cold drawing of bars
C25.29 Manufacture of other tanks, reservoirs, and containers of metal
C25.50 Forging, pressing, stamping, and roll-fonning of metal;
powder metallurgy 4
C29.I0 Manufacture of motor vehicles 2
C29.3 I Manufacture of electrical and electronic equipment for motor vehicles
C29.32 Manufacture of other parts and accessories for motor
vehicles 3
1 not elsewhere classified 4.2 Wastes characterization
Table 2 shows the total of industrial wastes produced in SRJ as 21,965 tons per year. The
hazardous wastes represent 6.3% of the total waste produced. The industrial solid waste produced by the selected industries were characterized and summarized, as follows:
(I) Wastes classified by "waste packaging; absorbents, wiping cloths, filter materials, and protective clothing not otherwise specified" are the most frequent waste produced by all of the industrial activities in SRJ. Detailed data for this type shows that paper and cardboard packaging represents 32% of the total produced; plastic packaging, 17%; wooden packaging, 26%; and metallic packaging, 14%,
(2) Under the code "wastes not otherwise specified in the list", one must pay special attention to the amount of end-of-life vehicles and their components produced, such as tires (396 tons per year), metals (892 tons per year), and glass (3 15 tons per year),
(3) Regarding the code "inorganic wastes from thermal processes", there is a considerable fraction of wastes from the iron and steel industry, such as unprocessed furnace slag (675 tons per year), slag (370 tons per year), mill scales (67 tons per year), and sludge (162 tons per
year).
(4) From the manufacturing of pesticides and other agrochemical products, the main type of solid waste is a small fraction of dust from cyclones in the exhaust gases from dry process part (8,4 tons per year),
(5) Wastes from "the food preparation and processing" have a large contribution for the biodegradable waste, as materials unsuitable for consumption or processing ( 48 tons per year) and reJects of the process line and cleaning of equipments ( 12 tons per year), There is also a percentage of sludge from on-site effluent treatment (98 tons per year) to be considered, (6) Metal surface treatment industries produce 3% of the total solid waste. There is a considerable fraction of solid waste produced as sludge and solids from quenching processes (317 tons per year); however, that sludge contains 60-80% of water. Both wastes contain cyanide and, therefore, are hazardous waste,
(7) Sludge from effluent treatment ( 187 tons per year) is the main type produced by the organic chemical processes.
(8) The composition of wastes from the MFSU of coatings, adhesives, sealants, and printing inks are mainly sludge from paint or varnish that represents 88% of the total waste under this topic.
(9) Municipal wastes and similar collected fractions represent mostly: paper and cardboard (212 tons per year), glass (4.3 tons per year), small plastics (30.2 tons per year), organic kitchen waste (777.9 tons per year); and metals (17.9 tons per year).
(IO) Wastes from the textile industry are comprised mainly of sludge from on-site effluent treatment (358 tons per year), whereas 20% is hazardous waste. Other important fractions are: waste from unprocessed textile natural fibers (21 tons per year) and waste from finishing operations (31 tons per year).
Table 2: Industrial solid waste produced in SRJ
Code Description Ton/year
02 wastes from food preparation and processing 215
04 wastes from the leather, fur, and textile industries 550
06 wastes from inorganic chemical processes 539
07 wastes from organic chemical processes 305
08 wastes from the manufacture, formulation, supply, and use (MFSU) of coatings (paints, varnishes, and vitreous enamels), adhesives, sealants, 41
and printing inks
IO inorganic wastes from thermal processes 1290
11 inorganic metal-containing wastes from metal treatment and the coating of metals, and non-ferrous hydrometallurgy 605 12 wastes from shaping and surface treatment of metals and plastics 159
13 oil wastes (except edible oils, 05 and 12) 41
14 wastes from organic substances used as solvents ( except 07 and 08) 24 15 waste packaging; absorbents, wiping cloths, filter materials, and
protective clothing not otherwise specified 15217
16 wastes not otherwise specified in the list 1936
20 municipal wastes and similar commercial, industrial, and institutional
wastes including separately collected fractions 1043 4.3 Waste management
About 77% of the wastes produced are managed through goods practices, while the remaining 23% have various management problems.
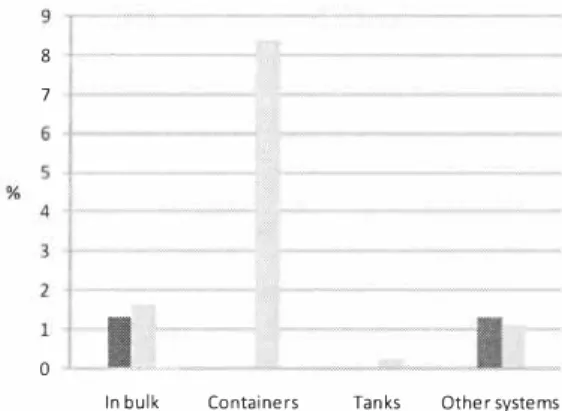
A concern in the South Region of the Rio de Janeiro State (SRJ) industries is the storage of industrial hazardous waste. The reason for this practice is the ignorance of the options for waste treatment by these industries. According to Figure I, storage in containers is the main practice; however, only 15% of the stored waste is temporary, such as sludge from automotive coating process.
Kalmar ECO-TECH '07 KALMAR, SWEDEN, November 26-28, 2007
The disposal of industrial waste in municipal landfills is performed by 20% of the industries.
Figure 2 shows that 7% of the waste produced is irregularly dumped in areas near the generation source; there is no industrial landfill in the SRJ. A small group of chemical industries has their own landfill. More than one third of the industries have no infonnation about the disposal of their waste; in these cases, an external waste management company is contracted. 8 7 ■ Non-hazardous wastes Hazardous wastes
I_
0In bulk Containers Tanks Other systems Figure/: Storage method for industrial solid wastes in SRJ.
25 20 15 % 10 0
I
I
I
I
■ Non-hazardous wastes Hazardous wastesMunicipal Animal Industrial Irregular Private Others landfill feed landfill dumped Industrial
landfill
Figure 2: Distribution of final disposal techniques used by the SRJ industries.
Figure 3 shows that more than 30% of the waste produced, including 5% of hazardous wastes, is recycled; however, 35% of these wastes are reused by the same industry, as metals in the metallurgic process and waste glass in the manufacture of glass. The disposal of the remaining part is perfom1ed by contracted waste management companies that pick up the wastes in the industry and dump them in different points outside the SRJ.
45
KALMAR, SWEDEN, November 26-28, 2007
No composting treatment has been applied for the biodegradable fraction of the wastes. The wastes with this characteristic are sent to municipal landfills.
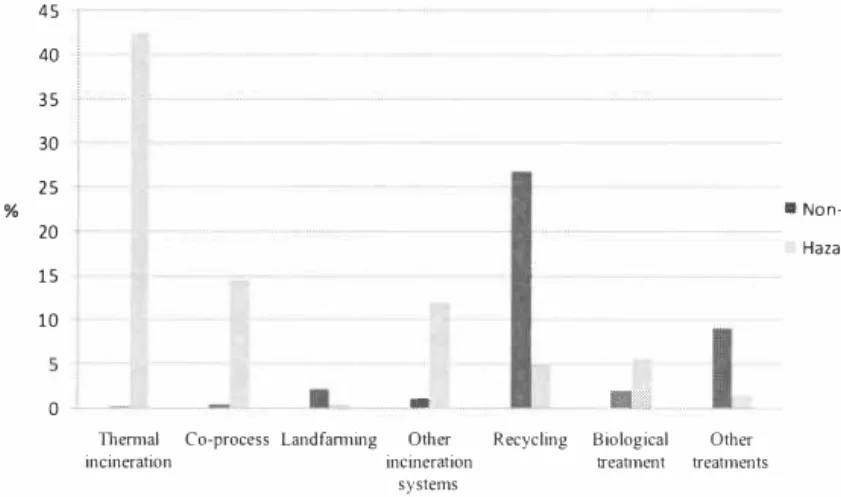
Paper and cardboard are correctly managed by recycling in 75% of the cases, as well as 85% of plastics, 75% of woods, and 3 I% of tires. Thermal destruction and energy recovery from hazardous wastes is applied in 81% of the total produced.
There are few industries that have had implemented transfom1ation processes for the waste generated. There is a greater tendency to recycle wastes in sectors such as glass, metal, and wood (from packaging and pallets) in other regions of the State.
According to the survey data, 70% of the industries have an effective waste management system. The others were interested in being involved in waste management activities. However, only 7 out of 30 industries had a quality certification in compliance with ISO nonns. 40 35 30 25 % • Non-hazardous wastes 20 Hazardous wastes 15 10 0
-
ILThem1al Co-process Landfanning Other Recycling Biological Other
incineration incineration treatment treatments
systems
Figure 3. Percentage of industries practicing waste management treatment. 5 DISCUSSION AND CONCLUSION
CON AMA 313/2002 has been applied in Brazilian States by a standardized questionnaire for data survey of industrial waste generation. The same methodology was used in this investigation. The only change was the original codes for waste classification, which were replaced by the European list of waste. The differences between the Brazilian standard classification and the European list of waste arose many questions during this process and to complete the data, an empirical method using available industry infonnation has been developed. The data obtained provided an approximation of the amount of wastes generated and the treatments applied.
The importance of planning new strategies for the industrial solid waste management will increase with the progress of the implementation of the National Policy of Waste in Brazil (Law Project no. 203/91 ), as happened in Europe with the Directive 2006/ l 2/CE.
Kalmar ECO-TECH '07 KALMAR, SWEDEN, November 26-28, 2007
The survey of waste treatment in the South Region of Rio de Janeiro State ( SRJ) shows a low percentage of non-hazardous wastes incinerated and co-processed. These alternatives have not been given a top priority regarding other waste treatment and disposal methods. There is a large potential for increasing the percentage of waste used as fuel through incineration and co processed in the cement industries present in the Rio de Janeiro State.
As a basic rule, wastes accepted as fuel for co-processing must give an added value for the cement kiln: calorific value from organic part and material value from the mineral part [ I O J , More than 70% o f the total waste produced i n the SRJ could b e better applied as fuel b y co processing, including wastes such as: tires, plastic, paper and cardboard (packaging include), waste oils, sludge from paints, sludge from waste water treatment, and others.
The cost of transporting small amounts of wastes is one of the problems faced by industries in the SRJ that limits the alternatives of waste management, available in and outside of the State. Different transport legislations and policies in each Brazilian State regarding wastes and their management is another problem faced not only by industries in the Rio de Janeiro State, but in other industries in Brazil. An overview in the European policy for waste transports inter Member States could benefit the development and improvement of new policies that guarantee the isonomy among the Brazilian States.
The industrial waste disposal in municipal landfills, irregular dumping and waste storage are the lower cost solution for these l ocal industries, although the environmental impact is high.
The main objective of an effective and efficient local waste management strategy is to develop an industrial waste management system which maximizes the benefits of each component, minimizes costs, maximizes environmental protection and public acceptance, besides being flexible enough to be adapted to changing circumstances [ I I ] , The direct benefit for the industries in the SRJ is a reduction of transportation and waste treatment costs. As a consequence, the reduction of waste disposal in industrial and municipal landfil ls, including irregular dumping of waste, wil l be the main benefit for the population and environmental protection.
Planning industrial solid waste management on a local region is not an easy task, as one needs to take into consideration data as: transportation, storage, handling, and treatment [ I 2 ] ,
The selected industries represent only 2% o f the total i n activity i n the South Region o f Rio de Janeiro State and they produce 5.5% of the total industrial solid waste in the Region. Waste management problems in large-size industries are less complex than the ones in small-size industries. Industrial waste management practices are unknown for most small industries in the Rio de Janeiro State [ 1 3] .
While the percentage o f industrial waste disposal i n municipal landfills for large-size industries is estimated at 1 3%, for small -size industries that percentage is at least six times higher. Regarding the experience of industrial waste management systems, the current local waste management strategy for large-size industries is trying to propose ways to encourage medium and smal l-size industries waste management practices, e.g., to motivate industrial companies to apply cleaner production and support waste reduction efforts.
KALMAR, SWEDEN, November 26-28, 2007
ACKNOWLEDGEMENT
This project was supported by the Programme Al�an, the European Union Programme of High Level Scholarships for Latin America, scholarship no. E05M056745BR.
REFERENCES
( ! ) Hogland, W . , Stenis, J., 2000. Assessment and system analysis of industrial waste management. Waste Management 20, 537-543 .
( 2 ) El-Fadel, M . , Zeinati, M., El-Jisr, K., Jamali, D . , 200 I . Industrial waste management i n developing countries: the case o f Lebanon. Journal of Environmental Management 6 1 , 28 1 -300.
(3) Craighill, A. L., Powell, J. C., I 996. Lifecycle assessment and economic evaluation of recycling: A case study. Resources, Conservation and Recycling 1 7, 75-96.
(4) Raymond, P.C., Cohen-Rosenthal, E . , 1 99 8 . Designing eco-industrial parks: a synthesis of some experiences. Journal of Cleaner Production 6, 1 8 1-1 88.
(5) Deppe, M . , Leatherwood, T . , Lowitt, P . , Warner, N . , 2000. A Planner 's overview o f Eco industrial development. Proceedings of American Planning Association Annual
Conference, Eco-Industrial Session.
(6) HENN EY, A. C . , 2005. Controle da Poluic;iio para a manutenc;iio da qualidade ambiental:
Resfduos Solidos. Procedings of Rio Ambiente Tecnologia e Solm;:oes Ambientais, June 0 1 -03, Rio de Janeiro-RJ, Brazil ( 2005).
(7) Kelly, L . H . , Costa, A. F., Bariani L., Barbosa V . Y . , 2004 . Modelo de Gestao do Consorcio para Destinac;iio de Resfduos lndustriais - Um Estudo de Caso. Departamento
de Administ,·arao, Universidade de Taubate - SP - Brasil, 1 -9.
(8) Monahan, DJ., 1 990. Estimation of hazardous wastes from employment statistics. Waste
Management and Research 8, 1 45- 1 49.
( 9 ) European I P P C Bureau, 2005. Integrated Pollution Prevention and Control. Reference
document on the best available techniques for waste incineration, 5- 1 7.
( 1 0) L. Timberlake Edit, 2005. Guidelines on co-processing waste materials in cement production, Final Draft, 1 8 -20.
[ 1 1 ) Geng, Y., Zhu, Q., Haight M., 2006. Planning for integrated solid waste management at the industrial Park level: A case of Tianj in, China. Waste Management 27, 1 4 1 - 1 50. ( 1 2) Tietza-Stockinger, L, Fichtner, W ., Rentz, 0., 2004. A model to minimize j oint total
costs for industrial waste producers and waste management companies. Waste
Management and Research 22, 466-4 76.
[ 1 3) Sumula Ambiental, 2004. Federac; iio das Industrias do Estado do Rio de Janeiro ( FlRJAN ). Reseach: Gestiio para reaproveitamento de materiais nas industrias do Estado Rio de Janeiro. Sumula ambiental, Edic;iio especial, 3-5.