Current approaches on how to acquire and integrate external data into Data Warehouses
(HS-IDA-EA-03-409)
Carl-Fredrik Lauren (b00carla@student.his.se) Institutionen för datavetenskap
Högskolan i Skövde, Box 408 S-54128 Skövde, SWEDEN
Examensarbete på det dataekonomiska programmet under vårterminen 2003.
Warehouses
Submitted by Carl-Fredrik Lauren to Högskolan Skövde as a dissertation for the degree of B.Sc., in the Department of Computer Science.
2003-06-04
I certify that all material in this dissertation which is not my own work has been identified and that no material is included for which a degree has previously been conferred on me.
Warehouses
Carl-Fredrik Lauren (b00carla@student.his.se)
Abstract
Integration of internal data is often mentioned in literature as the most demanding task when building or maintaining a DW. There is no literature that outlines the approach for the integration of external data into a DW. The integration of external data has increased during the last years enabling corporations to understand the opportunities in the market and to be able to better plan for future success of the corporation. The aim of this work is to exploratory outline current approaches for acquiring and integrating external data into DW and to give a brief overview of the future trends for external data integration. This aim was researched using an interview study. The results show that how to integrate external data is depending on what the corporations purpose with the external data is. Additional results show that how to integrate external data also depends on how the data is acquired.
There are several people I would like to thank for their different kinds of support during my work on this dissertation. First, I would like to thank my supervisor Mattias Strand for his valuable support and comments. I would also like to thank my family for their help and support and furthermore Anders Svensson for his valuable comments. Last, but certainly not least, Åsa for her never-ending support and bearing with me during the process of writing this dissertation.
1. Introduction ... 1
2. Data Warehouse ... 2
2.1. History...2
2.2. Definitions of a Data Warehouse...3
2.3. Architecture of a Data Warehouse ...4
2.3.1. External data...5
2.3.2. Extraction, transformation and loading layer (ETL) ...7
2.3.3. Meta data repository and meta data...7
2.3.4. Data manager component, relational database and online analytical processing ...8 2.3.5. Data marts ...10 2.4. ETL in details ...11 2.4.1. Extraction ...11 2.4.2. Transformation ...14 2.4.3. Loading/ applying...19
3. Problem ... 21
3.1. Problem area ...213.2. Aim and objectives...21
3.3. Delimitations ...22
4. Research method... 23
4.1. Methodical considerations...23
4.2. Interview study ...24
4.3. Research process outlined ...26
5. Conducting the research... 29
5.1. Implementation of the research process ...29
5.2. Motivating the questions ...31
5.3. Reflection on the interviews ...31
6. Information presentation... 33
6.1. The respondents ...33
6.2. The interviews ...34
7. Analysis... 39
7.1.2. Different approaches for distribution of external data ...40
7.1.3. The Automatic or Semi Automatic Approach ...40
7.2 An outline on how external data is currently integrated ...42
7.3. Common problems concerning integration of external data. ...45
7.3.1. The problem of data structure ...45
7.3.2. Restricting laws ...46
7.3.3. Poor data quality...46
7.3.4. Expensive tools...47
7.4. Future trends concerning integration of external data ...47
7.4.1. Probability Theory...48
7.4.2. Drag and Drop...48
7.4.3. Centralised Data Warehouse ...49
7.4.4. The increase in integration of external data ...49
8. Conclusions... 50
8.1. An outline on how external data is currently acquired ...50
8.2. An outline on how external data is currently integrated ...51
8.3. The most common problems concerning integration of external data into Data Warehouses ...52
8.4. Future trends in integration of external data into Data Warehouses...53
9. Discussion ... 55
9.1. Experience gained from this work ...55
9.1.1. Experience in conducting a relatively large work ...55
9.1.2. Experience in conducting interviews...55
9.1.3. Experience in writing in a foreign language ...56
9.2. Evaluating the work in a wider context...56
9.3. Ideas of future work ...58
References ... 59
Appendix 1 - Accompanying letter... i
1. Introduction
The data flooding problem in the worlds of science, business and government has according to Singh (1998), been growing during the 1990’s. The capabilities for assembling and storing all different categories of data have increased in a way that leaves the knowledge of analysing, summarising and extraction behind. According to Devlin (1997), the concept of Data Warehouse evolved out of two needs: the business requirement of a company-wide view of information and the need from IT departments to be able to manage company data in a better way. The traditional method of data analysis is mainly based on humans dealing with the data directly but when it comes to very large sets of data, this method is not adequate. The database technology has made it possible to effectively store large amounts of data in a well-organised way and likewise the ability to source large sets of data.
Devlin (1997) claims that to be able to efficiently analyse and understand the performance of a corporation there is a need to access all the operational data in a structured way. To increase and understand the opportunities in the market and to be able to better plan for future success of the corporation, more than just the internal data is needed. For example is general market data of importance. This and other kinds of data gathered from outside the corporation are often according to e.g. Devlin (1997) and Inmon (1999a), referred to as external data. The aim of a DW is according to Singh (1998), to unite the information locked up in the operational systems with information from other, often external sources of data. Corporations are gradually obtaining more data from outside their own corporation as the corporations desire to work more closely to their business partners, with third parties and by the increased use of Internet. (Collet 2002; Salmeron 2001)
Inmon (1999a) further argues for the importance of integration of internal and external data as it creates an enhanced foundation for decision-support, i.e. enabling the comparison of internal and external data. But there is according to Inmon (1999a) and Strand & Olsson (2003), problems in incorporating external data with internal data. Problems mentioned by the authors are; difficulties to ensure the quality of external data and difficulties in integrating external data. However, Inmon (1999a), explicitly states that the most difficult problem is to integrate the external data with the internal data.
2. Data Warehouse
In this chapter the terms of a Data Warehouse (DW) will be described. The following sections will be presented: history, definition, architecture and ETL in details.
2.1. History
By automating the reporting and data gathering procedure, the Information Technology (IT) department thought according to Sperley (1999), that business users would be content and the labour reduction the new technology resulted in would be beneficial for the corporations. But the automation of this procedure was not as successful as first intended. The lack of business understanding in IT departments due to the slight interaction between IT departments and business users, led to poorly developed systems. The different departments had their own systems developed and these were often developed without a plan or architecture, resulting in different systems containing different data types and functions. This forced corporations into a situation where systems differed in the use of data types, codes and lengths to represent the same instance of information according Sperley (1999). Additionally there was a problem concerning the meaning of the same data in different systems. For example, a field address in a market system could refer to the mailing address of a customer where the accounts payable system referred to the billing address.
The development of information systems by business operational units resulted in the development of computer systems that contained very large amounts of detailed data concerning a certain area of the business. These are known as information silos. Sperley (1999) claims that the problem of having several different information silos containing data from different areas of the corporation was that it was difficult, almost impossible to get an overall picture of the corporation. This originates from the inability to integrate information from one information silo into another. What the corporation needed claims Sperley (1999), was an integrated source of data about the condition of the corporation.
The data stored in the different information silos could be very precious for the corporation if the data could be combined. The IT department had to write extraction programs enabling the extracted data to be compiled and used as a foundation for creating reports for the different operational units of the corporation.
One of the main benefits of the introduction of the Relational Database Technology was the reduction of quantity in redundant data stored. The different operational systems could with the Relational Databases Technology access the same data for different operational needs.
As the increased use of PCs and desktop tools accelerated these tools became available for more people and many business information workers found out that it was possible for them, without the previous help from the IT department, to access, analyse and even store new data with their tools. The data stored came from different sources such as internal sources and different internal reports made by data analyst and from external sources such as financial newspapers as Wall Street Journal or Business Week. By consolidating the internal data with the external data they acquired advantages in the decision-making process. This technique made business consumers of corporate data to do the same mistakes as IT departments had done before, i.e. developing their own unplanned decision-support environment. The
workers in the different departments generated according to Singh (1998) and Sperley (1999), their own applications and databases based on their own structures and filled it with their own data. This developed into a situation where the data, stored in the databases was defined and calculated differently for every different database created. Users often stored external data in their databases but different users selected different sources for the external data. Because of this the decisions made were not based on the same figures through out the corporation. This resulted in disagreements on which report was the reliable one. The foundation of these disagreements was the unplanned or unarchitected topology of the decision-support environment. What the corporation needed was a central storage containing all the relevant data, defined in the same way, able to produce the reports the corporation needed; a DW. (Singh, 1998; Sperley, 1999).
2.2. Definitions of a Data Warehouse
There are several different definitions of a DW to be found in the literature, for example; Devlin (1997), Inmon (1996) and Singh (1998). The definitions differs somewhat depending on what focus the author had when presenting a DW. Singh (1998) for example, focused more on the use of the DW and on the organisation in question. Devlin (1997) and Inmon (1996), on the other hand, have got a more technical focus. In this work, as mentioned in an earlier section, a technical focus is of higher relevance and therefore chosen rather than an organisational focus. Due to the fact that Inmon (1996) has given the definitions referred to by most authors and that Inmon's definitions are in line with the problem area of this work, these definitions will be presented.
According to W.H. Inmon (1996 p33) a data warehouse is defined as “a subject-oriented, integrated, time-variant, non-volatile collection of data in support of management’s decision making process.”
The DW is furthermore defined by Inmon et al. (2001 p.93.) as “the data warehouse is an architectural structure that supports the management of data that is:
• Subject-oriented
• Integrated
• Time-variant
• Non-volatile
• Comprised of both summary and detailed data.
The data warehouse exists to support management’s decisions which, in turn support the strategic planning processes for the corporation.”
In this definition, Inmon further developed the definition by adding the line comprised of both summary and detailed data. This is probably done because the subject area has matured over the years and the author’s knowledge in the area has increased leading to a further development of the old definition. In this work the last definition of Inmon et al. (2001) will be used continuously. This choice is made because the second definition is later altered and is as a result, more up to date. In the following sections the definition chosen for this work by Inmon et al. (2001) will be described further.
Subject-oriented
By subject-oriented Inmon et al. (2001) means that the data stored in a DW should be relevant for the corporation. The data is organised according to the lines of the major entities of the corporation, for example; customers, products and vendors.
Integrated
By integrated Inmon et al. (2001), means that data coming from different sources are integrated into one entity. Furthermore is integration introduced by Inmon et al. (2001) as the physical fusion and cohesiveness of the data as it is stored into the DW. Many aspects of a DW are covered by integration such as key structures, encoding and decoding structures, definitions of data and naming conventions.
The data is not integrated by extracting it from the operational environment and loading it into a DW. Instead, the data is transformed according to the data model of how the key structure is defined and after the transformation is achieved the data can be integrated and loaded into a DW.
There are however, according to the authors, different meanings and understandings of integration. Inmon (1996) describes integration as data that passes from its source environment to the DW environment. According to Gleason (1997) integration is a part of the transformation process where the detailed data is mapped and united into one entity. In this work integration will have the meaning of the whole process from the extraction to the transformation and loading process, in line with Inmon (1996). Time-variant
By time-variant Inmon et al. (2001) means that any record in a DW is precise and exact relative to some moment in time. The time constituent could be a year, a quarter, a month or a day. DWs usually contain data up to at least 5 to 10 years.
Non-volatile
Non-volatile data means according to Inmon et al. (2001), that data loaded and stored in a DW never changes. There are however, though very rarely, occasions when a DW is updated. An exception is for example, that a DW could be updated because of some serious mistakes in the extraction, transformation and loading process that populated the DW.
Comprised of both summary and detailed data
A DW contains according to Inmon et al. (2001), both detailed and summary data. The detailed data reflects the transactions made daily in a corporation and contains for example data about sales, inventory movement and account activity.
There are two different categories of summary data: the profile record and public summary. The profile record contains detailed, raw data that is summarised from the extraction and transformation process and then stored into the DW. The other kind of summary data: public record, is departmentally calculated data that has a wide corporate outreach.
2.3. Architecture of a Data Warehouse
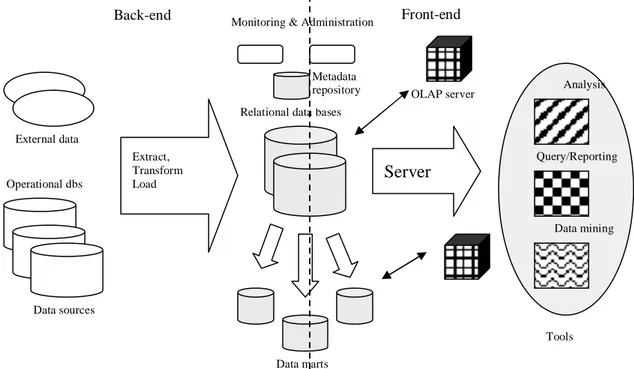
Based on the Figure by Chaudhuri and Dayal (1997), the areas relevant for integration of external and internal data will be presented (Figure 1). Chaudhuri and Dayal (1997), divides their architecture of a DW into two parts; the front-end and the back-end and the tools used as front-back-end tools and back-back-end tools. The front-back-end tools are
used for querying and data analysis and are not relevant for this work and no further information will be given about these. First, external data and its features will be presented and second, the focus will be moved to the back-end environment where the back-end tools are used for extracting, cleansing and loading data into the DW. The back-end tools will not be described in this work, only the process they perform. Subsequently the data repository and meta data will be introduced and in the following sections the presentation of the relational databases and the data marts will take place. The OLAP server is the only part that will be described from the front-end area due to the focus of this work.
Figure 1. Example of an architecture of a Data Warehouse (Adopted from Chaudhuri & Dayal 1997, p.66).
2.3.1. External data
In this section external data will be defined and described.
Devlin (1997 p.135.) defines external data as “business data (and its associated meta data), originating from one business, that may be used as part of either the operational or the informational processes of another business”
External data is according to Inmon et al. (2001), data originating outside a corporation’s internal systems. External data is acquired by corporations in different ways. It is characteristically either purchased from or created by, another corporation. Nowadays, the Internet is becoming a more frequently used source for the gathering of external data. Kelly (1997), claims the benefits from analysing external data to be the information about the external environment. This enables the decision makers of the corporations to recognise opportunities, detect threats and to identify synergies in order to respond in time to these events.
External data can according to Inmon et al. (2001), be of very different types and volumes and there are as many types of external data as internal data. The data can
Relational data bases
Data marts Operational dbs External data Tools OLAP server Extract, Transform Load Server Data sources Metadata repository Monitoring & Administration
Analysis
Query/Reporting
Data mining
either be detailed or summarised, structured or unstructured. Additionally, external data can according to Strand (2003), be extracted from different sources. The sources could for example be: industry organisations, county councils and municipalities, the Internet, business partners and bi-product data suppliers. The difference in the sources is the quality of data in the aspect of how much the data has to be cleansed before incorporated in the corporation. Kimball (1996) states that syndicated data (data that is bought from syndicate data suppliers such as SCB or ICI) could be of two conditions, i.e. adjusted or unadjusted. These will be further described later in this section.
The external data is different to the internal data in some ways. According to Inmon et al. (2001), the main difference between external and internal data is that internal data can be manipulated. Internal data is relatively flexible and can be changed by adjusting or changing the programs that extract and transforms the data. External data is according to Inmon et al. (2001), not possible to change in that way because the sources of external data are situated outside the corporations. The only option for persons in charge of the acquiring process for external data is to either use the external data as it is or to reject it. There is though according to Kimball (1996), a way to affect the structure of external data. By establishing a contract between a data supplier and a corporation, deciding how and what condition and structure the syndicated data will be delivered in, there is a way to facilitate the integration of external data.
There is however according to Inmon et al. (2001), one exception that enables the integration of unadjusted external data. When external data enters a DW there is a way of modifying the key structure. This is usually performed when matching the external data to the existing key structure of the internal data. The external data usually have a key structure that differs from the internal data and this demands modifications of the external data key structure if the external data should be used in an effective way. The change of the key structure of external data could either be a rather uncomplicated or a complicated task to perform depending on what the situation demands. Inmon et al. (2001) claims that a simple way of changing the key structure of external data is to let the external key go through a simple algorithm to convert it into the key of the internal data.
Kimball (1996) states there is another way of incorporating unadjusted external data. The corporation ought to conform the dimensions of a star, snowflake or starflake schema in order to integrate the external data with the internal data. This is performed by different types of transformations forcing the two data sources to share identical dimensions.
Approaches more demanding then the above mentioned are for example, the usage of algorithms in combination with reference tables or the conversion of external keys manually. The approaches where the external keys are manually changed are not suitable for large amounts of data or when the manual adaptation must be done repetitively.
An issue concerning the incorporation of external data is according Strand, Wrangler and Olsson (2003), the poor quality of external data received from data suppliers. Poor quality of external data was in a study, performed by these authors, mentioned as one of the main issues not to incorporate external data. The study additionally presents the issue of the difficulties in mapping internal keys with external keys as another substantial problem when to incorporate external data.
2.3.2. Extraction, transformation and loading layer (ETL)
The ETL layer is also known according to Marco (2000), as the acquisition layer. The data acquisition layer is according to White (1997), where the development and the execution of the data acquisition applications take place. These acquisition applications (ETL-tools) are used for capturing data from different source systems and further on transforming and loading it into a DW. The development of the data acquisition applications are based on rules that are defined by the DW developer. In the rules, the sources from which the DW’s data will be acquired are defined. Other definitions dealt with are the data cleansing and the enhancement done to the data before it is applied into DW databases. This component includes the extraction, transformation and loading of the data. These components will be given a more thorough description in Section 2.4. Further on, the acquisition component generates definitions of the data enhanced which is known as meta data and stores it in the information directory component also known as the meta data repository. Meta data will be presented in the next section.
2.3.2.1 ETL-tools
ETL-tools can according to Gleason (1997), be purchased or developed by the corporation itself. To develop ETL-tools in-house is a time consuming and therefore costly process as with all development of software. First, the requirements must be established, then the effort of programming takes place and finally the software must be tested and maintained. As there is changes in the sources from which the data is extracted there could according to the author, be changes needed for the software as well. The biggest disadvantage with using self developed ETL-tools is however, that they usually do not generate meta data. The meta data supplies information about what transformations have been done to the data. Commercial ETL-tools automatically generates meta data. This is according to Gleason (1997), the biggest advantage with using commercial ETL-tools. Another advantage with purchasing commercial ETL-tools is the elimination of the costly developing process involved when a corporation is developing an ETL-tool on their own. Commercial ETL-tools are however, very expensive and according to Kimball (1998), commercial ETL-tools are not always cost effective for smaller corporations.
2.3.3. Meta data repository and meta data
Meta data repository is according to Chaudhuri and Dayal (1997) and Marco (2000), used to store and manage the different kinds of meta data that is related to a DW, i.e. the physical database tables that contain the meta data. Meta data is known according to Marco (2000) and Sperley (1999), as data of data. Meta data can be described by using following example; in a library a central card catalogue can be used for identifying what books are available in the library and also the physical location of the books. It also contains information of the subject area, author, number of pages, publication date and revision history of each book. The catalogue can be searched to determine which book will satisfy specific needs. Without the central card catalogue, finding a book would be a time consuming and difficult task to perform. Meta data is according to Marco (2000), the central card catalogue in a DW. Meta data helps users locate the information they need for analysis by defining the contents of a DW. There are according Marco (2000), two different kinds of meta data: business and technical meta data. Business meta data supports the end-users of a corporation. Technical meta data is used by the technical users and the IT staff provide them with information about their operational and decision-support systems. This information supplied by
the technical meta data can be used by the IT staff in order to maintain and expand the systems if required.
When data is brought into organisations from an outside source this data is according to Inmon et al. (2001), referred to as external data. (external data will be further presented in Section 2.2.). There is a great need for corporations to capture the meta data describing the incoming data. Important knowledge about the external data is according to Inmon (1996) and Marco (2000), document ID, the source of the external data, date of entry into the system, index words, purge date, physical location reference, length of external data and the classification of the external data. Inmon (1996) additionally claims that the meta data is used to register, access and control the external data in a DW environment.
When data is extracted from different source systems, internal and external, it could be cleansed, transformed and loaded into a DW using commercial ETL-tools. These tools generate according to Marco (2000), meta data about what has been done to the data in the ETL process. An example of generated meta data could be: data transformation rules describing changes of the data in the transformation process.
2.3.4. Data manager component, relational database and online analytical processing
The data manager component is where data, extracted from different data sources and worked on with back-end tools in the Extraction, Transformation and Loading process (ETL) is stored. (Inmon (1996), Marco (2000) and White (1997).
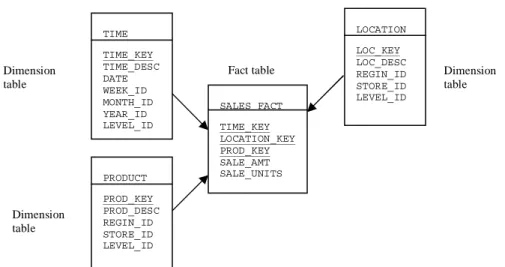
Data in a DW is according to Chaudhuri and Dayal (1997), usually stored in a star schema, a snowflake schema or a starflake schema to represent the multidimensional data model. Inmon et al. (2001) claims that a star schema arranges data in a way that makes it easier to visualise and navigate. Figure 2 and 3 shows the star schema and snowflake schema. A star schema consists of one or more fact tables and a number of dimension tables. A fact table is according to Devlin (1997), made up by the basic transaction-level information that is relevant for a particular application. The fact table often contains several millions, predominantly numeric rows Devlin (1997), Connolly and Begg (2002) and Inmon et al. (2001) claims. Dimension tables contain the data needed to position transactions along a certain dimension. These are, in contrast to the fact tables, relatively small and usually contain descriptive information. Dimension attributes are according to Connolly and Begg (2002), often used as constraints in DW queries. Examples of dimensions in a marketing application could be time period, marketing region and product type. A snow flake schema is according to Connolly and Begg (2002), a variant of the star schema where the dimension tables are allowed to have dimensions. A starflake schema is a mixture of the star schema and the snowflake schema. This is according to Connolly and Begg (2002), the most suitable database schema for a DW because it combines the advantages of the two other. There are different opinions among the authors on how to integrate data into a DW.
Figure 2. Example of a star schema. (Adopted from Bischoff, 1997, p.197).
Figure 3. Example of a snowflake schema (Adopted from Connolly and Begg, 2002, p.1081).
On-line analytical processing (OLAP)
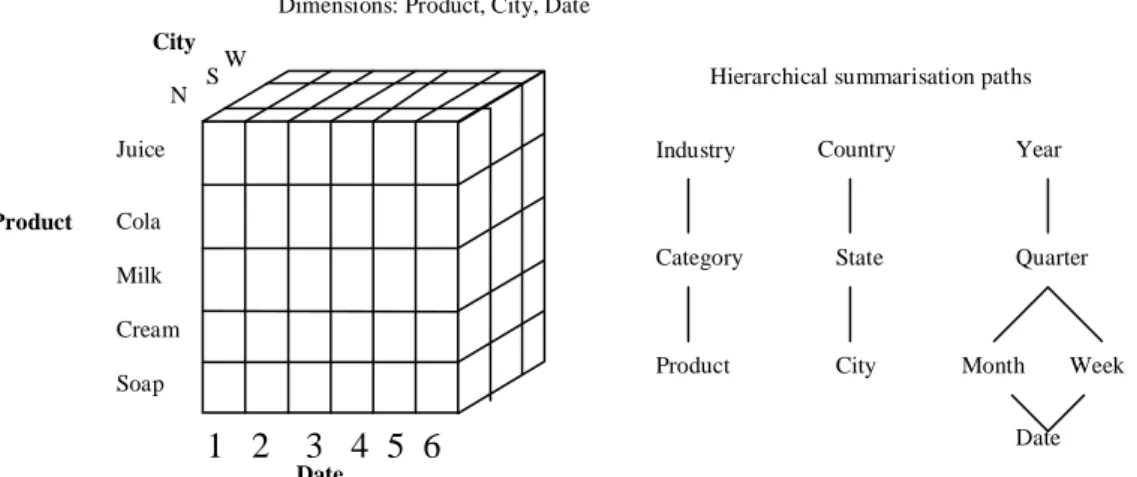
The data in a DW is usually modelled multidimensional to facilitate complex analysis and visualisation. An OLAP database is according to Kimball (1998), similar to a multidimensional database. The data stored in the OLAP server, i.e. the OLAP database, is usually stored in a rolled up form in distinction to the DW and the data is furthermore according to Chaudhuri and Dayal (1997), stored in arrays. The OLAP-tools are then used for performing the different analysis operations on the server. Figure 4 presents a cube of multidimensional data which is how the data is stored in the OLAP servers.
TIME TIME_KEY TIME_DESC DATE WEEK_ID MONTH_ID YEAR_ID LEVEL_ID SALES FACT TIME_KEY LOCATION_KEY PROD_KEY SALE_AMT SALE_UNITS PRODUCT PROD_KEY PROD_DESC REGIN_ID STORE_ID LEVEL_ID
Fact table Dimension
table Dimension table Dimension table Region Region (PK) country PropertySale timeID (FK) propertyID (FK) branched (FK) clientID (FK) promotionID (FK) staffID (FK) ownerID (FK) offerPrice sellingPrice saleComission saleRevenue Fact table Branch branchID (PK) branchNo branchType city (FK) City City (PK) region (FK) LOCATION LOC_KEY LOC_DESC REGIN_ID STORE_ID LEVEL_ID Dimension tables
Figure 4. Example of multidimensional data. (Adopted from Chaudhuri and Dayal, 1997, p.68).
OLAP-tools provides for example according to Chaudhuri and Dayal (1997), the ability to do rollup operations (increasing the level of aggregation), drill-down operations (decreasing the aggregation), slice and dice operations (selection and projection) and pivot operations (re-orientating the multidimensional view of data). OLAP-tools are according to Mancuso and Moreno (2002), used by end-users to access the information stored in the OLAP servers for trends and exceptions. OLAP-tools complement the other reporting and analytical OLAP-tools that can be found in a DW in an important way. OLAP-tools are according to Mancuso and Moreno (2002), one of the most powerful components in a DW. Users equipped with OLAP-tools can perform detailed data analysis and retrieve transactional details when something in the business operations is irregular. Further more, Mancuso and Moreno (2002) claims that when users are able to select analysis tools free of choice and no longer have to understand where to look for the data, users become more self-sufficient and are able to retrieve the information they need when they need it.
2.3.5. Data marts
A data mart can according to Chaudhuri and Dayal (1997), be described as a miniature of a DW containing less data, fewer subject areas and less history. The data in a DW is stored to support the whole corporation and it is not optimised for a specific department. A data mart is according to Inmon (1999b), Inmon et al. (2001) and Sperley (1999), a structure of different subject areas specific organised for departments individual needs. There can be several different data marts in one corporation. Each of the different departments in an corporation such as finance, marketing and sales can have their own data mart. The data marts are based on the different needs of the department using it, which leads to a different substance for each one of the different data marts. The content of data marts are usually summarised and designed for the specific needs of different departments and only contains data relevant for the specific department using it. It exists two different categories of data marts: dependent and independent. A dependent data mart uses a DW as a source while the independent data mart uses operational application environment as a source. This means: the content of the dependent data marts have the same structure and architecture all over the corporation while the structure and architecture of
Product N S W 1 2 3 4 5 6 Juice Cola Milk Cream Soap
Dimensions: Product, City, Date
Hierarchical summarisation paths
Week Industry Category Product Country State City Year Quarter Month Date City Date
independent data marts could be very different compared to each other. (Chaudhuri and Dayal, 1997; Connolly and Begg, 2002; Inmon, 1999b; Marco, 2000).
2.4. ETL in details
The Extraction, Transforming and Loading (ETL) process is where data is extracted from different sources, transformed into a predefined structure and thereafter loaded into a DW. These different phases will be presented in following Sections: 2.4.1, 2.4.2 and 2.4.3. The ETL process is also mentioned in the literature as the data replication. The two phases, extraction and loading, are also known as capture and applying. The ETL process described in following sections is in the literature intended for internal data but as there was no literature to be found intending the ETL process for external data, this description is believed to be used for the external data as well. The researcher has searched for information about the ETL process concerning external data in scientific reports, in literature and the researcher has also consulted the supervisor to try to find additional sources of information but the information found was not comprehensive.
2.4.1. Extraction
Extraction is according to Inmon et al. (2001), the process of selecting data from one environment and transporting it to another environment. While most corporations have several different sources there is a problem to capture the source data. The operational data can be stored in sequential and indexed files or in hierarchical, relational and other databases. Besides this there are different formats of physical storage and data representation to take into consideration. There are according to Devlin (1997), two main techniques when extracting data: static capture and incremental capture. Static capture is defined by Devlin (1997 p.179) as “A method of capturing a time independent or static view of the data in a source data set.” The incremental capture is defined by Devlin (1997 p.179) as “A method of capturing a record of the changes that take place in a source dataset.”
The static capture is not as common as the more complex incremental capture but could take place for example, the first time a data set from a specific operational system is to be added to a DW. Another occasion when static capture occurs is when a complete history of an operational system data is maintained and the volume of the data set is small. The static capture technique could be said to take a snapshot of the source data at a special point in time. The static capture does not, compared to the incremental capture, take time dependency of the source into consideration. For databases changing over a period of time there is a need to capture the history of these changes. For the issue of capturing the actual changes that have occurred in the source, the incremental capturing type is used.
There are several different ways of representing time dependency in the operational systems and this have developed a number of different ways to perform incremental captures. These different methods or techniques as they according to Devlin (1997) also can be called, can be divided into two types: immediate capture and delayed capture. The techniques related to immediate capture are: static capture, application-assisted capture, triggered capture and log capture. The techniques belonging to the delayed capture are: timestamp-based capture and file comparison. From these teqniques the different output data structure originates, described in Section 2.4.1.3.
2.4.1.1. Immediate capture
The immediate capture technique according to Devlin (1997), captures the changes at the time they occur. This ensures a complete record of changes in transient, semi-periodic and semi-periodic data. The four included techniques are following:
Static capture
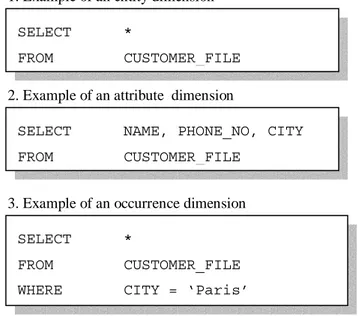
The static capture technique’s functionality could be described as taking a snapshot of the source data. This could be done using one of the three sub setting dimensions: entity dimension, attribute dimension and occurrence dimension. The data to be captured is usually selected using SQL. Figure 5 presents examples of the different sub setting dimensions.
Figure 5. Examples of sub setting data for capture (Adopted from Devlin, 1997, p.183).
These sub setting techniques can according to Devlin (1997), also be used in the five incremental capture techniques presented below.
Application assisted capture
Application assisted capture is a technique that according to Devlin (1997), is built into the application with the primary task to maintain the operational data. The source application preserves its data for immediate capture of incremental changes in that source. This is done by providing a record of continuous, non-volatile changed data. This technique is difficult to apply to existing systems due to the fact that many operational systems are poorly designed and documented and that the operational systems usually are of a complex nature. This technique is however suitable to apply when designing new operational systems.
Triggered capture
The trigger capture technique could according to Devlin (1997), only be of use if the operational systems are storing the operational data in a database instead of in a file. Triggered capture could be described according to Connolly and Begg (2001) and
SELECT *
FROM CUSTOMER_FILE
SELECT NAME, PHONE_NO, CITY FROM CUSTOMER_FILE
SELECT *
FROM CUSTOMER_FILE WHERE CITY = ‘Paris’
1. Example of an entity dimension
2. Example of an attribute dimension
Devlin (1997), as the capture of operational data performed by triggers for all database events for which changed data should be captured. The events or the changed records are stored in a separate place for future processing. Since each database-update-transaction that occurs on the operational data triggers a second transaction to capture the change, this leads to a decreased performance of the database. Therefore this technique is only suitable for records where small amounts of changes or events are taking place.
Log capture
When changes occur in the operational data these are according to Connolly and Begg (2001) and Devlin (1997), typically maintained in a log for backup and recovery purposes. This makes it possible to use the log as the source from which changes are captured using the log capture technique.
2.4.1.2. Delayed capture
The delayed capture techniques capture the changes at specified times. This generates a complete record of changes only in periodic data. Delayed incremental capture is according to Devlin (1997), useful for transient data sources only if the business does not need to see all changes occurring in the legacy system mirrored in a DW.
Timestamp based capture
Timestamp based capture is according to Devlin (1997), a technique that is dependent on timestamps in the source data. The source data has to contain at least one field of time stamped information. This field is used as the basis for the record selection. The records to be captured are those that have changed since the last capture. The relevant records have a timestamp later than the time of the prior capture.
File comparison
File comparison is according to Devlin (1997), a technique used for capturing a possible incomplete set of changed data by comparing two versions of the operational data. This is done by comparing for example, a file from yesterday with a file from today and then capture the changes between the two files.
The static capture this is required to be performed at least one time in order to initially populate the DW. To accomplish the feature of history in the DW, one or more of the incremental capture techniques has to be performed. The different techniques of data capture have different strengths and weaknesses and none is therefore an obvious winner. One factor mentioned earlier is the different source systems of corporations where data is represented in different ways and operational data is stored in different environments. The consequence of this is that according to Devlin (1997), a mixture of the different techniques are used combined.
2.4.1.3. Different output structures
The data captured in the capture process, the output data should according to Devlin (1997), be structured and stored in a format that can be easily used by the other phases, transformation and loading, in the ETL process. This feature together with the issue of the documentation of the data content and its characteristics are the two key requirements of the output data. The output data can be structured in different ways depending on whether it is generated on a record level or on a file level. If the output data is generated on a record level, the output data is able to be uploaded from the operational systems to the DW in small batches and even on a record by record basis.
One setback to this technique is however, that the upload needs more thorough controls to ensure that the full data set is uploaded and that no records are out of sequence or missing. The features of data generated from a file level were not mentioned in the literature and is therefore not further described.
If the capture component operates independently, i.e. it is not part of an ETL-tool performing the whole process, the output data can be of self-documenting format. When output data is structured in a self-documenting format, the output data according to Devlin (1997), automatically documents the characteristics and content definitions of the data, i.e. meta data. The meta data of the output data is very important for DWs administrators since it provides them with the information of the source of the data as mentioned in Section 2.3.3.
2.4.2. Transformation
There are according to Gleason (1997), different kinds of transformations where each one of the transformations has its own different characteristic and scenario. One of the problems with data sourced from operational systems, this also includes external data, is that not all data is subjected to the same business rules. Theses differences must be dealt with as the new data is created.
Gleason (1997) defines some of the basic types of transformation as: Simple transformation
Simple transformation is the basics of all data transformation. In this category the focus is on the manipulation of one field at a time. There is no concern given to the values in a specific field. Examples of simple transformation are: changing the data type of a field or replacing an encoded field value with a decoded.
Cleansing and scrubbing
Cleansing, also known as scrubbing, is the category where the data is formatted in a predefined way and the use of every field is assured to be consistent. One example of when the formatting of fields can be used is the formatting of address information. Cleansing also verifies that the fields are containing valid values.
Aggregation and summarisation
Aggregation and summarisation is the category where several records of data from the operational environment are combined into less records and stored into a DW environment. Aggregation is sometimes performed in a way that leaves stored data in a DW less detailed than the data in the operational environment. Another case when aggregation is executed is when data marts are created. Data marts contain aggregated or summarised forms of detailed data from the DW.
Integration
According to Inmon (1996), a DW can be described as a system that supports business analysis and decision making by the construction of a database containing data that is subject-orientated, time-variant, non-volatile and integrated. The data is according to Singh (1998), sourced from multiple, often incompatible systems. Before data is loaded into a DW, the data must be changed to fit the key structures of the data already stored in the DW or if the data is being loaded for the first time, it is loaded according to the key structure of the data model. (Singh 1998). When the data has been extracted from the operational systems it is loaded into the transformation and
integration layer. This layer is according to Inmon et al. (2001), mostly made up of applications and this is where the alteration of the data takes place.
The integration is according to Gleason (1997), the process where the data from multiple sources are mapped, field by field, to finally end up as new entities which are loaded into the DW’s data structure. Gleason further states that the integration is preceded by different types of transformations in the comprehensive transformation process. In the transformation process the structure of the data and the data values are controlled and when needed, changed to the standard of the DW. In the next section, different techniques for transformation will be described. The feature of integration will be further described in Section 2.4.2.1.
Different techniques for transformation
To be able to match the data extracted from the different sources and to integrate it into one entity according to a corporation’s data model and thereby adjust it to the business rules, there are according to Gleason, (1997) and Inmon et al. (2001), several types of transformation that could take place. According to Gleason (1997), the different types of transformation could be divided into two categories: simple transformation and complex transformation.
The different kinds of simple transformation that can take place in the simple-field mapping are according to Gleason (1997):
Data type conversions
Data type conversions are the most common of the simple transformations techniques. Gleason (1997) advocates reformatting the operational data to fit the data model of the DW where the data should be consistent. The data in the operational system makes perhaps sense within the context of its originate environment but not at the enterprise level, which the DW is supporting.
Figure 6. Example of data type conversions (Adopted from Gleason, 1997, p.163).
This transformation can be done using for example DW data transformation tools. Date/time format conversions/simple reformatting
The operational systems are according to Gleason (1997) usually not designed or constructed in the same way or at the same time which often results in differences of what time and date format are used. This is a problem which is taken care of in the date/time format conversions or in simple field reformatting claims Inmon et al. (2001). The different types of date/time used in the operational environment must be transformed into standard DW format. This can be performed through manual program coding or by the use of the transformation tools.
Data Source AMT-BILL DECIMAL (7,2) D-SALES-AMOUNT DECIMAL (13,2) ACCOUNT-STAT-CODE CHAR(1)NULLS ALLOWED AMT-BILL DECIMAL(13,2) AMT-SALES DECIMAL (13,2)
CD-ACCT-STATUS CHAR(1) NO NULLS Data Warehouse
Figure 7. Example of how to reformat data to achieve consistency. (Adopted from Inmon et al. 2001, p.73).
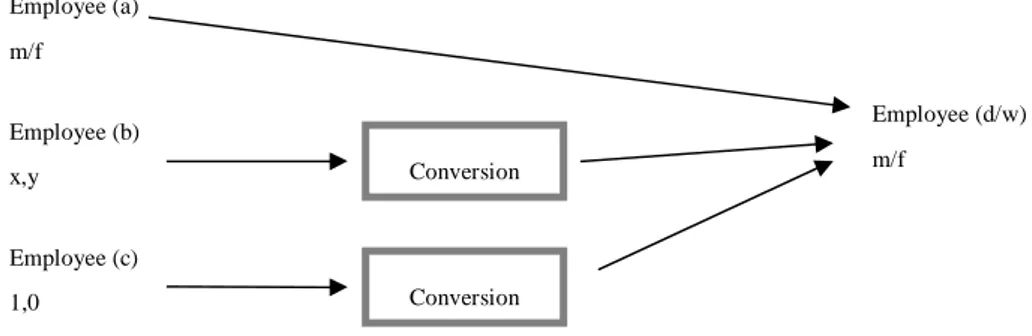
Field decoding/ Encoding structures
In the operational environment the data stored in the operational databases is sometimes stored using coded fields. Male and female can according Gleason (1997) and Inmon et al (2001), sometimes be coded as MALE or FEMALE, M or F and sometimes as 1 or 0. This is perhaps not a problem for the users of the operational systems that know what the codes mean but it could be a serious problem for the end-users of the DW. That is why, according to Gleason (1997), encoded values in operational data and external data should be converted into coded values that easily can be understood before they are stored into a DW.
Figure 8. Example of a conversion of encoded values to achieve consistency. (Adopted from Inmon et al. 2001, p.73).
The different kinds of complex transformation are according to Gleason (1997), part of the cleansing and scrubbing process. This process examines the actual contents of fields or groups of fields instead of the storage format. Different types of complex transformation are further described below.
Valid values
There are according to Gleason (1997), different techniques for how to check for valid values in the systems. The easiest way to execute this is to do range checking. Range checking is mostly executed on fields containing numbers or dates. One example could be if a valid value for invoice numbers is between 1000 and 99999, and one invoice is found with the invoice number 777, this invoice is not within the predefined values and will therefore be excluded and investigated further. Another example is if a corporation, founded in year 2000, finds an invoice from 1999 in its system. This invoice would then be further investigated and excluded from the system.
There are according to Gleason (1997), other techniques for checking valid values, i.e. comparing data fields with other data fields or comparing data fields with an enumerated list. The technique where data fields are compared to other data fields is
YY/MM/DD DD/MM/YY YYYY/MM/DD MM/DD/YY Employee (a) m/f Employee (b) x,y Employee (c) 1,0 Conversion Conversion Employee (d/w) m/f
called: dependency checking. An example of this technique could be the comparison of a purchase order number on one invoice with the purchase order number in the purchase system. Invoices containing purchase order numbers that do not match should be excluded and further investigated. The technique where the data fields are compared with an enumerated list could be exemplified as comparing the values in the data fields with predefined values like “PRO”, “AVE”, and “BEG”. Any value that does not match these values should be excluded.
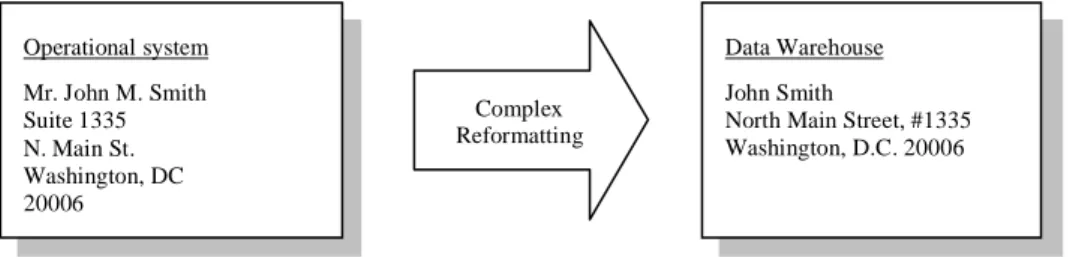
Complex reformatting
This type of cleansing and scrubbing is used to convert data extracted from different sources with different formatting into one standardised representation. For example, when there is no standardised way in operational systems environment to store addresses this means that the addresses will be represented in many different ways. Complex reformatting uses parsing to determine the essential parts of the addresses. The shortened part “blvd” in the address would for example be converted to the standardised “boulevard”. Figure 9 shows an example of a full address reformatting.
Figure 9. Example of complex reformatting (Adopted from Gleason 1997, p.166).
2.4.2.1 Integration
The most demanding task in combining operational data from different and multiple sources are according to Gleason (1997), to integrate it into one merged data model. The different data sets must be combined into a new entity. The different data sources do not usually have the same business rules, which prevent the data from easily being united. These differences must be accommodated as the new data is created.
Simple integration
Gleason (1997) claims that the most common integration technique is the simple field level mapping and the author further claims that as many as 80-90% of the integrations taking place in a conventional DW are simple field mappings. Simple field mappings are described as moving a data field from the source system and along the way scrub, reformat and perform some sort of simple transformation to the data as it is moved into the DW’s data structure.
Complex integration
10% to 20% of the integrations and the processes of moving data into a DW are more difficult and complex than to just move the data from the source field to the target field. There is a need for additional analysis of the source data to be able to transform it into target data. The most common techniques according to Gleason (1997), will be presented below. Operational system Mr. John M. Smith Suite 1335 N. Main St. Washington, DC 20006 Data Warehouse John Smith North Main Street, #1335 Washington, D.C. 20006 Complex
Common identifier problem
One of the most difficult problems with integration is when different sources, with the same business entities, are to be integrated. The problem is to identify the entities that are identical. A customer for example that exists in several different systems can be identified by a unique key in each different system. This unique key is not always the same in the different systems and therefore knowing if it is the same customer in the different systems can be difficult. In a DW, there should only be one unique key to identify a customer. Solving this problem is usually done in a process consisting of two phases. The aim of the first phase is to isolate the entities that can be guaranteed to have a unique key and the purpose of the other phase is to merge these entities into one.
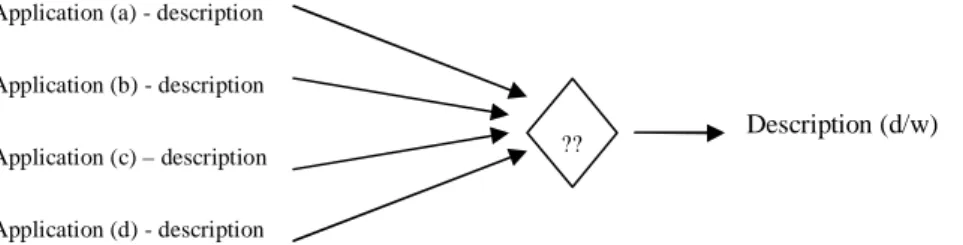
Multiple sources for the target element
Another situation that must be handled is when several different sources for a specific target data are existing. It is common that data from different sources do not correspond and from this the need to decide which data to use in the target data, arises. There are some different techniques to solve this problem. One way is to determine which system is the key system; i.e. the system that is predominant in case of a conflict. Another way is to compare the dates (to decide which one is most up to date) or to compare other related fields to decide which constituent is the dominant one. Additionally, the different values are occasionally summarised and from this sum the average, to be stored in the DW, is calculated.
Figure 10. Example of a problem with multiple sources for the target element. (Adopted from Inmon et al. 2001, p.74).
Missing data problem
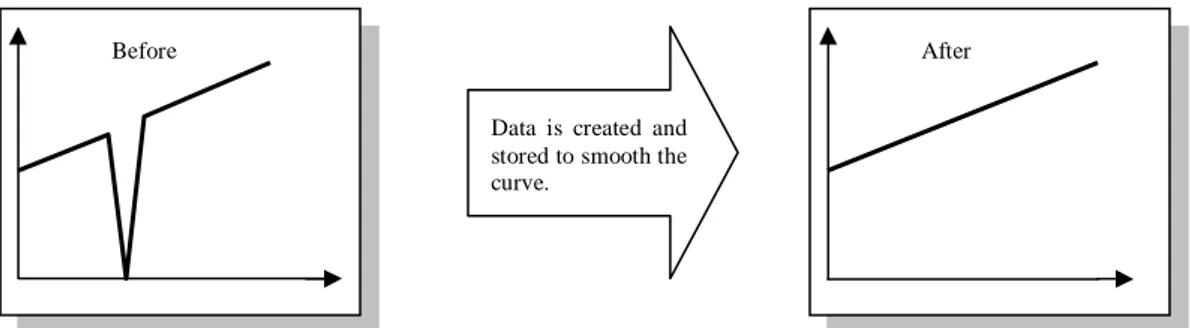
For different reasons which will not be further discussed in this work, there are according to Inmon et al. (2001), occasions when there are no data to be sourced to the target data. Under some circumstances, Gleason (1997) states, some DWs can manage to have nulls or blank fields stored when the data for a field is missing but for other DWs there must be a value stored in the field. The reason for the need of having a value stored is that if there are queries related to the table, these queries will not be valid if the field does not contain a valid value. As a result of this there is occasionally a need to create data to replace the missing data. This is usually done by obtaining and summarising the values in the adjacent fields above and below the target field and the average is put in as target data. In this way a curve based on the query would be smoothened instead of showing a huge gap. See Figure 11 for an example. Some corporations though use very advanced and complex techniques applying several variables resulting in a very realistic value.
Application (a) - description
Application (b) - description
Application (c) – description
Application (d) - description
Figure 11. Example of a result from the solution of the missing data problem. (Based on an example of Gleason 1997, p.168).
2.4.3. Loading/ applying
When data has been extracted, cleansed and transformed it must be loaded into to the DW. This is according to Chaudhuri & Dayal (1997), usually performed by batch load utilities. The system administrator must have control over the loading of the DW and therefore the load utility used should enable the system administrator to be able to monitor the system, to cancel, suspend and resume the load process and to restart the load process if it failures with no loss of data integrity. Before the loading of the data takes place the data must be pre-processed. The pre-processing, often conducted by batch utilities, concerns according to Chaudhuri & Dayal (1997): checking integrity constraints, sorting, summarisation, aggregation and other computations to build the derived tables stored in the DW. It further concerns building indices and other access paths and partitioning to multiple target storage areas.
The loading of a DW must be well planned because of the amount of data involved. The load utilities for a DW deals for example with a much larger amount of data than loading utilities for an operational database. The DW is often loaded or refreshed at night because it needs according to Chaudhuri & Dayal (1997), to be taken offline to perform this.
There are according to Devlin (1997), different techniques of loading the data extracted and transformed to the target data store. These different techniques are: load, append, destructive merge and constructive merge.
Load
This is the most uncomplex technique of applying the source data set to the target data set. This technique loads or reloads the data that has been extracted and transformed into the DW completely replacing the existing target data.
Append
In this technique the loading technique appends the source data that has been extracted and transformed to the existing target data. The target data that already exists is saved either by duplicating the existing records or by rejecting the new data records. Which technique used is depending on the content of the captured data. Destructive merge
This technique merges the data being uploaded to the existing target data. If the keys of the uploaded data match the existing records the content is updated and where the keys of the uploaded data do not match the keys of the target data, a new record is created.
Data is created and stored to smooth the curve.
Constructive merge
This technique always adds the uploaded records to the target data. Where the keys between the source data and the target data match, the old target data is replaced but not overwritten.
Which one of the different techniques that should be used depends according to Devlin (1997), on the time dependency of the target data. The constructive merge is according to the author, the technique most effective for maintaining periodic data since the records, using this technique, never are deleted.
3. Problem
In this chapter the aim and objectives of this work is given along with the delimitations of the work.
3.1. Problem area
In order for a corporation to be able to compete against the competitors in their business area, Marco (2000) claims, there is a need to be able to respond quickly to the market demands and customer needs. A DW is a decision support system many corporations use for this purpose. The DW is according to Devlin (1997), used to efficiently analyse and understand the performance of an corporation by enabling access to all the operational data in a structured way. However, according to Inmon (1999a) and Singh (1998), the internal data on its own is not sufficient for being able to understand the current situation of the corporation. There is also a need to acquire and integrate data originating from outside the corporation, i.e. external data, since such data allows the corporation to reveal information that would not been possible to compile from purely internal data (Inmon, 1999a; Singh, 1998).
To be able to acquire such external data and to integrate it into a predefined structure of a DW, the data must be handled according to given data structures. However, different types of data states different prerequisites on how to perform the acquisition and integration since the proposed usage of the data guides the activities performed. Therefore, there is no single approach that suites all needs. Instead, different data must be integrated according to its purpose and this raises the need for different types of integration approaches. Unfortunately, the literature covering external data acquisition and integration is rather vague on the characteristics of these approaches and the underlying problems. Therefore, this work is dedicated towards the creation of an increased understanding concerning these issues.
3.2. Aim and objectives
As a consequence of the above described problems, the following aim was formulated:
The aim of this work is to exploratory outline current approaches for acquiring and integrating external data into Data Warehouses and to give a brief overview of the future trends for external data integration.
The result of the work is supposed to increase the knowledge concerning the current standings and the future of external data acquisition and integration into DWs. The overall aim of this work will be satisfied by the fulfilment of the following objectives.
• Give an outline on how external data is currently acquired
• Give an outline of current external data integration approaches
• Identify the most common problems concerning the integration of external data into DWs.
• Identify future trends in integration of external data into DWs
The first objective, concerning the outline of how external data is acquired, will present information about how corporations acquire their external data, which distribution technologies are used and how the acquired data is transformed. This
objective was included since it gives the frame for how corporations manages the external data in the initial phases and it also pinpoints the importance of being aware of the purpose underlying the integration. The second objective, an outline of current external data integration approaches, will provide information about which different approaches are available and which one is most applied. The third objective about the most common problems concerning the integration of external data will describe the difficulties that are associated with the process of integrating external data. This objective was included in order to balance the descriptions and show on the fact that there are also issues that needs to be dealt with, before an unlimited acquisition and integration of external data is possible. This objective was also supposed to help in the identification of possible, future work. The fourth objective regarding future trends will present information about any new approaches that may be applied in the future. It was considered as important not only to investigate current state of the art, but also to scan the horizon for what the future holds, since it would also bring valuable insights for future work, but most importantly, it would give interested readers some hints on were the area is heading.
3.3. Delimitations
The DW technology is used in many different business areas and therefore this work will be restricted to the financial business area. Since approaches used for integration are the same throughout the different industry areas this work could have been accomplished in a different area but since there are several reports and case-studies from the financial business area and Data Warehousing, this area could be understood to be a more mature area. This area was further chosen in front of others because the researcher finds the financial business area more interesting and the research study conducted together with the co-researcher had an outlined aim concerning the financial business. By conducting the research in co-operation the same respondents could be used, this issue is further described in Section 4.3.
4. Research method
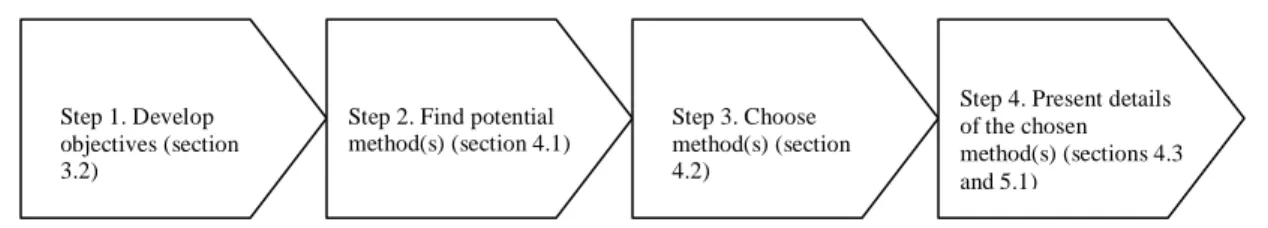
This chapter contains a presentation and a discussion about the method of how to conduct a research, suitable for this work. The method adopted is strongly influenced by the process (Figure 12.) by Berndtsson, Hansson, Olsson and Lundell (2002).
Figure 12. The four-step process presented by Berndtsson et al. (2002) The Figure gives additionally an indication about how the process is connected to the different sections.
4.1. Methodical considerations
In this section the reader will be given the motives for the method chosen to reach the aim stated in Section 3.2. The discussion is based on the process given by Berndtsson et al. (2002) introduced in Figure 12.
In order to achieve the overall aim of the research conducted, Berndtsson et al. (2002) claims that a number of different objectives (the objectives of this work are described in Section 3.2.) should be formulated; this is the first step of the process. An object is a minor, realistic and measurable unit and all objects should at the end lead to the answer of the aim of the work. To accomplish each one of these objectives developed, different methods of how to conduct a research could be used. The different objectives developed in this work are, as mentioned in Section 3.2., the outlining on how external data is currently acquired, the outlining of current external data integration approaches, to identify the most common problems concerning the integration of external data into DWs and finally, to identify future trends in integration of external data into DWs. The second step is to find a potential method(s) to conduct the research and the third step is to choose the most suitable method for the research. In this work only one method will be used for investigating the different objectives. The reason for this will be given in a later section. These three steps are further developed in Section 4.1. Step four outlines the details of the method chosen and will be introduced in Section 4.2. Finally, the research process will be given in detail in Section 4.3.
There are according to Andersen (1998), Berndtsson et al. (2002), Patel and Davidsson (1994) and Svenning (2000) two categories of methods of how to conduct a research: quantitative and qualitative. Quantitative research methods are according to Berndtsson et al. (2002), used to explain a specific substantive area. The research is usually driven by formulating a hypothesis and then testing it rigorously. The testing is usually performed conducting repeatable experiments. Qualitative research methods are, in distinction to the quantitatives, used when an increasing understanding of a substantive area is preferred. In this work a deeper knowledge is intended to be acquired about the aim given in Section 3.2. and therefore the method of how to conduct a research suitable for this is according to the authors, of a qualitative nature. The knowledge acquired in a qualitative research is according to Patel and Davidsson (1994) claimed to be of a deeper nature than the knowledge acquired in quantitative
Step 1. Develop objectives (section 3.2)
Step 2. Find potential method(s) (section 4.1)
Step 3. Choose method(s) (section 4.2)
Step 4. Present details of the chosen method(s) (sections 4.3 and 5.1)
research which often results in incoherent knowledge. This work aims at getting an increased knowledge of an area in which not much has been written. To get a wider knowledge, several different sources have been used, i.e. empirical data and literature. In this way the information gathered from the different sources is intended to give more descriptive information about the current state of external data integration approaches. There are according to Berndtsson et al. (2002), numerous methods/material collecting techniques that could be used, i.e. literature analysis, interview studies, case studies and surveys/questionnaires. There is no consensus among different authors whether for example, an interview study or a case study is a method or a material collecting technique. The terms used in this work for gathering material are therefore called method/material collecting technique.
As mentioned earlier, the aim of this work is to increase the knowledge of an area that is not well described in the literature. Therefore a literature study can not be performed due to lack of material. This leaves the gathering of information to be performed in two different ways. One way is to perform a case study as an in-depth exploration where a phenomenon is examined in detail. Since there is not much material describing the relevant problem of this work this method could have been used according to Berndtsson et al. (2002). Case studies make it possible to understand and explain a phenomenon which is not yet well understood. But, since the use of the case study method gives a deep understanding of a specific case and the aim of this work is to outline the state of several different cases, this method was not the most suitable method/material collecting technique for this work. Instead of a deep understanding about a specific case this work is interested in receiving more general answers while it enables the researcher to generalise the result. The other way of performing this work is to gather information from a larger amount of respondents to get an overview of their course of action in the matter, described earlier in Section 3.2.
For the purpose of gathering information from different respondents there are two specific methods/material collecting techniques that could be used in an exemplary way. Those two methods/material collecting techniques are: interview studies and surveys/questionnaires. Surveys/questionnaires are however, according to Berndtsson et al. (2002), usually used for exploring a well known phenomenon for which it exists a large amount of respondents having a relevant knowledge of the issue. The subject area of this work is not well known and there are therefore not a large amount of respondents having the relevant information. Another feature of the questionnaires is according to Andersen (1998), that they are not suitable for this work because the questions in a questionnaire should be structured and must be asked in a strict order. A researcher using a questionnaire is limited to only ask the preformulated questions and can not ask follow up questions. This leaves an interview study as the method/material collecting technique most suitable for this work.
4.2. Interview study
There are several different types of interviews. The interviews can be open, structured or a hybrid of those, i.e. semi structured. The interview technique chosen have both advantages and disadvantages. Open interviews are according to Berndtsson et al. (2002), usually chosen when performing a qualitative research. Since the method of how to conduct research of this work, as mentioned earlier, is of a qualitative nature this interview technique could be suitable. Open interviews are further used when the researcher has little knowledge of what specific issues will be discussed during the