Evaluation of electronic commerce forecasts and identification of problems affecting their evaluation
(HS-IDA-EA-99-316)
Mats Knutsson (a96matkn@ida.his.se) Institutionen för datavetenskap
Högskolan i Skövde, Box 408 S-54128 Skövde, SWEDEN
Evaluation of electronic commerce forecasts and identification of problems affecting their evaluation.
Submitted by Mats Knutsson to Högskolan Skövde as a dissertation for the degree of B.Sc., in the Department of Computer Science.
1999-06-10
I certify that all material in this dissertation which is not my own work has been identified and that no material is included for which a degree has previously been conferred on me.
Evaluation of electronic commerce forecasts and identification of problems affecting their evaluation.
Mats Knutsson (a96matkn@ida.his.se)
Abstract
Businesses use forecasts in order to gather information concerning phenomena that are important to them. Since electronic commerce has grown in importance for businesses, forecasts concerning this area are becoming increasingly important. The work presented in this report aims at gathering information useful when improving forecast quality. In practice the report presents a collection of forecasts, concerning business-to-consumer electronic commerce, and a collection of factors affecting electronic commerce forecast outcomes. A categorisation and evaluation of the collected forecasts is performed, this evaluation is done by comparing the forecasts in the categories to the actual outcomes. Problems that occur during the evaluation process, such as problems with forecast wording and scope, are described, and suggestions of how to avoid these problems are provided. Structured methods to categorise and evaluate the forecasts are also presented. Finally, the outcome from the evaluation is analysed using the compiled factors and indications are given of how to use the results in order to improve future forecasting.
Contents
1 Introduction...1
2 Background ...2
2.1 Electronic commerce ... 2
2.1.1 History of electronic commerce ... 2
2.1.2 EC concepts... 4
2.2 Forecasting... 7
3 The problem ...10
3.1 Delimitations... 10
3.2 Formal definition of the problem... 11
3.3 Expected outcome... 11
4 Method ...12
4.1 Methods to collect forecasts ... 12
4.2 Methods to find factors influencing forecast outcomes... 12
4.3 Work description... 13
5 Collected material...15
5.1 Collected forecasts ... 15
5.2 Collected material for identification of factors... 16
6 Factors material analysis ...19
6.1 Compilation of factors ... 19
6.2 Justification of choice of factors ... 20
7 Forecast analysis ...21
7.1 Categorisation method ... 21
7.2 Material ... 22
7.3 Summary of forecast categorisation ... 29
8 Evaluation of forecasts ...31
8.1 Evaluation methods ... 31
8.1.1 Qualitative forecasts... 31
8.3.1 Intelligent agents... 35
8.3.2 Payment methods... 36
8.3.3 EC distribution channels... 36
8.3.4 Qualitative-EC growth... 37
8.4 Evaluation of quantitative categories ... 37
8.4.1 Sales-actual figures ... 37
8.4.2 Sales-percent figures ... 40
8.4.3 Market... 41
8.4.4 Women shoppers... 42
8.4 Evaluation summary ... 42
9
Analysis of evaluation results ...44
9.1 Intelligent agents... 44 9.2 Payment systems... 45 9.3 EC distribution channels ... 45 9.4 EC growth ... 45 9.5 Sales-actual figures ... 45 9.6 Market ... 46
9.7 Summary of results analysis ... 47
10
Discussion ...48
10.1 Collection of forecasts and factors material ... 48
10.2 Compiling factor material ... 49
10.3 Categorisation of forecasts... 49
10.4 Evaluation of categories... 50
10.4.1 Problems related to the categorisation ... 51
10.4.2 Problems related to the problem formulation... 51
10.4.3 Problems with forecast wording... 52
10.4.4 Problems associated with forecast level of detail ... 54
10.4.5 Evaluation results ... 55
10.5 Analysing evaluation results ... 55
11
Conclusions...57
11.1 Conclusions based on the problem formulation ... 57
11.2 Experiences ... 60
11.3 Results put into context... 60
11.4 Future work... 61
1 Introduction
1 Introduction
The work presented in this report starts out from the increasing importance of electronic commerce (EC), initiated primarily by the growth of the Internet during the 1990:s. Electronic commerce started out as phenomena only relevant to large businesses, with applications like EDI (Electronic Data Interchange) and EFT (Electronic Funds Transfer) (Seldon, 1997). But today EC is also relevant to medium sized and small businesses (OECD, 1997; Fredholm, 1998). Some of the features that make electronic commerce attractive to businesses are, among others, the possibility of cost savings and the ability to access new markets (Fredholm, 1998).
When faced with decisions concerning the future businesses often use forecasts to gather information in order to optimise the decision (Makridakis & Wheelwright, 1987). Forecasting is a way to predict the future, with the help of information (Oxford Dictionary, 1992). This use of information is what makes forecasting something more than simply guessing. However the use of information also introduces uncertainties to forecasting. This comes from the fact that it is impossible to have exact information about the future (Ackoff, 1981) i.e. forecasts will always involve uncertainties.
Since electronic commerce has become an important concept for all sorts of businesses, a need for forecasts concerning the future of electronic commerce has thereby emerged. In practise these forecasts are often made by independent consultant companies such as Jupiter Communications and Forrester Research. However, since forecasting is not a precise activity, there is a need for ongoing improvement of forecasting methods. One important way to improve forecasts is by comparing the forecast with the actual outcome, and thereby in a feedback manner make relevant changes in the forecasting routines used (Makridakis & Wheelwright, 1987).
Since electronic commerce is such a wide field; including as diverse features as smart cards for patient medical information (Castleman, 1998) and web based online shopping (ISPO, 1997), there is a need to sharpen the focus. This is done by categorising different types of electronic commerce, for instance into business-to-consumer and business-to-business electronic commerce. The focus of this report is on forecasts concerning business-to-consumer EC, made in the mid 1990:s. The sort of forecasts studied could for example be, “by the end of 1998 Swedish web based storefronts will generate a total sale of X million SEK” or “by the end of 1997 intelligent agents will be frequently used in online shopping”.
The aim of this report is to map out the outcomes of past forecasts concerning electronic commerce. While doing so factors that influence the outcomes will be identified and described. Appropriate ways to categorise the forecasts will also be identified in this process. In more detail this means that forecasts must be collected, categorised and evaluated, and factors, influencing forecast outcome, must be collected and compiled.
As discussed above this report aims at collecting and compiling different kinds of information useful in improving forecasts. Thereby businesses might have more information about how to make good forecasts in the future, making forecast quality improve.
2 Background
2 Background
In this chapter background information on the different concepts studied in this report are presented. A short description of electronic commerce history as well as ways to categorise and define electronic commerce is presented.
2.1 Electronic commerce
2.1.1 History of electronic commerce
Electronic commerce is not—despite the intense media hype during the last years—a new phenomena. The first EC applications were already in use in the sixties. Among the early applications were, for instance, early EDI (Electronic Data Interchange) systems. However it is not until the dawn of the Internet that EC has become indispensable (Fredholm, 1998).
The history of electronic commerce is tightly associated with the emerging communication technologies, and it is striking to see that whenever a new way of communicating appears, it soon gets a commercial area of use. Given the fast development of information technologies in general, and the Internet in particular, during the nineties it is thereby not surprising to see that electronic commerce has boomed in the last five to ten years. The Internet is the primary force driving the emergence of electronic commerce (Bollier, 1995). Internet went, during the mid 1990:s, from being of interest primarily to education and research institutions, to being a medium for electronic commerce. In December 1993, 4.6% of a total of 623 web sites had the extension .com, i.e. representing commercial sites, while in January 1996 50% of a total of 100,000 web sites were .com (Figure 1) (Kolding, 1996).
Figure 1. Percent of .com sites from total number of www-sites. From Kolding (1996)
Percent of .com sites
0 20 40 60 % december 1993 january 1996
2 Background
security (Nicholls, 1998). It is estimated that 65% of current Internet users have “shopped around” online (ICC, 1998), together with the estimate of 147 million users (CyberAtlas, 1999), this gives 95 million potential customers for a online shopping business.
Other statistics exemplifying this are figures from the Swedish electronic commerce scene; by the end of 1998 almost 3 million people in Sweden, of a total of 8.5 million inhabitants, had Internet access, representing a 36% growth rate from 1997. In December 1998, over 1 million Swedes accessed shopping sites, of which approximately 30% purchased goods (NUA, 1999a).
So far mostly large businesses have been able to benefit from electronic commerce, but EC also provides great benefits for smaller companies (Fredholm, 1998; OECD, 1997). The benefits for businesses are, among others; reduced design and manufacturing costs (ISPO, 1998), access to new markets (ISPO, 1998; Northeast Consulting, 1996), increased value of time by the use of intelligent software (intelligent agents) (Bollier, 1995; Garcia-Sierra, 1996; Fredholm, 1998) and increased efficiency in routine tasks like purchase and sales (Fredholm, 1998).
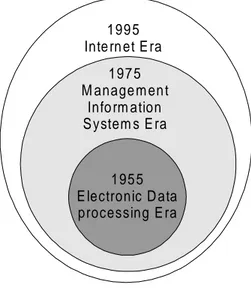
Seldon (1997) provides a structured view of the development of information technologies. This historical view will provide a model for the development of information technologies that will facilitate a definition of electronic commerce.
197 5 M anage m en t Info rm ation S ystem s E ra 199 5 Inte rn et E ra 195 5 E lectronic D ata processing E ra
Figure 2: Development of information technologies (Seldon, 1997)
In this model, presented graphically in figure 2, the development of information technologies can be divided into three stages, which encapsulate each other: the Electronic Data Processing Era, the Management Information Systems Era and the Internet Era (Seldon, 1997).
The Electronic Data Processing (EDP) Era (Figure 2) started about 1955 and lasted about 20 years. During this era the cost of information technologies was at a level that only allowed large companies to buy computers and build EDP systems. A typical computer of this era cost millions of dollars.
During the mid 70´s the cost of information technologies had fallen to a great extent, facilitating new applications such as decision support systems. This era, starting about 1975, is named the Management Information Systems (MIS) Era (Figure 2). This era saw the birth of the PC and client-server computing. Despite the growing use of
2 Background
digital information within firms during the MIS Era, electronic communication between firms was still scarce.
Twenty years later, about 1995, the Internet Era (Figure 2) commenced. The dramatically falling costs of information technologies during this period, has created an increase in the number of possible applications of information technologies to such an extent that terms from the preceding eras, like Management Information Systems, or even Information Systems, are inadequate to describe it. Information technologies has gone from being a topic only for the business community, to be of importance to the community at large. The by far most important technological breakthrough during this era is the Internet. The importance of the internet to electronic commerce is discussed more above.
2.1.2 EC concepts
To enable a precise discussion about EC, definitions and categorisations are at need. The definition clearly states what features that are included in the EC-concept and the categorisation provides tools, which can be used in handling the different features of electronic commerce.
Defining EC
Electronic commerce is not a well defined phenomenon. There are different definitions with different focus, reflecting the authors’ approach to electronic commerce. To highlight these differences three definitions are presented below. Kalakota & Whinston (1996), with their economical and organisational focus give the following definition:
… electronic commerce is a modern business methodology that addresses the needs of organisations, merchants, and consumers to cut costs while improving the quality of goods and services and increasing the speed of service delivery. The term also applies to the use of computer networks to search and retrieve information in support of human and corporate decision making. (Kalakota & Whinston, 1996, page 1)
While the US Department of Defence gives the following, more technically oriented definition:
Electronic Commerce (EC) is the paperless exchange of business information using Electronic Data Interchange (EDI), Electronic Mail (E-Mail), computer bulletin boards, FAX, Electronic Funds Transfer (EFT), and other similar technologies. (Mañas, 1997)
2 Background
Any form of business transaction in which the parties interact electronically rather than by physical exchanges or direct physical contact. (ISPO, 1998). These three definitions show that “electronic commerce” has different meaning to different authors. This fact makes it important to always take into account the authors’ definition when relating to their work.
Seldon (1997) provides yet another definition, based on the term Internet-era technologies, which is presented above, and can thereby present a brief and concise definition:
Electronic commerce is commerce enabled by Internet-era technologies. (Seldon, 1997)
From now on, if not explicitly stated otherwise, this is the definition of electronic commerce used in this report. The choice of this definition is motivated by its short and concise form, yet fully covering all traditional features of the EC-concept.
Categorisation
Electronic commerce, as defined above, is a wide concept, including web based shopping as well as electronic economic transactions between large businesses. This diversity raises the need for a categorisation of different types of EC, which later is used in the delimitation of the problem.
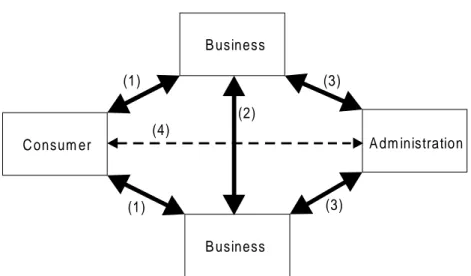
ISPO (1998) provides the following categorisation of electronic commerce:
(1) Business-to-consumer (2) Business-to-business (3) Business-to-administration (4) Consumer-to-administration
2 Background B usiness B usiness A dm inistration C onsum er (1) (1) (2) (3) (3) (4)
Figure 3: Categorisation of EC, from ISPO (1998)
(1) The business-to-consumer category largely equals electronic retailing (i.e. online-shopping). Typical applications within this category are software for online shopping, combined with either traditional ways of payment like cash on delivery, or electronic payment methods such as credit cards or electronic cash (Neches, 1996).
(2) The business-to-business category encapsulates phenomena such as EDI (electronic data interchange) and EFT (electronic funds transfer) (Kalakota & Whinston, 1996). Despite the media hype concerning business-to-consumer applications, business-to-business electronic commerce is estimated to be two times as big as business-to-consumer electronic commerce (Noack, 1997).
(3) The business-to-administration category involves electronic transfers between companies and all sorts of governmental and other public organisations.
(4) The last category, consumer-to-administration is not yet of great importance (ISPO, 1998). That is why it is represented by a dashed line in Figure 2. However, researchers see a large potential for growth in this category (Castleman, 1998). Examples of applications in this category could be the use of smart cards to keep track of educational services or medical records (Castleman, 1998).
Yap (1997), provides a partially different categorisation of electronic commerce. He distinguishes three categories, namely business-to-business, business-to-consumer and intra-organisation. When providing this categorisation Yap (1997) leaves out all administration interchange and instead including, like Kalakota & Whinston (1996), intra-organisational aspects into electronic commerce. According to Seldon (1997) this categorisation partially misses the core of EC, because it does not empathise the new characteristics of EC. Further, this categorisation does not match the definition of
2 Background
Any form of business transaction in which the parties interact electronically rather than by physical exchanges or direct physical contact (ISPO, 1998)
and the definition from Seldon (1997):
Electronic commerce is commerce enabled by Internet-era technologies. (Seldon, 1997)
The only thing that differs between the two definitions at hand is that ISPO (1998) use of the term, interact electronically, while Seldon (1997) uses the term Internet-era technologies. Since the Internet-era in Seldons (1997) model encapsulates all the previous information technology eras, the two definitions can be considered equal. This similarity allows the use of Seldons (1997) general definition of EC and ISPO’s (1998) categorisation of different types of EC.
2.2 Forecasting
Forecasting is today a fully fledged academic field of its own (Makridakis & Wheelwright, 1987). This report does however not aim to give a profound account of forecasting, only some basic features of forecasting, necessary when formulating the problem, are accounted for.
Oxford Advanced Learner’s dictionary of Current English (1992) gives the meaning of the word forecast as:
Tell in advance (what is expected to happen); predict with the help of information (Oxford Dictionary, 1992, page 350).
The last part of this definition, predict with the help of information, is a key feature of forecasts. This is what separates forecasting from simple guessing, and gives forecasts a certain amount of credibility.
The possibility to make forecasts about certain critical factors in the future is today essential to many organisations (Makridakis & Wheelwright, 1987; Bergström, 1982). Forecasts are used, for instance, by businesses when making strategic decisions about investments and marketing in new markets.
The usefulness of forecasting has been questioned, mainly because forecasts are based on historical information and not, by definition, on real knowledge of the future (Wallander, 1980; Ackoff, 1981). The study of forecasts in this report is however motivated by the fact that forecasts are in fact used by businesses and other
2 Background
organisations in knowledge acquisition (Makridakis & Wheelwright 1987; Bergström, 1982).
Categorisation of forecasts
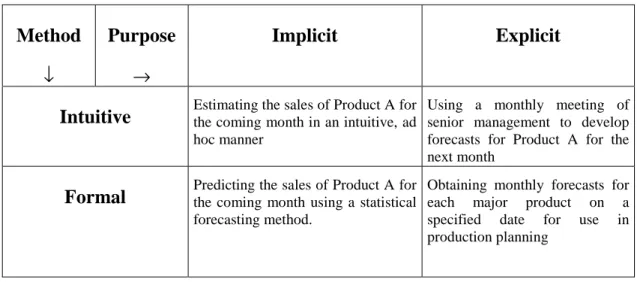
Makridakis & Wheelwright (1987) provides the following categorisation of forecasting, later used in delimiting the problem:
Method
↓
Purpose
→
Implicit Explicit
Intuitive Estimating the sales of Product A forthe coming month in an intuitive, ad
hoc manner
Using a monthly meeting of senior management to develop forecasts for Product A for the next month
Formal Predicting the sales of Product A forthe coming month using a statistical
forecasting method.
Obtaining monthly forecasts for each major product on a specified date for use in production planning
Table 1: Categorising Forecasting Possibilities, from (Makridakis & Wheelwright, 1987)
Intuitive forecasting is internal to the planner, i.e. the planner do not make use of any formal methods. This is however not equivalent to guessing, because the planner may have useful inside knowledge and experience. A drawback to intuitive forecasting is that the planner may be subject to psychological biases, affecting the outcome.
Formal forecasting is based on formal methods, whose steps can be written down. Most formal methods are based on statistical methods.
Implicit forecasts are not part of any particular decision process or other plans. Implicit forecasts are forecasts being made in their own right.
Explicit forecasts are made for a specific reason, like for instance planners make a forecast about the growth of online shopping in order to plan the number of storefront software packages that can be sold.
Another way of categorising forecasts is by how the outcome can be evaluated; quantitative or qualitative (Patel & Davidson, 1994). An example of a forecast which can be evaluated by quantitative means is, by the year 2000 50% of all adult web users will conduct online shopping at least once a week. The correctness of this forecast can be exactly evaluated once the actual number of adult web users conducting online shopping year 2000 is known.
2 Background
Evaluation of forecasts
One important method for improvement of forecasts is to study the performance of forecasts made in the past (Makridakis & Wheelwright, 1987; Bergström, 1982), and thereby try to get information that will facilitate increased accuracy of forecasts in the future. The performance of a forecast is given from how close the forecast is to the actual outcome, i.e. how well the forecast predicts events in the real world. This feedback loop is hence an important part of forecast improvement.
3 The problem
3 The problem
The importance of electronic commerce in contemporary society as well as the need for forecasts about EC, development have been accounted for in Chapter 2. Further Chapter 2.2 shows that one major way in which one can improve forecasting methods is by comparing past time forecasts with the actual outcome in the real world.
The problem to be investigated in this report is based on these facts. This report aims at comparing forecasts, concerning electronic commerce, made in the past with the actual outcomes. By doing so the quality of the examined forecasts will emerge. Further, factors that made the examined forecasts either come true or false will also be identified. This task also raises the need to define what a “factor” is and is not. Implicit in this problem is also the task to find forecasts, relevant to the problem.
3.1 Delimitations
To apply the above described problem to the whole area of electronic commerce and the full range of forecasts is a by far to immense task, thereby the following delimitations are used to set focus on the core problem:
1. Starting with the categorisation of EC presented in Chapter 2.1.2, only forecasts concerning consumer-to-business EC (ISPO, 1998) will be used. This delimitation is taken on because of the novelty of consumer-to-business EC as opposed to business –to-business EC which have been around for a longer time (Kalakota & Whinston, 1996), and is thereby more well known than consumer-to-business EC. Business-to-administration and consumer-to-administration (ISPO, 1998) is not so frequent, and is thereby not so interesting to study.
2. Only forecasts made between the start of 1995 and the end of 1996 will be considered. This limitation in time is motivated by two circumstances. Firstly, statistics show that the consumer-to-business EC was insignificant up until the end of 1994 (Kolding, 1996), which makes forecasts before 1995 scarce. Secondly, prognoses made after 1996 often describe the future some years into the 21:st century, and are thereby impossible to evaluate today.
3. Explicit forecasts (see Chapter 2.2) will not be considered. This delimitation is motivated by practical arguments. Explicit forecasts are, by definition, made in order to solve a particular problem. When a business makes an explicit forecast the outcome is often used internally to the business, and thereby there is no need to make it publicly available. An example of this sort of forecast could be sales managers making a forecast about the use of Internet in order to plan their sales strategy for storefront software. This will probably make explicit forecasts hard to come by. Implicit forecasts, on the other hand, are more general and often conducted by independent consulting agencies, which present their results in publicly available reports.
3 The problem
The work presented in this report aims at evaluating publicly available forecasts, concerning electronic commerce, made between 1995 and 1996. While doing so, factors, that determine the degree of correctness of the forecasts, will be identified and described. The “factor” concept also needs to be studied, and questions like; what is and what is not a factor will be answered. The problem also involves identification of and the division of forecasts in categories, suitable to evaluate as a whole. Further methods to evaluate these categories will be identified and used.
3.2 Formal definition of the problem
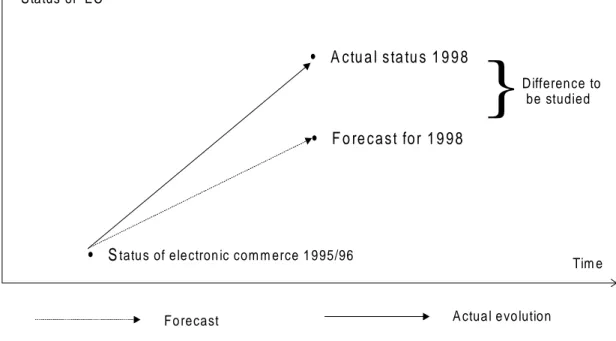
• Statu s of electron ic com m erce 1 995/96
• F o re c a s t fo r 1 9 9 8 • A c tu a l s ta tu s 1 9 9 8 S ta tus of EC
Fo recast A ctua l e vo lution
D ifference to be studied
Tim e
}
Figure 4: Graphical description of the problem
3.3 Expected outcome
Due to the fast development of electronic commerce, and to the uncertainties involved in all forecasting, it is likely that many forecasts made between 1995 and 1996 will be inaccurate, either over- or underestimating the speed of EC development.
Factors affecting forecast outcome will most probably be factors that have an impact on EC development in general, like political decisions, technical development and introductions of standards. However it is very difficult to make any predictions of these factors before the actual investigation has been conducted.
4 Method
4 Method
The previously described problem states a number of tasks which results will be analysed in this report, for instance collecting and categorising forecasts, finding factors that influence forecast outcomes, and finding methods to evaluate forecast categories. Solving these tasks in an organised way demands the use of structured methods. This chapter will discuss available methods and choose one or more methods that will be used.
4.1 Methods to collect forecasts
There are two major ways in which forecasts can be collected, either by studying the printed sources where forecasts are presented (literature studies) or by interviews with people responsible for the forecasts.
Both of these two methods can be further refined. Interviews can be subdivided into oral interviews or written inquiries (Patel & Davidson, 1992), while literature studies can be divided into traditional search in printed text like scientific reports and books, and online search, typically using the internet.
The collection of forecasts will be conducted through literature studies, both on- and offline. No interviews of any sort will be conducted. This choice of method is motivated by one major reason:
It will most likely be difficult to get accurate information about forecasts made so long ago as 1995/96 by the use of interviews. The people in the target group for the interviews are likely to have forgot much about the forecasts they made in 1995/96. Text, online or offline, however is permanent in that way that does not change quality over time, i.e. it is either fully available or completely removed from the web.
4.2 Methods to find factors influencing forecast outcomes
Like the above discussed methods for collecting forecasts there are two major ways to find factors influencing forecast outcomes; interviews (or case study) and literature studies.
Because of the difficulties in defining a suitable target group for interviews or a case study concerning factors that influence forecast outcomes, literature studies will be used to find the factors.
More practical, the way in which literature studies will be used to solve the problem at hand is by identifying factors that different authors think are important for electronic commerce acceptance and growth. These factors will then be compared and put together to form the factors by which forecast outcomes will be analysed.
4 Method
4.3 Work description
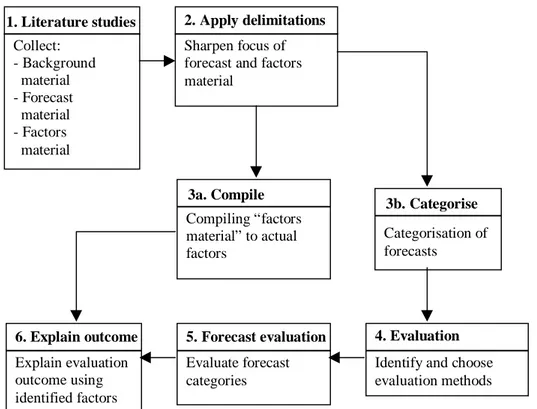
1. Literature studies Collect: - Background material - Forecast material - Factors material 2. Apply delimitations Sharpen focus of forecast and factors material4. Evaluation methods
Identify and choose evaluation methods 5. Forecast evaluation Evaluate forecast categories 6. Explain outcome Explain evaluation outcome using identified factors 3a. Compile 3b. Categorise Categorisation of forecasts Compiling “factors material” to actual factors
Figure 5. Graphical work description
Step 1. The outline of the work presented in this report involves an extensive literature study. Both the collection of forecasts as well as material on the identification of factors influencing forecast outcomes are to be performed based on literature studies. Material for the background and problem formulation also have come from literature studies, often from the same sources as material for the forecasts and factors will be collected from. This led to that, in practice, only one literature study was conducted, collecting background as well as forecast and factors material. Because it was not possible to know which forecasts and “factors material” which were to be useful before the problem definition was stated, a large amount of material concerning forecasts and factors was collected in step 1.
Step 2. When the problem has been defined and delimitations stated, part of the material, relevant to the problem and within the limits of the delimitations, is selected to be used in the work.
Step 3. The next step is to categorise the forecasts, using forecast characteristics such as those described in Chapter 2, for example quantitative or qualitative (Patel & Davidson, 1998) outcomes, and to compile the “factor material” into actual factors that can be used to explain the outcomes of the forecast categories.
Step 4. When this step will be conducted, evaluation methods to evaluate the different categories of forecasts are to be identified and one will be chosen for each category. The chosen methods will then be applied in order to evaluate the forecast categories.
4 Method
Step 5. The identified factors affecting forecast outcomes will then be applied to the results from the evaluation of the forecast categories in order to find explanations for the outcomes.
Step 6. The work is concluded by a summary and discussion of the findings and suggestions for how future work can be based on the findings from this work.
5 Results
5 Collected material
5.1 Collected forecasts
This chapter corresponds to step 1 and 2 in the graphical work model (Figure 5) and thereby simply displays all collected forecasts without any categorisation or other comments. The sources for these forecasts where found both on- and offline. The offline sources used where mainly reports like Bollier (1996) and OECD (1997). The single most useful online source where Staffnet (1998) which provided a majority of forecasts. To find the different sources, on as well as offline, web based search engines like Evreka® where used. Library databases proved to be inadequate for this search, since they did not provide any forecasts (the reason for this is not known). The following are the collected forecasts:
1. Forrester Research Inc. says consumers rang up $530 million in online transactions in 1996 and will drive that up to $7.17 billion by the year 2000 (Staffnet, 1998). 2. Currently, Internet commerce is quite small, representing at most about US$ 500
million world-wide[…]The most conservative forecasts expect growth of at least ten-fold for three to four years, and the most optimistic foresee about US$ 780 billion in 2000 (Killen and Associates) (OECD, 1997).
3. Industry analysis facts and figures for the latter half of 95/96 financial year include; Internet-based commerce will hit $150 billion by 2000 and more than $1 trillion by 2010; sales generated via the web were projected to grow from $17.6 million in 1994 to nearly $400 million in 1995 […] the number of sites using the internet for product transactions will increase from 14% in 1995 to 34% in 1996 and 44% in the next three years.
4. The Yankee group in Boston estimates consumers spent $730 million in 1996; by the year 2000, consumers will account for $10 billion in e-commerce sales (Staffnet, 1998).
5. WEFA projects that by the year 2000, sales on the Internet will hit $13.8 billion (Info-Tech, c. 1996)
6. Jupiter Communications expect the number of U.S. households online to rise from 14.7 million in 1996 to 36 million by the year 2000 (Staffnet, 1998).
7. Within 18 months, the base of connected PCs grew 20 times, to an estimated 10 million people in October 1995-a number estimated to rise to 52 million by the year 2000, according to Forrester Research (Bollier, 1996).
8. According to projections by IDC, by 2000, 46 million consumers in America alone will be buying online, spending an average of $350 a year each (Staffnet, 1998). 9. Forrester Research predicts that three non-technology segments will drive revenues
from the Internet in the year 2000: 1) content; 2) financial services; and 3) consumer retail. Improved security and the increasing number of households on the web will drive consumer retail to $7 billion in 2000 (Staffnet, 1998).
5 Results
10.Women shoppers spent approximately $368 million online in 1996, according to Jupiter Communications. By 2000, Jupiter forecasts that this figure will grow to nearly $3.5 billion, based on the ever-increasing numbers of women going online (Staffnet, 1998).
11.[…] Piper predicts that the most successful distribution channels will be interactive, three-dimensional, virtual environments, with the ability to scale upwards as computing bandwidth capacities increase. The hallmark of the new environment will be variety (Bollier, 1996).
12.[…] , so there are likely to be diverse modes of payment in cyberspace (Release 1.0, January 24, 1995) (Bollier, 1996).
13.According to Hermans, “Agent empowered software that is as effective as a librarian for content search will be available in 1998, and may be expected to be used by a significant number of users near the year 2000.” (Garcia-Sierra, 1996).
5.2 Collected material for identification of factors
As discussed in Chapter 4.2 the way to gather material for identification of factors influencing forecast outcomes are to be done by gathering factors that authors find important for electronic commerce growth and acceptance. This chapter corresponds with step 1 and 2 in the graphical work model presented in Figure 5. The reminder of Chapter 5.2 displays collected material from authors writing about critical factors for electronic commerce acceptance and growth.
Kalakota & Whinston (1996) provides a generic framework for electronic commerce. The framework describes different factors that support all electronic commerce and how they are interconnected.
Electronic commerce applications Common business service
infrastructure
The messaging and information distribution infrastructure Multimedia content and network
publishing infrastructure The Information Superhighway
5 Results
Kalakota & Whinston (1996) provides four infrastructural building blocks that support electronic commerce (Figure 6):
• Common business services, facilitating the buying and selling process. For example services concerning security, authentication and electronic payment. • Messaging and information distribution, i.e. means of sending and retrieving
information.
• Multimedia content and network publishing, for creating a product and a means to communicate about it.
• The Information Superhighway. This is the very foundation for providing the system enabling all electronic commerce communication. The Information Superhighway is as important for electronic commerce as the network of interstate highways for traditional commerce (Kalakota & Whinston, 1996).
The two pillars (Figure 6) supporting both electronic commerce, infrastructure and applications, are indispensable for electronic commerce (Kalakotka & Whinston, 1996):
• Public policy. Laws, standards and general agreements governing such issues as universal access, privacy and information pricing.
• Technical standards. Creating compatibility in information transport and user interfaces.
Another author writing about different parameters necessary for electronic commerce success is Fredholm (1998). He states three wide parameters:
• Technology • Business • Organisation
The technique parameter involves network, hard- and software demands. This wide parameter coincides with Kalakota & Whinstons (1996) technical standards pillar as well as their messaging and information, multimedia content and Information Superhighway building blocks (Figure 6). The next parameter, business, stresses that⎯for electronic commerce to prosper⎯it is important to apply the technique in a way that increases the opportunities to do business. The organisation parameter, deals with the fact that it is difficult to adapt the organisation to new techniques and ways to do business electronically.
Yap (1997) states three barriers that raises obstacles to electronic commerce development. According to Yap⎯for electronic commerce to prosper⎯these barriers must be overcome. The barriers are:
5 Results • Security
• Information Privacy • Legal Obstacles
In the security barrier Yap includes confidentiality, authentication and integrity aspects. He argues that security aspects have become more important to the internet as web based commerce has become more important. This barrier is covered in Kalakota & Whinstons (1996) model (Figure 6) by the common business services infrastructure-building block. The next barrier⎯Information Privacy⎯can be raised unconsciously when trying to tear down the security barriers (Yap, 1997). In trying to solve security problems it is easy to create new privacy problems, such as loss of anonymity. The Information Privacy barrier corresponds to the Public policy-pillar in Kalatota & Whinstons (1996) model (Figure 6). The last barrier also corresponds to the Public policy-pillar (Figure 6) in Kalakotas &Whinstons (1996) model. This barrier is labelled Legal Obstacles, and is, according to Yap (1997) raised from the use of differing legal systems in different countries, i.e. legal systems in different countries may allow and prohibit different things. This raises a problem because the internet⎯which the laws are supposed to control⎯is international, covering most of the planet. Thereby it is often unclear which countries’ laws that can be applied to the internet (Olsson, 1996).
Toohey et al. (1998) stresses the importance of the use of multimedia applications. They argue that, small businesses, in order to get maximum prosper out of electronic commerce must use multimedia to communicate with their customers. Toohey et al. (1998) provides a graphical model for categorisation of different kinds of electronic commerce frameworks:
High Interactivity Text based chat systems Multimedia Audio-visual
group support Text based e-mail and
Messaging
Graphical non-interactive transfer eg., web graphics
Low High Context
Richness Figure 7. Electronic commerce frameworks (Toohey et al., 1998)
Toohey et al. (1998) argues that small businesses can profit from the use of multimedia applications, due to their high interactivity and context richness, in web based shopping (Figure 7). Multimedia applications can, for instance be audio or video applications.
OECD (1997) raises the question of payment over networks (internet). They argue that when the technical problems of fund transfer over a network has been solved, and
6 Factors material analysis
6 Factors material analysis
6.1 Compilation of factors
The material presented in Chapter 5.2 will in this chapter be used in order to identify factors that can influence development and thereby forecast correctness. The work presented in this chapter corresponds to step 3a in the graphical work model presented in Figure 5.
The choice of factors are based on the topics of the collected forecasts, and is thereby not meant to be covering all of the business-to-consumer field. Further criteria for the factors are that they must be general in that way that factors that only have an impact on a specific forecast will not be used. For example: the use of technical standards in a specific country will not be considered as a factor even though it can affect forecasts of sales in online commerce in that country, on the contrary a factor describing the use of technical standards in general can be used, since it can be used in a general way. The factors that will be used are:
I. Uniform laws
II. Customer multimedia interface III. Funds transfer systems
IV. Security/Privacy V. Integration in business VI. Technical standards VII. Available technology
I. Uniform laws, this factor is based on the work by Kalakota & Whinston (1996), which covers this aspect in their Public policy pile (Figure 6), and Yap (1997) whom also stresses the importance of uniform laws for all actors in the electronic commerce field.
II. Customer multimedia interface, this factor deals with the consumers needs of multimedia interfaces in online shopping (Toohey et al., 1998). According to Toohey et al. (1998) a high degree of multimedia use will increase consumers’ interest in online shopping.
III. Funds transfer systems, this factor is based on the need of well functioning and widely accepted payment systems for online shopping (OECD, 1997). This factor has two features; technical aspects of online payment and consumer acceptance.
IV. Security/privacy. The security/privacy factor deals with the problems of only letting approved persons access information while not intruding on privacy features such as anonymity (Olsson, 1996; Yap, 1997).
V. Integration in business, this factor deals with the integration of electronic commerce in businesses and their organisations (Fredholm, 1998). According to
6 Factors material analysis
Fredholm (1998) this integration is important to get the most value out of electronic commerce.
VI. Technical standards. This factor is named technical standards and is based on material from Kalakota & Whinston (1996) and Fredholm (1998). Kalakotas & Whinstons Technical standards pillar is concerned with the need of compatibility in user interfaces and information transportation, created trough the use of technical standards. Fredholms (1998) technology parameter also stresses this need in terms of software technology
VII. Available technology. This last factor deals with purely technical aspects of electronic commerce. These aspects are covered by Fredholms (1998) Technology parameter. The available technology is of course the very foundation for all sort of online commerce. Without proper technologies there will be no electronic commerce.
6.2 Justification of choice of factors
The chosen factors aims to cover all of the collected “factors-material” presented in Chapter 5.2. The reason for this is that it is favourable if the chosen factors can be used to explain the whole area, and aspects, of business-to-consumer electronic commerce. That way a complete analyse of the results from the forecasts evaluation might be done.
7 Forecast analysis
7 Forecast analysis
This chapter corresponds to step 3b (Figure 5) in the chronological work model presented in Chapter 4. The aim of the chapter is to go through and categorise the forecast material collected in Chapter 5 in order to make it possible to use for evaluation.
7.1 Categorisation method
To enable the categorisation of the forecasts in a structured way, an method is used. Figure 8 graphically displays this method:
Start
Check if new forecast fits any of the existing categories
Can forecast be inserted if existing category is split into two subcategories Can forecast be inserted if existing forecast is split into two or more forecasts
Create two or more subcategories to the category that needs to be split Divide all forecasts in the split category between the two new subcategories
Create a new subcategory to one of the existing categories
Insert the new forecast(s) into chosen category Split forecast into two
or more new forecasts Yes Yes Yes No No No
Figure 8. Graphical description of categorisation method.
The first step in this method involves checking if the forecast to be categorised (the new forecast) fits any of the existing categories. If this is the case, the forecast is inserted in the category.
If the forecast does not fit any existing category, check if the forecast can be inserted into a category if an existing category is split. If the answer to this question is yes, create two new subcategories to the category that is split. Then divide the forecasts in the split category between the two new subcategories and insert the new forecast into chose category.
If the answer is no, check if forecast can be inserted into existing category if forecast is split into two or more new forecasts. If it is so, split the new forecast into two or more forecasts then insert these into chosen categories.
If the new forecast can not be split, create a new category as a sub category to any of the existing categories, and insert the forecast in the new category.
7 Forecast analysis
7.2 Material
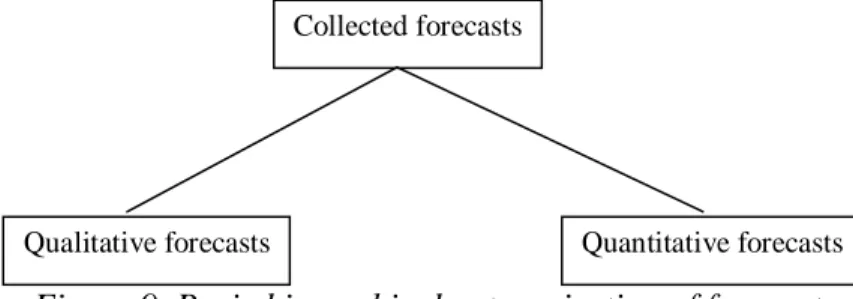
The forecasts presented in Chapter 5.1 are⎯according to the problem formulated in Chapter 3⎯to be categorised. This categorisation will facilitate the evaluation, since very different types of forecasts cannot be evaluated in the same way. The categorisation will be conducted in a way that all forecasts belonging to a specific base category can be evaluated in the same way. The categories are created in a hierarchical manner so that similarities between different base categories are captured by a category at a higher level.
Collected forecasts
Qualitative forecasts Quantitative forecasts Figure 9. Basic hierarchical categorisation of forecasts
Figure 9 displays the basic categorisation of forecasts that is described in Chapter 2. This distinction between forecasts with quantitative and qualitative outcome is well founded in literature (Patel & Davidson, 1998). However, these two categories of forecasts are not enough to categorise the collected forecasts, since it is stated in the problem formulation that all forecasts in one category are to be evaluated in the same way. The creation of further categories will be done by examining the collected forecasts. The remaining part of this chapter deals with this examination and categorisation of the collected forecasts:
1. Forrester Research Inc. says consumers rang up $530 million in online transactions in 1996 and will drive that up to $7.17 billion by the year 2000 (Staffnet, 1998).
This first forecast clearly belongs to quantitative category because it predicts the future in terms of figures that can be mathematically evaluated. Because of the need of a more detailed categorisation than the one presented in Figure 9 (see above), a new category will be created for this forecast. This category will be named EC growth because of the topic of the forecast; growth of EC sales.
2. Currently, Internet commerce is quite small, representing at most about US$ 500 million world-wide[…]The most conservative forecasts expect growth of at least ten-fold for three to four years, and the most optimistic foresee about US$ 780 billion in 2000 (Killen and Associates) (OECD, 1997).
7 Forecast analysis
3. Industry analysis facts and figures for the latter half of 95/96 financial year include; Internet-based commerce will hit $150 billion by 2000 and more than $1 trillion by 2010; sales generated via the web were projected to grow from $17.6 million in 1994 to nearly $400 million in 1995 […] the number of sites using the internet for product transactions will increase from 14% in 1995 to 34% in 1996 and 44% in the next three years.
The third forecast is like the two first clearly belonging to the quantitative category. So far so good, but further examination of the forecast unveils that it is composed of two parts, which, maybe, cannot be evaluated in the same way. The first part of the forecast describes future electronic commerce sales in actual figures, while the latter part deals with percent figures. This calls for the forecast to be split up into two parts that can be categorised separately:
3a. Industry analysis facts and figures for the latter half of 95/96 financial year include; Internet-based commerce will hit $150 billion by 2000[…]
Forecast 3a shows enough resemblance with forecast number 1 and 2 to be categorised in the EC growth category.
3b.[…] the number of sites using internet for product transactions will increase from 14% in 1995 to 34% in 1996 and 44% in the next three years.
The topic of this forecast, increase of product transactions, makes it clear that it fits into the EC growth category. However, as discussed above, this forecast⎯as opposed to the other forecasts in the category⎯predicts the future growth in percent figures rather than actual figures. This raises the need for a split of the EC growth category into two new categories; the Actual figures category and the Percent figures category. Forecasts 1, 2 and 3a will be put into the Actual figures category, while forecast 3b will be put into the Percent figures category. Figure 10 displays the state of the category-tree after the categorisation of forecast 3b.
7 Forecast analysis Collected forecasts
Qualitative forecasts Quantitative forecasts
EC growth
Actual figures Percent figures Figure 10. Hierarchical description of categories
4. The Yankee group in Boston estimates consumers spent $730 million in 1996; by the year 2000, consumers will account for $10 billion in e-commerce sales (Staffnet, 1998).
Forecast number 4 clearly fits into the quantitative category, as its topic deals with the growth of consumer spendings it also fits the EC growth category. Because the forecasts predicts future sales in actual figures it will be categorised in the Actual figures category.
5. WEFA projects that by the year 2000, sales on the Internet will hit $13.8 billion (Info-Tech, c. 1996)
Like forecast number 4, and for the same reasons, this forecast⎯number 5⎯is categorised in the Actual figures category.
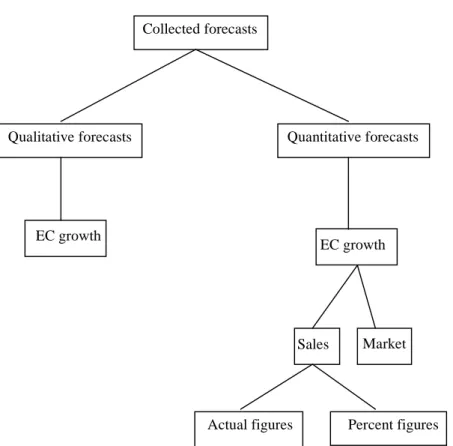
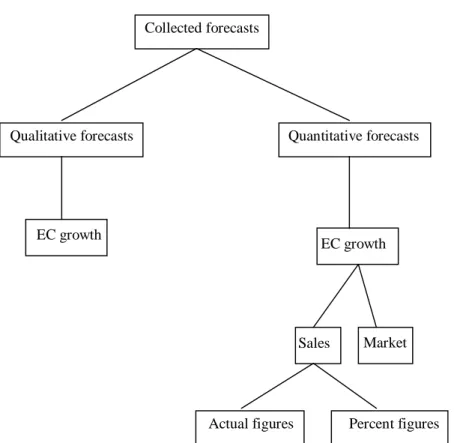
6. Jupiter Communications expect the number of U.S. households online to rise from 14.7 million in 1996 to 36 million by the year 2000 (Staffnet, 1998).
Forecast number 6 predicts the number of online households to grow in quantitative terms (36 million). This makes it possible to put it under the quantitative category. Since it predicts growth of the electronic commerce market it also fits the EC growth category. However it does not fit any of the existing base categories. To solve this problem two new subcategories are created under the EC growth category. The new
7 Forecast analysis
Collected forecasts
Qualitative forecasts Quantitative forecasts
EC growth
Sales
Actual figures Percent figures Market EC growth
Figure 11. Hierarchical description of categories
7. Within 18 months, the base of connected PCs grew 20 times, to an estimated 10 million people in October 1995-a number estimated to rise to 52 million by the year 2000, according to Forrester Research (Bollier, 1996).
This forecast, number 7, is placed in the Market category because it predicts the rise of the number of people with connected PCs, a topic that fits the Market category. This categorisation is OK since the forecast also fits the quantitative and the EC growth categories.
8. According to projections by IDC, by 2000, 46 million consumers in America alone will be buying online, spending an average of $350 a year each. (Staffnet, 1998)
Forecast number 8 belongs to the quantitative as well as the EC growth categories because it predicts the growth of the EC market (number of consumers) and the sales (customer spendings) in quantitative terms. However it does not fit any single one of the Sales and Market categories, since the first part of the forecast deals with the market and the latter part with EC sales. This raises the need to split forecast number 8 into two new forecasts, 8a and 8b, that can fit the existing categories.
8a. According to projections by IDC, by 2000, 46 million consumers in America alone will be buying online[…]
7 Forecast analysis
As the argumentation above shows forecast number 8a fits in the Market category and is therefore put in the Market category.
8b.[…] by 2000 […] consumers in America […] will be […] spending an average of $350 a year each.
Forecast number 8b is, based on the argumentation above placed in the Sales category. Because it predicts future consumer spendings in actual figures rather than percent figures this forecast is categorised in the Actual figures category.
9. Forrester Research predicts that three non-technology segments will drive revenues from the Internet in the year 2000: 1) content; 2) financial services; and 3) consumer retail. Improved security and the increasing number of households on the web will drive consumer retail to $7 billion in 2000 (Staffnet, 1998).
The forecast number 9 does not fit neatly into neither the quantitative nor the qualitative category. This is because the first part of the forecast is clearly qualitative, dealing with the future prospects of different features on the internet in qualitative terms, while the latter part of the forecast predicts the growth of EC consumer retail in quantitative terms. Forecast number 9 is therefore split into two new forecasts, 9a and 9b.
9a. Forrester Research predicts that three non-technology segments will drive revenues from the Internet in the year 2000: 1) content; 2) financial services; and 3) consumer retail. (Staffnet, 1998)
As discussed above, this forecast fits the qualitative category. Since there are no base categories in this branch of the tree (Figure 11), a new category must be created. This category is named EC growth since the forecast predicts that consumer retail will drive revenue, and thereby grow, from the internet. The fact that the forecast also predicts that contents and financial services will drive revenue from the internet is not of interest to this work since it deals exclusively with business-to-consumer electronic commerce, and that financial services and content is not considered to belong to business-to-consumer electronic commerce. Figure 12 shows the state of the category-tree after the categorisation of forecast number 9a.
7 Forecast analysis Collected forecasts
Qualitative forecasts Quantitative forecasts
EC growth
Sales
Actual figures Percent figures Market EC growth
Figure 12. Hierarchical description of categories
9b.Improved security and the increasing number of households on the web will drive consumer retail to $7 billion in 2000. (Staffnet, 1998)
Forecast 9b is placed in the Actual figures category because it deals with the growth of consumer retail (sales) in the future, measured in actual figures.
10. Women shoppers spent approximately $368 million online in 1996, according to Jupiter Communications. By 2000, Jupiter forecasts that this figure will grow to nearly $3.5 billion, based on the ever-increasing numbers of women going online (Staffnet, 1998).
Forecast number 10 fits the quantitative category since it predicts the future in quantitative terms. It also fits the EC growth category, since it deals with this topic. However the forecast does not fit very well into the Sales or Market category since the forecast more deals with demographic aspects of internet users. A new sub category is therefor created under the EC growth category. This category is labelled Demographics. Forecast number 10 is categorised in the Demographics category.
11. […] Piper predicts that the most successful distribution channels will be interactive, three-dimensional, virtual environments, with the ability to scale upwards as computing bandwidth capacities increase. The hallmark of the new environment will be variety (Bollier, 1996).
7 Forecast analysis
This forecast predicts how future electronic commerce distribution channels will evolve in qualitative terms, and therefor fits the qualitative category. Since the topic of the forecast does not match the existing EC growth category (Figure 12) very well, a new category, named EC channels, to reflect the topic of the forecast, is created. Forecast number 11 is put in the EC channels category.
12. […] , so there are likely to be diverse modes of payment in cyberspace (Release 1.0, January 24, 1995) (Bollier, 1996).
Forecast number 12 clearly fits the qualitative category, however since it does not fit any of the existing categories (EC-channels and EC growth) a new category is created to fit the topic of forecast number 12, which is payment methods. Forecast number 12 is put into this new category, labelled Payment methods. A graphical description of the categories after the categorisation of forecast number 12 can be seen in Figure 13.
Collected forecasts
Qualitative forecasts Quantitative forecasts
Payment methods EC channels EC growth
Sales
Actual figures Percent figures
Market Demographics EC growth
Figure 13. Hierarchical description of categories
13. According to Hermans, “Agent empowered software that is as effective as a librarian for content search will be available in 1998, and may be expected to be used by a significant number of users near the year 2000.” (Garcia-Sierra, 1996).
7 Forecast analysis
category. Since its topic, intelligent agents, does not fit any of the existing categories (Figure 13) a new category, named Intelligent agents is created and forecast number 13 is put into it.
Figure 14 graphically displays the final state of the categories and table 2 displays which forecasts belong to which category.
Demographics Collected forecasts
Qualitative forecasts Quantitative forecasts
Intelligent agents Payment methods EC channels EC growth
Sales
Actual figures Percent figures Market
Base category Contains forecasts Super category Does not contain forecasts
EC growth
Figure 14. Final graphical description of category hierarchy
7.3 Summary of forecast categorisation
The graphical description of the forecast category hierarchy presented in Figure 14 displays the final state of the category hierarchy. The first level of this hierarchy represents a split between quantitative and qualitative forecasts, i.e. forecasts which outcome can be manipulated with statistical methods and forecasts which outcome must be analysed through informal methods. This separation is supported by the material presented in Chapter 2.
The next level consists, in the qualitative branch, of base categories, i.e. categories containing forecasts. These are: Intelligent agents, Payment methods, EC channels and EC growth. All these categories are based on the topics of the forecasts belonging to it. No further subdivision was necessary in this branch and thereby this level is the final level. The second level in the quantitative branch consists of the super category EC growth. This category is created to contain all categories containing quantitative forecasts concerning different aspects of electronic commerce growth.
The third level consists in the quantitative branch of three categories, one super category, Sales, and two base categories, Market and Demographics.
The last (fourth) level represents the division between forecasts concerning EC sales which use actual figures and those that use percent figures. These two groups are represented by the two base categories Actual figures and Percent figures.
7 Forecast analysis Category Forecasts Payment methods 12 Intelligent agents 13 EC distribution channels 11 EC growth 9a
Sales-actual figures 1,2,3a,4,5,8b,9b
Sales-percent figures 3b
Market 6,7,8a
Women shoppers 10
8 Evaluation of forecasts
8 Evaluation of forecasts
This chapter, which corresponds to step 4 and 5 in the graphical model presented in Figure 5, aims to display the process of choice and application of suitable methods for evaluation of the collected forecasts. As stated earlier, the different categories were created in such a way that all forecasts belonging to a specific category can be evaluated in the same way. During the evaluation of the qualitative categories, it became obvious that this does not hold. The qualitative forecasts displays too big a diversity to enable this. However, the categorisation is useful in another way since forecasts on a common topic need to have certain common terms defined. This is discussed further in Section 8.2.1. The quantitative categories are still used so that all forecasts in a specific category can be evaluated in the same way.
When evaluating the collected forecasts the most important difference between the forecasts is if their outcome are qualitative or quantitative (Patel & Davidson, 1998). Quantitative forecasts can be evaluated using well defined statistical methods, while qualitative forecasts must be evaluated in a more informal way. Because of this difference, evaluation methods for the categories containing qualitative and quantitative forecasts will be dealt with in two different subchapters.
8.1
Evaluation methods
8.1.1 Qualitative forecasts
Qualitative forecasts must, as discussed above, be evaluated in an informal way due to their informal content. However⎯in a wider perspective⎯qualitative and quantitative forecasts are evaluated in a similar way, by comparing the predicted outcome to the actual outcome. In fact, when it comes to evaluating qualitative forecasts this is all that can be formalised. Thus a method for evaluation of qualitative forecasts simply is to compare the predicted outcome to the actual outcome. The actual comparing cannot be formalised or described more thoroughly because it differs depending on the theme of the forecasts. One big problem when evaluating qualitative forecasts is that they often must be interpreted in order to be evaluated. This problem is so important that it will be separately dealt with in a section of its own.
8.1.2 Quantitative forecasts
In contrast to qualitative forecasts, quantitative forecasts can be evaluated in a formal manner. Because of their common quantitative nature, all categories on the quantitative branch can be evaluated using the same method which will be presented in this chapter.
8 Evaluation of forecasts
Actual outcome
A
B
C
Forecasts Figure 15. Visual example of evaluation model
Upper end of error tolerance
Lower end of error tolerance
The categories can be evaluated by the use of statistical methods. It is for instance possible to evaluate each forecast by comparing its prediction with the actual outcome, and if the prediction matches the outcome the forecast is considered to be true, otherwise, if the prediction does not match the actual outcome the forecast is considered to be false. Of course, forecasts cannot be considered true only if they match the outcome exactly. If this where the case almost all forecast would fail. Instead a forecast is considered to be true if it predicts the outcome within a certain range of the actual outcome, say within ±10% of actual outcome. This is illustrated by Figure 15, which displays three forecasts. Forecast A which will be considered false because it does not reach the lower part of the correct area, forecast B which is considered true because it stays within the correct area and finally forecast C which is considered false since it dose not stay within the correct area. When all forecasts in the category are evaluated, the category is considered to be true if the true forecasts outnumber the false forecasts and false otherwise. The benefits of this method are that it is easy to use and to apply. The downside is that the evaluation is not very detailed, it only displays whether the forecasts predicts the future correctly or not. Details about how far the prediction is from the actual outcome is lost.
This problem can be solved by applying a different method that takes into account how much each forecast in a category deviates from the actual outcome. The category itself is then evaluated by summarising the outcome from each forecast and calculating a mean divergence (Bergström, 1989). This method benefits from the fact that it is more precise, i.e. describes more details, than the previously described one. The downside is that this evaluation method can give too much details, this is a problem when the evaluated forecasts do not have a high degree of detail or when the actual outcome is unclear. Too much details can in a case like this give a false sense of security, when the evaluation in a sense gives a more detailed result than reality can.
Because of the limited degree of detail in the collected forecasts, many lacking detailed chronological information, the first model described will be used. Forecasts
8 Evaluation of forecasts
X is
{
true if |Vf - Vo| ≤ Vo * E false otherwise
Where X is a forecast, Vf is the forecasted figure, Vo is the outcome in the real world
and E is the error tolerance, for instance 10%. The category itself will then be evaluated by applying the following formula:
C is
{
true if T - F ≥ 0 false otherwise
Where C is the category, T is the number of true forecasts, F is the number of false forecasts.
8.2 Problems with evaluating forecasts
A number of problems have occurred when trying to evolve the different forecasts, like may other forecast features, these problems can be divided into two groups; one that contains problems related to the evaluation of qualitative forecasts and one that contains problems related to the evaluation of the quantitative forecasts. These two groups will be dealt with, each in its own section.
8.2.1 Problems with the evaluation of qualitative forecasts
As discussed in the introduction to Chapter 8, the most striking problem when evaluating the qualitative categories, is that common evaluation methods can not be applied to all forecasts of a particular category. This is because the qualitative forecasts displays such a wide variety of ways to describe a specific topic. It is important to notice, however, that this problem have not caused any practical problems to this work because all of the qualitative categories contains only one forecast. It become obvious during the evaluation however that if any other forecasts were to be added to one of the categories, they would probably not be able to be evaluated in the same way as the forecast already belonging to the categories. The categorisation is not however completely pointless, during the evaluation it become clear that in order to evaluate the qualitative forecasts different key concepts must be defined. For example: all forecasts in the Payment methods category needs the term “payment method” defined. The categorisation is then useful because it can serve as a way to share these definitions between different forecasts (belonging to the same category). To sum up: the different categories of qualitative forecasts are not created in order to make it possible for all forecasts in one category to be evaluated in the same way, but rather to make it possible for forecasts belonging to a specific category to share definitions previously made for important concepts in the category.
A basic problem in evaluating the collected qualitative forecasts has been that they need to be interpreted in many ways. Take for instance forecast number 13:
13.According to Hermans, “Agent empowered software that is as effective as a librarian for content search will be available in 1998, and may be expected to be used by a significant number of users near the year 2000.” (Garcia-Sierra, 1996).