Research
Report number: 2017:15 ISSN: 2000-0456 Available at www.stralsakerhetsmyndigheten.se
Radionuclide release rates associated with
bounding cases featuring relatively early
canister failures in a spent fuel repository
2017:15
SSM 2017:15
SSM perspective
BackgroundIn 2011 the Swedish Nuclear Fuel and Waste Management Co (SKB)
sub-mitted a license application for construction of a geological repository
for spent nuclear fuel according to the KBS-3 method, comprising of
copper canisters, bentonite buffer, backfill and surrounding crystalline
bedrock. The post-closure safety assessment of the repository, SR-Site,
has been reviewed by the Swedish Radiation Safety Authority (SSM) for
five years. During the review SSM commissioned the Southwest Research
Institute (SwRI) to develop a model independent of SKB’s model to
simu-late the canister failure due to isostatic load. SwRI built up the model
based on their understanding of SKB’s model description. From SwRI’s
modelling it could be confirmed that SKB’s modelling results were
rela-tively consistent with the description SKB provided of the performance
assessment model, of the model assumptions, and of the model inputs
for the isostatic load scenario.
Objective
The objective of this study is to investigate the consequences of extreme
scenarios (here called bounding cases), assuming that all of the deposited
canisters fail during different time spans after closure of the repository
(e.g. from 1 to 300, 1 to 1 000, 1 to 6 000 and 1 to 100 000 years)
using the earlier developed isostatic load model. The investigation is
both an input to further research (see Need for further research below)
and it can support SSM’s evaluation of regulatory fulfilment.
Results
With the isostatic load model SwRI calculated the average total far- field
radionuclide releases. The bounding case calculations for extreme
scenarios resulted in doses less than the typical background radiation
in Sweden (approximately 1 mSv/yr). The results can be used by simply
scaling the results of the bounding case calculations to fit an estimated
number of canisters from a scenario of interest.
Need for further research
The results of the calculations in this report can be used as source
terms and benchmarking examples for the application of a new model
for radionuclide transport in the geosphere based on a residence time
sampling method that SwRI is developing (SSM2016-763-1).
Project information
Contact person SSM: Shulan Xu
Reference: SSM2016-763-6
Activity number: 3030045-32
2017:15
Author:
Date: March 2017
Report number: 2017:15 ISSN: 2000-0456 Available at www.stralsakerhetsmyndigheten.se
Osvaldo Pensado
Southwest Research Institute, San Antonio, Texas, USA
Radionuclide release rates associated with
bounding cases featuring relatively early
canister failures in a spent fuel repository
This report concerns a study which has been conducted for the
Swedish Radiation Safety Authority, SSM. The conclusions and
view-points presented in the report are those of the author/authors and
do not necessarily coincide with those of the SSM.
SSM 2017:15 1
Contents
1. Introduction ... 2 2. Model Description ... 4 3. Results ... 8 4. References ... 19 APPENDIX 1 ... 201. Introduction
The Swedish Nuclear Fuel and Waste Management Company (SKB) submitted in 2011 a license application for construction of a repository in Forsmark, Sweden, for permanent geologic disposal of spent nuclear fuel. SKB conducted a performance assessment to support its analysis of long-term safety (called SR-Site) of the repository (referred to as KBS-3 repository). In the KBS-3 concept, spent nuclear fuel would be encapsulated in copper canisters. These canisters would be enclosed in a buffer material (bentonite clay) and buried in vertical deposition holes drilled into the floor of emplacement tunnels in granitic rock at approximately a 500 meter depth, where reducing geochemical conditions would prevail. These tunnels would be backfilled with low grade bentonite before repository closure. SKB considered scenarios of canister breaches with release and transport of radionuclides in performance assessments to evaluate radiological impacts of a repository, and documented results of its analyses in the Radionuclide Transport Report (SKB, 2010a, referred also as TR-10-50). We developed an independent model to verify SKB computations (e.g., Pensado and Mohanty, 2012; Pensado et al., 2013; Mohanty and Pensado, 2014) and to evaluate alternative scenarios not explicitly addressed by SKB (e.g., Pensado, 2015; Pensado et al., 2014). In this report, we used the model to examine radionuclide release rates associated with bounding cases featuring relatively early canister failures. The central model we employed
corresponds to the SKB isostatic-load scenario. The objective of these alternative computations is partly to provide the Swedish Radiation Safety Authority (SSM) with additional information of bounding case calculations and partly to provide source terms and benchmarking examples for the application of a new model for radionuclide transport in the geosphere based on a residence time sampling method SwRI is developing.
In the isostatic-load canister failure scenario, SKB assumed lack of radionuclide transport resistance by the canister (comprised of a cast iron insert and a copper outer shell) after its failure, with all of the radionuclide transport resistance and radionuclide retention provided by the buffer material surrounding the canister, the tunnel backfill material, and the geosphere. SKB abstracted the hydrology of the system into three pathways denoted as Q1, Q2, and Q3. In the Q1 pathway,
radionuclides transport by diffusion through the buffer material and discharge into a fracture in the host rock. In the Q2 pathway, radionuclides transport by diffusion
through the buffer material vertically and eventually intercept the excavation damaged zone (which is assumed to allow for groundwater flow) along the edge of the tunnels. In the Q3 pathway, radionuclides transport by diffusion through the
buffer material vertically, and then by diffusion and advection through the backfill in the tunnels, eventually intercepting a water-conducting fracture. Figure 3-1 in the Radionuclide Transport Report (SKB, 2010a) provides a graphical representation of these pathways in the near field. SKB assumed thermally induced spalling to occur in the wall of the deposition borehole, and abstracted the effect of spalling as an enhancement to the radionuclide transport rate, by increasing flow in the Q1 pathway
and reducing transport resistance into the host rock fracture (accomplished by assuming an arbitrarily large aperture of the intercepting host-rock fracture). The Q1, Q2, and Q3 pathways are connected to three independent far-field pathways with
clearly different water travel times and fracture apertures. The releases of these three pathways are aggregated to compute far-field releases and dose estimates.
SKB used constant landscape dose factors (LDF) with units of Sv/Bq to translate release rates per radionuclide in units of Bq/yr into annual dose rates with units of Sv/yr. Three sets of landscape dose factors are referred to as basic, pulse, and
SSM 2017:15 3
distributed dose conversion factors (SKB, 2010a, Table 3-7). The basic LDF was computed by assuming a long-term constant release rate into the biosphere and determining the long-term term equilibrium concentrations of components causing a dose to humans. Maximal concentrations of the interglacial period (the period with the largest associated doses) were selected to define the basic LDF. In the distributed LDF, time-dependent radionuclide releases into the biosphere were considered (caused by distributed failure of canisters in time), and maximal concentrations in dose-causing components were selected. The distributed LDF is less than the corresponding basic LDF for all of the radionuclides (SKB, 2010a, Table 3-7). Finally, the pulse LDF was computed by inserting a unit mass in the biosphere system and computing doses to humans following the insertion of the unit mass of radioactive material. SKB used the pulse LDF to compute doses associated with radionuclides instantly released and exhibiting initial spikes in radionuclide release curves. Because those release spikes are not manifested in computations related to the isostatic-load scenario, pulse LDFs were not used in the computations in this report.
The report is organized in four sections. Section 1 is an introduction. The second section provides a summary of the model, including data sources. Section 3 includes results of the boundary case computations. References are provided in Section 4. It is the prerogative of SSM staff to use information in this report and reach
conclusions suitable to the SSM analyses. We do not offer any additional concluding remarks.
2. Model Description
We developed an approximated model to emulate scenarios described in the Radionuclide Transport Report (SKB, 2010a), namely canister failure due to corrosion, shear load scenario, canister failure due to isostatic load, and growing pinhole failure. SSM Technical Note 2012:58 (Pensado and Mohanty, 2012) describes the model and verification computations of the canister failure due to corrosion and shear load scenarios. SSM Technical Note 2014:33 (Mohanty and Pensado, 2014) includes verification computations for the isostatic load canister failure and growing pinhole failure scenario. In SSM Technical Note 2014:29 (Pensado et al., 2014) and a conference paper (Pensado, 2015), the model was applied to analyse the relevance of radionuclide transport assisted by colloids. We also used the model to examine the importance of Rn-222 in dose estimates (Pensado et al., 2013). The main components of the model and data sources are summarized in this section.
We considered 22 radionuclides (C-14, Cs-135, I-129, Nb-94, Ni-59, Np-237, Pb-210, Pu-238, Pu-239, Pu-240, Pu-242, Ra-226, Rn-222, Se-79, Tc-99, Th-230, U-233, U-234, U235, U-236, U-238, and Ag-108m), and five decay chains (Np-237 → U-233, Pu-239→U-235, Pu-240→U-236, Pu-242→U-238→U-234→Th-230→ Ra-226→Rn-222→Pb-210,
Pu-238→U-234→Th-230→Ra-226→Rn-222→Pb-210). SKB considered 37 radionuclides and did not include Rn-222. The approach to estimate an LDF for Rn-222 is detailed elsewhere (Pensado and Mohanty, 2012; Pensado, et al., 2013). Our model predominantly included relatively long-lived radionuclides, as those are more relevant to long-term safety assessments. Initial inventories and radionuclide half-lives were taken from the SKB Data Report TR-10-52 (SKB, 2010b). SKB adopted non-standard values for the half-lives of Se-79 and Ag-108m (3.77×10⁵ years and 438 years, respectively), based on updated
studies. We used the same non-standard half-lives for those radionuclides (SKB, 2010b, Table 3-7), and standard values for the other modelled radionuclides (SKB, 2010b, Table 3-5). We modified the initial inventory of Np-237 because Pu-241 (half-life 14.3 years) and Am-241 (half-life 432.7 years) both decay into Np-237, and these radionuclides were not explicitly modelled. To simplify the computations, we assumed all of the Pu-241 and Am-241 inventories were present at time zero but in the form of Np-237. For example, the initial total inventory (in all canisters) of 237 alone was equivalent to 6.82 tonnes. On the other hand, the equivalent Np-273 inventory from the decay of Am-241 and Pu-241 was equivalent to 16.03 tonnes. In our simulations we assumed a total of 6.82 + 16.03 = 22.85 tonnes of initial Np-237 inventory. The majority of the inventory of Np-237 at later times derives from the decay of the Pu-241 and Am-241 parents.
A fraction of the inventory of C-14, Cs-135, I-129, Se-79, Tc-99, Ni-59, and Nb-94 was assumed to be released into the in-canister water immediately after canister failure, and a fraction of the radionuclide inventory of C-14, Se-79, Tc-99, U-233, Ni-59, and Nb-94 was assumed to be present in the cladding and metallic structures and released into the in-canister water congruently with corrosion of these structures. We sampled the time for full inventory depletion due to corrosion of the metals from a log-triangular distribution ranging from 100 to 10,000 years, with the distribution mid-value at 1,000 years.
The waste form matrix is assumed to degrade at a constant rate and radionuclides are released to the in-canister water in congruent proportion to the number of atoms in the waste form. The time for complete degradation is sampled from a log-triangular distribution ranging from 106 to 108 years, with the mid-point of the distribution at
SSM 2017:15 5
107 years. Radionuclides are assumed to be released into 1 m3 of in-canister water
and uniformly mixed. Precipitation and dissolution back into the solution is allowed to occur depending on whether concentrations are above or below solubility limits. The near-field transport model includes the three pathways defined by SKB: Q1, Q2,
and Q3. These pathways are inter-connected and co-dependent. Thus, increased
radionuclide transport and release through one of the pathways occurs at the expense of transport and release through the other pathways. The Q1 pathway is a diffusive
pathway (of radial symmetry corresponding to the cylindrical geometry of the buffer bentonite material surrounding the waste canisters) along the radial direction of the deposition hole, with discharge into an intercepting fracture in the host rock. The transport model includes corrections to account for small dimensions of damage on the canister surface (used in the growing pinhole scenario) and the small aperture of the intercepting fracture. SKB refers to these numerical corrections as plugs. These corrections are needed due to the coarse discretization of the pathway. (The coarse discretization is on a scale much larger, on the order of tens of centimetres, than canister openings and fracture apertures.) However, for the isostatic failure scenario it is assumed that the canister offers no resistance to transport (i.e., the opening on the canister is assumed large). Also, it is assumed that thermal spalling of the surrounding rock enhances transport into the intercepting fracture. This assumption was numerically accomplished by adopting a large fracture aperture in the
computation of the corresponding plug correction. An additional amount of flow is assumed to contribute to release into the intercepting fracture, in addition to the flow carried by the fracture. The boundary at the terminus of this pathway is a flow-away boundary condition, with radionuclides carried away at a rate equal to c×q, where c is the radionuclide concentration at the buffer radial end and q is the equivalent flow through the fracture plus the thermal spalling enhancement flow.
The pathway Q2 includes vertical diffusion of radionuclides through the buffer
material (in upward and downward directions) and diffusion-advection in the backfill and excavation damaged zone (EDZ) above the buffer at the top of the canister. Enhanced flow is assumed to develop around the boundary of the tunnel in the EDZ, which would carry radionuclides axially along tunnels and eventually discharge into a far-field pathway.
Finally, the Q3 pathway includes vertical diffusion of radionuclides through the
buffer material (in upward and downward directions) and diffusion-advection in the backfill inside the tunnel along the axial direction. The pathway eventually
discharges into an intercepting water-conducting fracture at the top of the tunnel. A flow-away boundary condition is imposed in this fracture outlet. The tunnel, filled with backfill material (crushed bentonite), is a horizontal cylinder modelled with 5 discrete layers stacked along the vertical direction with diffusion-only vertical connections. Along the axial tunnel length, the tunnel is discretized as
7 compartments—5 downstream from the deposition hole, one upstream of the deposition hole, and one directly above the deposition hole—with diffusive and advective transport along the axial direction. In other words, the flow is assumed to be horizontal, and any vertical movement of radionuclides is exclusively driven by diffusion. The length of the downstream compartments is a function of the distance between the deposition hole and the fracture intercepting the deposition tunnel. This axial length is treated as an uncertain parameter that varies from realization to realization. The entire radionuclide mass within the Q3 pathway is assumed to
eventually discharge into the outlet fracture, which is connected via a flow-away boundary condition to the last downstream discrete compartment at the top of the tunnel. The flow for this flow-away boundary condition is assumed to equal the
fracture flow plus the total flow through the tunnel. For our probabilistic analyses, the distribution of the distance between the deposition hole and the nearest fracture intercepting the deposition tunnel, Ltun, was estimated from data in Table G-8 of the Radionuclide Transport Report (SKB, 2010a). The Ltun distribution was
approximated by a lognormal distribution with a median equal to 5.1 m, and a standard deviation equal to 8.5 m (geometric standard deviation equal to 2.46). The SKB description of the near-field model in the Radionuclide Transport Report (SKB, 2010a) does not provide enough information to accurately reproduce computations. For example, not all distributions used in the stochastic simulations are provided. A number of educated guesses and additional data sources were employed to develop the independent model. For example, we assumed the water flow through the tunnel in the Q3 pathway to be perfectly correlated to the flow
through the EDZ along the axial direction (this EDZ flow is part of the Q2 pathway).
To simulate spalling, flow for the Q1 pathway is increased by an amount defined by
Eq. G-26 on the Radionuclide Transport Report (SKB, 2010a). This equation includes a term dependent on the length of the fracture intercepting the damaged zone, but there is no readily available information in the SKB Radionuclide Transport report to define this length.
Median values are provided in the Radionuclide Transport Report for the relevant equivalent flows for the fracture intercepting the buffer material (𝑄𝑄1𝑒𝑒𝑒𝑒), EDZ flow
along the axial tunnel direction (𝑄𝑄2𝑒𝑒𝑒𝑒), flow through the tunnel with backfill (𝑄𝑄3𝑒𝑒𝑒𝑒),
the distance to the fracture intercepting the tunnel (Ltun), and the travel time through the tunnel (ttun). Data in the report R-09-20 (Joyce et al., 2010) suggest that the flow rates and the Darcy flux (Ur) through the tunnel follow lognormal distributions. From Figure E-5 in R-09-20, we estimated the geometric standard deviations for 𝑄𝑄1𝑒𝑒𝑒𝑒 and 𝑄𝑄3𝑒𝑒𝑒𝑒 to be 4.67 and 2.87, respectively. From Figure E-4 in R-09-20, the
geometric standard deviation for the tunnel Darcy flux, Ur, is approximately 5.3. We used median values of 𝑄𝑄1𝑒𝑒𝑒𝑒, 𝑄𝑄
2𝑒𝑒𝑒𝑒, 𝑄𝑄3𝑒𝑒𝑒𝑒, Ltun, and ttun from Table 3-5 of TR-10-50,
and the estimated geometric standard deviations for those equivalent flows and the tunnel Darcy flux, described in the previous paragraph, to define the lognormal distributions used in the stochastic simulations. The Darcy flux in the tunnel was sampled from a distribution computed as a convolution as follows. First we sampled the distance to the fracture, Ltun, using a lognormal distribution with a median of 5.1 m and a standard deviation of 8.5 m. (This standard deviation was computed from a geometric mean of 2.46, inferred from data in Table G-8 of the Radionuclide Transport Report TR-10-50.) This distance was used to compute a median Darcy flux as Ltun/ttun, where is the backfill porosity (sampled from a triangular
distribution with 0.44, 0.46, and 0.48 as characteristic points, from Table 5-14 of the Data Report TR-10-52), and ttun is the median travel time (=2×10⁶ yr in TR-10-50 Table 3-5). The tunnel Darcy flux was then sampled from a lognormal distribution with a median value equal to Ltun/ttun and geometric standard deviation equal to 5.3 (estimated from Figure E-4 in R-09-20). Distributions for other parameters of the model such as porosities of the buffer and backfill material, diffusion coefficients, and distribution coefficients (i.e., Kd values) are defined in the Radionuclide Transport Report (SKB, 2010a). In Technical Note 2014:33 (Mohanty and Pensado, 2014), we verified SKB deterministic and stochastic computations of the growing pinhole and isostatic failure scenarios using the estimated distributions for flows in the Q1, Q2, and Q3 pathways as described in the previous paragraphs. Our model did
not explicitly include flow resistance terms related to dimensions of fractures intercepting the damaged zone. Instead, we assumed that the EDZ flow rate (flow used in the Q1 pathway to account for spalling) was solely a function of the Darcy
SSM 2017:15 7
flux through the tunnel and a cross section defined by the canister height and a damaged zone length. We used Eq. G-26 of the Radionuclide Transport Report (SKB, 2010a) to define the dependence between the EDZ flow rate and the tunnel Darcy flux. However, we used a separate EDZ flow reduction factor equal to 0.26 to simulate resistance to flow by fractures intercepting the damaged zone. All of the verification computations in Technical Note 2014:33 included this 0.26 reduction factor.
The three release pathways defined by SKB, Q1, Q2, and Q3, are also included in our
far-field transport model. Differing from the near-field pathways, the far-field pathways are parallel pathways, independent from each other. The far-field model accounts for advective-dispersive transport along one-dimensional pathways to describe radionuclide movement along fractures. Matrix diffusion causes
radionuclide mass exchange between fractures and the rock matrix along a direction perpendicular to the flow direction. Equilibrium linear sorption is assumed to operate in the rock matrix. Important parameters of the transport model are the rock transport resistance (F) and the advective travel time (tw). The ratio tw/F is a quantity with units of length, interpreted as the fracture aperture or the ratio of the pathway cross section to the pathway perimeter, and is a variable controlling the extent of mass exchange with the rock matrix. With such parameterization, the SKB description is independent of the pathway length. Different values of tw and F were used for the three far-field independent pathways Q1, Q2, and Q3. For the stochastic
simulations, we estimated a geometric standard deviation equal to 5.6 and 2.84 for F and tw, respectively, from Figure 6-67 of the Data Report (SKB, 2010b). We adopted lognormal distributions for F and tw with median values as in Table 3-6 of the Radionuclide Transport Report (SKB, 2010a), with a geometric standard deviation equal to 5.6 and 2.84 for the F and tw distributions. Recommended distribution functions and deterministic values in the Radionuclide Transport Report (SKB, 2010a) were used for diffusion coefficients, porosities, density of the dry rock, and distribution coefficients.
In our computations, the solubility of radium-bearing phases was decreased relative to values in TR-10-50. Solubility constraints were imposed only in the in-canister water. Solubility distributions were extracted from histograms in Appendix F of the Radionuclide Transport Report (SKB, 2010a). We decreased the solubility of radium-bearing phases by a factor 0.0015 to more closely approximate the SKB computations. Verification computations in Technical Notes 2012:58 (Pensado and Mohanty, 2012), 2014:29 (Pensado et al., 2014), and 2014:33 (Mohanty and Pensado, 2014) all include this adjustment factor to the radium solubility. This adjustment factor is likely the extra correction needed to account for barium-radium co-precipitation (SKB, 2010a, p. 118 and 295). The SKB documentation is not clear as to whether the solubility histogram in Figure F-28 of the Radionuclide Transport Report already includes Ra-Ba co-precipitation adjustments. Our verification computations in the referenced technical notes suggested that the histogram in Figure F-28 does not include any correction factors. Another difference with respect to distributions recommended by SKB is the distribution adopted for the silver Kd for buffer and backfill material. Table 5-16 of the Data Report (SKB, 2010b) recommends a distribution ranging from 0 to 15 m3/kg for the silver Kd. We tried
using a uniform distribution, but the computed releases for Ag-108m were much lower than the SKB results. Selecting a log-uniform distribution ranging from 0.1 to 15 m3/kg produced closer results. Therefore, we used a log-uniform distribution
from 0.1 to 15 m3/kg for the silver Kd for the buffer and backfill material in the
3. Results
We compared our isostatic load scenario results to SKB results to confirm that our model produces reasonably similar results to those published in the Radionuclide Transport Report. We then performed additional computations of bounding cases assuming failure of the copper canister at specific time intervals.
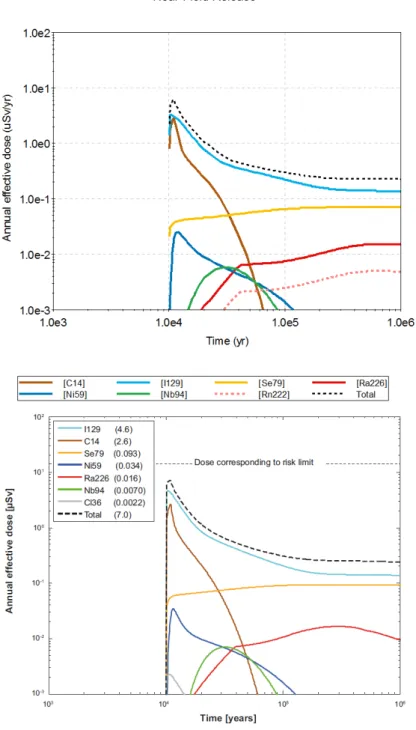
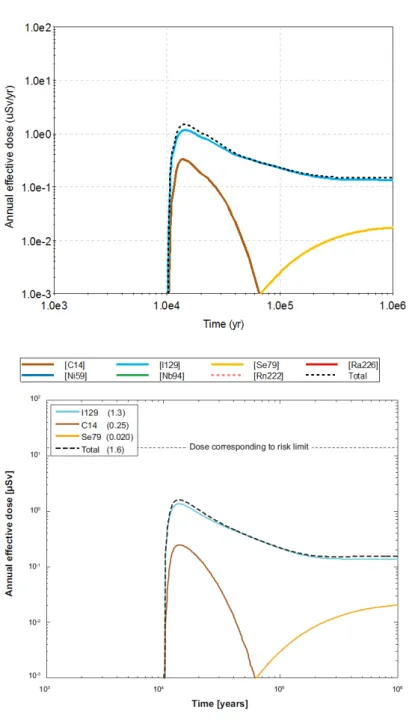
Figure 1 includes deterministic (i.e., run with parameters set at median values) near-field releases of the isostatic case scenario, assuming failure of one canister at 10,000 years and using basic LDF values. Radionuclide release rates (in units of Bq/yr) are simply scaled with the constant basic radionuclide-specific LDF values (in units of Sv/Bq) to derive dose estimates. Because of this linear proportionality, the terms release rate and dose rate are used interchangeably in the discussion that follows. Figure 1 includes near-field release rates that are compared to Figure 6-1 of the Radionuclide Transport Report (SKB, 2010a). Figure 2 displays the far-field release of the same case, and a comparison to Figure 6-2 of the Radionuclide Transport Report. Both sets of results are close in magnitude and trends to SKB release rates.
Figures 3 and 4 present results of additional verification runs. SKB reported results of a probabilistic simulation of the isostatic case assuming all canisters fail at 100 years (SKB, 2010a, Figures 6-63 and 6-64). The SKB documentation is ambiguous in the meaning of all canisters. For example, the Radionuclide Transport Report asserts that approximately one sixth of the deposition holes are connected to water conducting fractures (SKB, 2010a, p. 181). Therefore, we infer that although all canisters may be considered failed, only a fraction would contribute to near- and far-field radionuclide releases. We performed a probabilistic run assuming that canisters fail at 100 years, but only 19 percent of the canisters contribute to radionuclide releases in the near and far fields. We considered 6103 canisters in the repository, and assumed that 1,175 would contribute to near- and far-field releases. In Figure 3 (average values from 500 realizations), the near-field releases of the dominant radionuclides (C-14, I-129, and Se-79) are similar to the SKB results. The total release curve computed by SKB has an early local maximum, shortly after 100 years, associated with releases of the relatively short-lived
radionuclides Sr-90 (half-life 28.1 years) and Cs-137 (half-life 30 years). Those radionuclides were not included in our computations, which is why our near-field total release rate shortly after 100 years is lower than the SKB total release rate and lacks a local maximum. The release curve of Ag-108m also differs from the SKB results. The SKB Ag-108m release rate has a square shape, which is indicative of the presence of solubility constraints and small Kd values in the buffer material. We could match the square shape by lowering the Kd values, but the magnitude of the release rate would significantly increase. All of the Ag-108m is assumed to be instantly released into the in-canister water. Thus, Ag-108m release rates are independent of the rate of spent fuel dissolution. The square shape of the Ag-108 release curve may be matched by detailed selection of distributions for the solubility of silver-bearing phases and Kd values. Other less dominant radionuclides coincide in trends, but differences are apparent in the magnitude of the releases. One notable difference is our higher near-field release rates for Pb-210. The reason for this difference is the explicit inclusion of Rn-222 (child of Ra-226 and parent of Pb-210) in our model. This noble gas would mobilize faster in the system, eventually causing higher Pb-210 releases.
SSM 2017:15 9 Near-Field Release
Figure 1: Near-field radionuclide releases of a deterministic run of the isostatic case, assuming failure of one canister at 10,000 years. The bottom plot shows the SKB results from the same case (Radionuclide Transport Report, SKB, 2010a, Figure 6-1).
Far-Field Release
Figure 2: Far-field radionuclide releases of a deterministic run of the isostatic case, assuming failure of one canister at 10,000 years. The bottom plot shows the SKB results from the same case (Radionuclide Transport Report, SKB, 2010a, Figure 6-2).
SSM 2017:15 11
Near-Field Releases, Mean Curves
Figure 3:Near-field radionuclide releases of a probabilistic run of the isostatic case, assuming failure of 19 percent of the canisters at 100 years. The bottom plot shows the SKB results from an analogous case (Radionuclide Transport Report, SKB, 2010a, Figure 6-63). The scale in the top plot was expanded to 10−4 Sv/yr to include the Pu-240 release curve.
Figure 4 compares far-field releases (average values from 500 realizations) to SKB results. The release rate of dominant radionuclides C-14 and Se-79 are similar to the SKB releases. The release rate of I-129 is slightly higher than in the SKB
computations. For the less dominant radionuclides, our release rates are consistently lower than the SKB results by up to an order of magnitude.
Given the comparable near-field and far-field release rate curves of the dominant radionuclides, we conclude that the selection of 19 percent of the canisters as contributing to release rates is a reasonable selection. Sensitivity analyses discussed later in this report use this same contribution percentage.
Producing a model that precisely matches the SKB results is challenging, due to the guesswork needed to develop distribution functions to compute near-field and far-field flows and other radionuclide transport parameters. However, our independent results confirm that the SKB results are relatively consistent with the description SKB provided of the performance assessment model and the model inputs. Precise verification would be possible if we could inspect the model SKB implemented and the model inputs. Nonetheless, our results are of comparable magnitude to SKB results, and we consider our independent model adequate for deriving a notion of release rates and dose estimates of alternative scenarios.
SSM staff requested an examination of scenarios in which all of the canisters are assumed to fail in the intervals 1 to 100 years, 1 to 300 years, 1 to 1,000 years, and 1 to 105 years. As justified by the verification computations, we assumed that 19
percent of the canisters would contribute to radionuclide releases because only a fraction of them would be connected to water-carrying fractures and have the potential to contribute to radionuclide releases to the biosphere. We considered the same parameters to produce the release rates in Figures 3 and 4, including
distributed LDFs. Those parameters are the same as used in Technical Note 2014:33 (Mohanty and Pensado, 2014), except that this report uses distributed LDFs and the technical note considered basic LDFs. Also, the model in this report includes Ag-108m, which was not considered in previous work.
We executed the model in probabilistic mode. In a given realization, we sampled the failure time and assumed that 19 percent of the canisters would fail at that time. The failure time was sampled from a uniform distribution with bounds [1 yr, 100 yr], [1 yr, 300 yr], [1 yr, 1,000 yr], and [1 yr, 105 yr]. We executed 500 realizations for each
of the first three cases and 1,000 realizations for the last case. In requesting this analysis, the objective of the SSM staff is to gather additional information on the resiliency of the engineered barrier and natural system in limiting doses.
SSM 2017:15 13
Far-Field Releases, Mean Curves
Figure 4: Far-field radionuclide releases of a probabilistic run of the isostatic case, assuming failure of 19 percent of the canisters at 100 years. The bottom plot shows the SKB results from an analogous case (Radionuclide Transport Report, SKB, 2010a, Figure 6-64). The scale in the top plot was expanded to 10−4 Sv/yr to include the Np-237 and Pu-242 release curves.
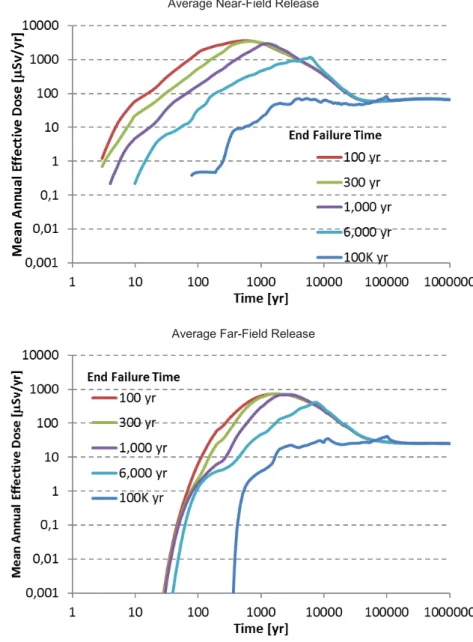
Figure 5 compares the average near- and far-field releases of the several canister failure time intervals. As expected, spreading the canister failure in time in the probabilistic simulations tends to lower the average release rates and dose estimates. The average release and dose estimates for the case canister failure ∈ [1 yr, 105 yr]
are jagged, because we considered only 1,000 realizations. In that run, only 10 realizations have canister failure in the first 1,000 years, and only 100 realizations have canister failure in the first 104 years. Thus, 1,000 realizations provide very
sparse coverage of canister failure during the first 104 years. The [1 yr, 105 yr]
curves can be made smoother by adopting a stratified sampling strategy in the canister failure time. Nonetheless, the conclusion that average release rates decrease with increasing spread in the canister failure time holds true, independently of the use of variance reduction techniques to compute smooth and convergent average release rates.
Average Near-Field Release
Average Far-Field Release
Figure 5: Average near- and far-field radionuclide releases of probabilistic runs of the isostatic case, assuming failure of 19 percent of the canisters at different time intervals. The failure time was sampled from uniform distributions starting at time 1 year, and ending at 100, 300, 1,000, 6,000 and 105 years (the end failure time is indicated in the legends).
SSM 2017:15 15
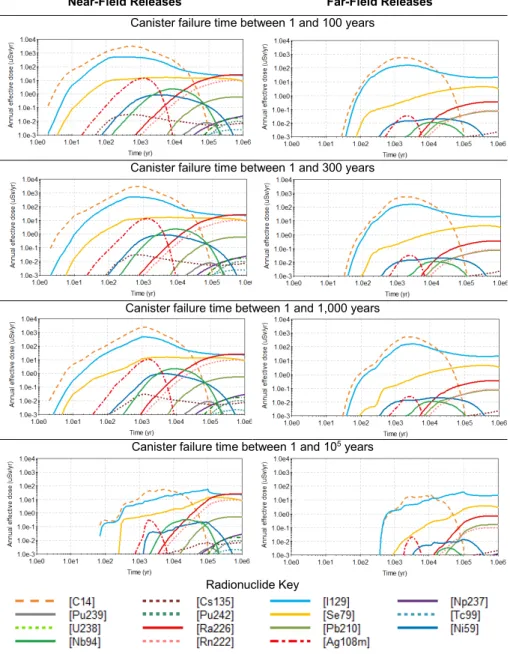
Figure 6 shows the radionuclide contributions to the total near- and far-field releases. The dominant contributors up to 104 years are C-14, I-129, and Se-79. The
dominant inventory of C-14 (up to 71 percent and 64 percent on average) is assumed embedded in metallic structures holding the spent nuclear fuel in place. The C-14 release is controlled by the corrosion rate of those metallic structures. An average of 9 percent of the C-14 inventory is assumed to be instantly released. The Kd of C in the buffer, bentonite material, and the host rock is assumed to be 0 m3/kg. The
components of the system controlling the C-14 release rates are the slow waste form dissolution (for a minor component of the inventory), the corrosion rate of metallic structures, the number of canisters not connected to water conducting fractures, diffusion through the buffer and bentonite material, low equivalent flows in the near field, the groundwater travel time in the far field (a few hundred years), and large transport resistance in the far field (i.e., a large value of the parameter F, inversely related to the fracture aperture). Factors controlling release rates of I-129 are similar, except that I-129 is not present in the metallic structures. The instant release fraction of I-129 is 3 percent on average. Thus, the I-129 near-field release is more
dependent on waste form dissolution than C-14. Finally, factors controlling Se-79 releases are similar to I-129 with one important difference. The solubility of Se-bearing phases in the in-canister water is limited (as opposed to carbon and iodine phases, which are assumed to not have any solubility constraints). Solubility constraints limit the near-field release of Se-79.
This section is concluded with a comparison of the Q1, Q2, and Q3 pathway release
rates. Only results for the [1 yr, 100 yr] and [1 yr, 105 yr] canister failure cases are
provided. The other cases are similar to the [1 yr, 100 yr] case. Figure 7 compares the release per pathway. The Q1 pathway is dominant throughout the simulation
except for a very short cross-over with the Q3 pathway in the [1 yr, 100 yr] case at
around 104 years. Therefore, the model could be simplified by "closing" or
eliminating the Q2 and Q3 pathways. As previously explained, the near-field
pathways are co-dependent: an increase in the release through one pathway causes release rates through the other pathways to decrease. Simplifying the model by eliminating the Q2 and Q3 pathways may conservatively increase dose estimates.
The Q1 pathway is the shortest pathway in the near field. SKB considered only the
Q1 pathway in the main scenarios in the Radionuclide Transport Report (i.e., canister
failure by corrosion and canister failure by shear load). Figure 8 displays average near- and far-field releases for a run with the canister failure time uniformly sampled in the interval [1 yr, 300 yr], with the Q2 and Q3 pathways disabled. The results are
comparable to corresponding results in Figure 6. The bottom plot in Figure 8 compares the total releases for the case with all of the pathways enabled to release with only the Q1 pathway enabled. Interestingly, the Q1-only pathway yields higher
radionuclide releases. These results suggest it is reasonable to dismiss the Q2 and Q3
pathways in simplified performance assessments, as SKB did in the canister failure due to corrosion and canister failure due to shear load scenarios.
As stated in the introduction, the objective of these alternative computations is partly to provide SSM with additional information of bounding case calculations and partly to provide source terms and benchmarking examples for the application of a new model for radionuclide transport in the geosphere based on a residence time sampling method SwRI is developing. It is the prerogative of SSM staff to use information in this report and reach conclusions suitable to the SSM analyses. We do not offer any additional concluding remarks.
Near-Field Releases Far-Field Releases Canister failure time between 1 and 100 years
Canister failure time between 1 and 300 years
Canister failure time between 1 and 1,000 years
Canister failure time between 1 and 105 years
Radionuclide Key
Figure 6: Average radionuclide near- and far-field radionuclide releases of probabilistic runs of the isostatic case, assuming failure of 19 percent of the canisters at different time intervals. The failure time was sampled from uniform distributions starting at time 1 year, and ending at 100, 300, 1,000 and 105 years.
SSM 2017:15 17
Near-Field Releases Far-Field Releases Canister failure time between 1 and 100 years
Canister failure time between 1 and 105 years
Pathway Key Q1
Q2
Q3
Total (Q1+Q2+Q3)
Figure 7:Average near- and far-field radionuclide releases per pathway (Q1, Q2, Q3) of
probabilistic runs of the isostatic case, assuming failure of 19 percent of the canisters at different time intervals. The failure time was sampled from uniform distributions starting at time 1 year, and ending at 100 and 105 years.
Near-Field Releases
Far-Field Releases
Comparison to Releases with Q1 Pathway only
Figure 8:Average near- and far-field radionuclide releases of probabilistic runs (500
realizations) of the isostatic case, assuming failure of 19 percent of the canisters in the interval [1 yr, 300 yr]. The bottom plot compares total near- and far-field releases of a run with the three pathways enabled (solid curves) to total releases computed using only the Q1 pathway (dashed
SSM 2017:15 19
4. References
Joyce S., T. Simpson, L. Hartley, D. Applegate, J. Hoek, P. Jackson, D. Swan, N. Marsic, S. Follin. 2010. “Groundwater Flow Modelling of Periods with Temperate Climate Conditions – Forsmark.” SKB R-09-20. Stockholm, Sweden: Svensk Kärnbränslehantering AB.
Mohanty, S., and O. Pensado. 2014. “2014:33 Technical Note, Reproduction of SKB’s Canister Failure Calculations – What-If and ‘Residual’ Scenario to Illustrate Barrier Functions.” Stockholm, Sweden: Strålsäkerhetsmyndigheten.
http://www.stralsakerhetsmyndigheten.se/Publikationer/Rapport/Avfall-transport-fysiskt-skydd/2014/201433/
Pensado, O. “Relevance of Radionuclide Transport Assisted by Colloids in a KBS-3 Repository.” Proceedings of the 2015 International High-Level Radioactive Waste Management Conference (IHLRWM), Charleston, SC, April 12 – 16, 2015. La Grange Park, Illinois: American Nuclear Society. 2015.
Pensado, O., and S. Mohanty. 2012. “2012:58 Technical Note, Independent Radionuclide Transport Modelling – Reproducing Results for Main Scenarios.” Stockholm, Sweden: Strålsäkerhetsmyndigheten.
http://www.stralsakerhetsmyndigheten.se/Publikationer/Rapport/Avfall-transport-fysiskt-skydd/2012/201258/
Pensado, O., S. Mohanty, and P. LaPlante. 2013. “Verification of Calculational Cases in Performance Assessment for KBS-3 Repository.” Proceedings of the 2013 International High-Level Radioactive Waste Management Conference (IHLRWM), Albuquerque, New Mexico, April 29 – May 2, 2013. La Grange Park, Illinois: American Nuclear Society.
Pensado, O., S. Mohanty, and B. Sagar. 2014. “2014:29 Technical Note,
Independent Modelling of Radionuclide Transport, Evaluation of Colloid Transport Modelling – Main Review Phase.” Stockholm, Sweden: Strålsäkerhetsmyndigheten.
http://www.stralsakerhetsmyndigheten.se/Publikationer/Rapport/Avfall-transport-fysiskt-skydd/2014/201429/
SKB, 2010a. “Radionuclide Transport Report for the Safety Assessment SR-Site.” SKB TR-10-50. Stockholm, Sweden: Svensk Kärnbränslehantering AB.
SKB. 2010b. “Data Report for the Safety Assessment SR-Site.” SKB TR–10–52. Stockholm, Sweden: Svensk Kärnbränslehantering AB.
APPENDIX 1
Coverage of SKB reports
The following reports have been covered in the review.
Table 1: Coverage of SKB reports
Reviewed report Reviewed sections Comments TR-10-50, Radionuclide
Transport Report for the Safety Assessment SR-Site
3.7, 6.1, 6.2, 6.5, Appendix F, G
Source of deterministic and probabilistic data for the model, as well as model descriptions
TR-10-52, Data Report for the Safety Assessment SR-Site
3, 5, 6 Source of inventory, number of canisters in the system, and data for probabilistic mode
R-09-20, Groundwater Flow Modelling of Periods with Temperate Climate Conditions – Forsmark
Appendix E Source of distributions for equivalent flows for Q1, Q2,
and Q3 pathways and Darcy
Strålsäkerhetsmyndigheten Swedish Radiation Safety Authority
2017:15 The Swedish Radiation Safety Authority has a comprehensive responsibility to ensure that society is safe from the effects of radiation. The Authority works to achieve radiation safety in a number of areas: nuclear power, medical care as well as commercial products and services. The Authority also works to achieve protection from natural radiation and to increase the level of radiation safety internationally.
The Swedish Radiation Safety Authority works proactively and preventively to protect people and the environment from the harmful effects of radiation, now and in the future. The Authority issues regulations and supervises compliance, while also supporting research, providing training and information, and issuing advice. Often, activities involving radiation require licences issued by the Authority. The Swedish Radiation Safety Authority maintains emergency preparedness around the clock with the aim of limiting the aftermath of radiation accidents and the unintentional spreading of radioactive substances. The Authority participates in international co-operation in order to promote radiation safety and finances projects aiming to raise the level of radiation safety in certain Eastern European countries.
The Authority reports to the Ministry of the Environment and has around 300 employees with competencies in the fields of engineering, natural and behavioural sciences, law, economics and communications. We have received quality, environmental and working environment certification.