ISSN 1104-1374 ISRN SKI-R--95/67--SE
SKI Report 95:67
Analysis Tools for Reliability Databases
Joan Dorrepaal
January 1996
,
SKI Report 95:67
Analysis Tools for Reliability Databases
Joan Dorrepaal
RISÖ National Laboratory,
DK-4000 Roskilde, DENMARK
January 1996
This report cancerns a study which has been conducted for the Swedish Nuclear Power lnspectorate (SKI). The conclusions and viewpoints presentad in the report
' ...
Foreword:
Ir. Joan Dorrepaal's post-graduate work at RISÖ National Laboratorles mainly during 1995, was evaluated by a supervisory committee at the TU Delft on 1995-12-15.
Two evaluations were given, one relating to the quality of written and verbal
presentations, and the other relating to Ir. Dorrepaal's overall helpfullness, initiative and originality during his project work. Both evaluations were very high (= 9 on a scale of 10).
The analytic tool which Ir. Dorrepaal made during his post-graduate work, will be used and furter tested in March-April 1996, by Prof. RM. Cooke from TU Delft and Prof. Hokstadt from SINTEF, in studies conceming various models about degraded failure modes, competing risks and other active theoretical issues. The outcome of this work will be better analytical tools and new possibilities to use information in reliability databases.
SKI, Stockholm, 1996-02-08
The work presented in this report is performed against the contractor SKI, under the contract; SKI 94441, Dnr 14.2 - 941451.
L
Preface
This report outlinesthe work done in subproject 3 of NKS-RAK-1 (Scandinavian research program on reactor safety) on maintenance strategies and ageing under contract with SKI (Swedish Nuclear Power Inspectorate). In this work we have developed analysis tools that will be installed at the TUD1 reliability database. The TUD database is built to support the maintenance staff at the nuclear power plants (NPPs) and the risk/reliability staff both at the NPPs and at SKI. The analysis tools developed in this work are meant to make the data analysis easier forthese users by guiding them through the steps of a general reliability analysis of a group of components of their choice.
The work is performed at the risk analysis groupsin the Technical University Delft and Ris!ZS, nationallaboratory and financed by SKI. The work is supervised by Prof. R.M. Cooke from the Technical University Delft, J.L. Paulsen from
Ris~, nationallaboratory and R. Nyman from SKI. They gave me the important
feeling that I belonged to their "team" and I'm glad that I can continue working withthemin 1996. In this context I would alsolike to thank Dr. K.E. Petersen, head of the risk analysis department at Ris!ZS for his corrections and suggestions for improvement of earlydraft versions of this report.
I'm grateful to M. Clementz of the maintenance department of Barsebäck and
J. Jönsson and P. Jacobson of the risk/reliability department at Sydkraft Con-sultancy. They could answer many of my questions concerning the background of the operating experience data that is stored at the TUD database. I acknowl-edge the assistance of S. Skagerman and L. Pettersson from the TUD office in supplying me with all the data I asked for.
Further, I would like to stress that I have great ly profit ed from the work of Prof. J. M~ZSltoft from Denmarks Technical University and Prof. D.R. Cox. Most of the analysis tools developed in this work are based on insights I got through reading their clearly written work.
Technical University Delft
Ris~ national laboratory january, 1996
J. W. Dorrepaal
1 An acronym, for Tilforliglighed-Underhal-Drift or Reliability-Maintenance-Operation
l
·
contents
Preface 1 Summary IV l Background l 1.1 Introduction . . . l1.2 Goals of the work . . 3
1.3 Outline of the report 4
2 Investigation of the data collected at the TUD database 6
2.1 Introduction . . . 6
2.2 Type of data collected . . . 8
2.3 Aspects of the data of importance for the analysis 12
3 Description of TUD users and their information needs 16
3.1 Introduction . . . . . . . 16
3.2 Maintenance staff at the nuclear power station . . . · · · l 7
3.3 Risk/reliability staff at the nuclear power station and at SKI 20
4 Tools developed for the TUD users 23
4.1 Introduction . . . 23
4.2 Pooling of equipment and selection of failure events 25
4.3 Analysis tools for a reliability database 28
4.3.1 Quality control tools . . . 29
4.3.2 Trend/line graphs . . . 32
4.3.3 Survival/frequency graphs 36
4.3.4 Competing risks graphs 39
4.3.5 Stratified data plots 42
5 Results and conclusions 44
5.1 Introduction . . . . . . . 44
5.2 Results for the benchmark systems 44
5.2.1 Pressure relief system, 314 . 44
5.2.2 Care vessel spray system, 323 61
5.3 Conclusions . . . 63
i ... Bibliography A Statistical support A.l Introduction .. A.2 Model assumptions
A.3 Counting processes A.4 Survival analysis A.5 Competing Risks . A.6 Significance tests .
A.6.1 Homogeneity tests A.6.2 Trend tests . . . .
B Description of the benchmark systems
B .l Introduction . . . . . . . B.2 Pressure relief system, 314 . . B.3 Core vessel spray system, 323
C Glossary 111 65 67 67
68
74
79
8488
89
90
93 9394
95
98Surnrnary
This report outlines the work performed at Ris!2S national laboratory, under con-tract with SKI (Swedish Nuclear Power Inspectorate). The main goal of the work is to develop analysis tools for reliability databases that can suit the information needs of the users of the so called TUD 2 database, which is a reliability database
(RDB) for 12 nuclear power plants (NPPs) in Sweden and 2 NPPs in Finland. The TUD database stores operating experience data in the form of the failure reports, filled in by the maintenance engineer, that describe the failures and the resulting repair jobs on a large part of the equipment at the NPPs. Furthermore, the TUD contains background data on operating conditions, design, maintenance and test programs on the equipment at the NPPs and registers the changes in operating modes of each NPP ( cold shutdown, hot sh u t down etc).
As NPPs get older, the equipment in the safety and process systems reach an age where the failure data may be observed to deviate from those predicted by the manufacturer. The equipment may experience a "mid-life crisis" and maintenance performance should be reviewed with the purpose of re-optimizing safety and productivity. It turns out that with the proper analysis tools installed, the TUD database is especially powerful in identifying this deviating equipment.
The users of the TUD database are mainly the maintenance staff and the risk/reliability staff bothat the power stations and at SKI. Since 1993 the TUD is structured as a multi-user relational database. The users have direct access to the TUD database through a personal computer that is connected to the server on which the TUD database runs. This so called "client server" application makes it possible for the users to, on line, retrieve and analyse the information at the TUD database as well as supplying data to it.
In this work it is shown that the current multi-user relational database struc-ture of the TUD system can give its users a broader perspective on maintenance performance and safety. Naturally, one can expect that a maintenance engineer has a good understanding of the current state of the equipment (s )he is responsi-ble for. Y et, one can ask oneself the question whether this current state is better than, say five years ago or what the current state is of the whole process/safety system in which the equipment functions. These are exaroples of questions that require a broader perspective on reliabilty and costs. This broader perspective can be acquired with the analysis of proper (historie) operating experience data. The TUD database supplies this opererating experience data.
2An acronym for Tilforliglighed-Underhal-Drift or Reliability-Maintenance-Operation
Summary v
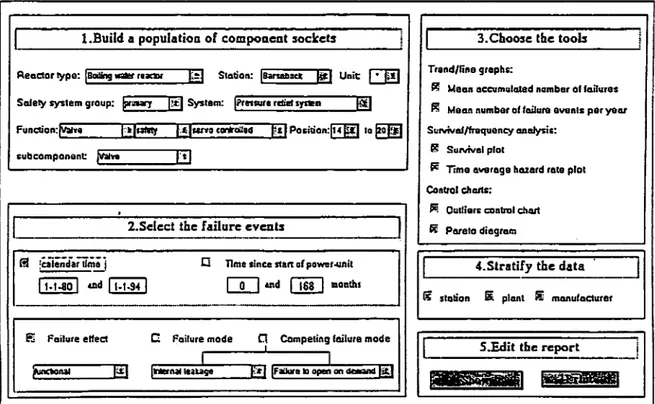
The structure of the TUD databa.se makes it possible for the users to have an enormous fiexibility in building a pool of component sockets for analysis. For example, the TUD user can decide to look at the behaviour of a population of component sockets of the same typ e or (s )h e can choose to investigate a system as a whole and compare the performance with similar systems or component sockets in other NPPs. The analysis tools developed in this work are the result of going through the following analysis steps:
step l. Investigate and select the data; step 2. Make simple plots of the data;
step 3. Analyse the data with statistical methods, including analysis of trend and dependency;
step 4. Combine and implement these three steps in a prototype RDB with an easy user-interface.
l.Build 11 population of compooeat :sockets
Reodor lype: IsOding - roxm
w
Sictio n: laane~~act1!1
U nitrn
Solely syslem group:
Fllllaf)'
l!.ti) Sys lem: IPreuwe relief syrte113.Choo:se the tools
Trand/lina grophs:
g Ma on occumulolad nombar of hoiluras P.: Me an nu m ber of foilura avents per ya or
Function:§vo QltaiiiJ llJuno ""*Oilad
fi!J
Position:~ la~ Survivolflraquency anos!y1;ic:subcampanant: @.,.
2.Sclcct the fllilure eveats
j
---
---r!l ;ciiö;d-artimö
1
11-1-80 l Olld [llill
Q n ma since stan ar power-'lnit
m
Uld ~ lllOIIIhl---·-·---·
.. --··-E Failure elled C Foilure mode a Compeling failure mode
lr.::'"*"::-:-~--.-:-le-.au..._jgo
_ _.,~~
-
k
IFailuta lo o...! on - . s !§;.l,g Surviviii plol
~ Time averaga hozard r111a plol
Conlral ch orts: j5i[ Ouclicus COIIIral eliort Iii! Porala diegram
4. Stratify the data
~ st11tion Ii plant liil manufedurer
S.:&Jit the report
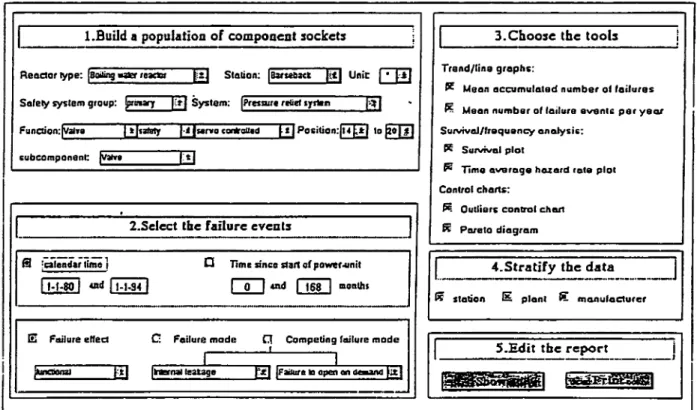
---Figure 0.1: Analysis user-interface for a reliability databa.se
The resulting user-interface of the prototype RDB developed in this work, guides the user through the following steps:
4a Build a population of sockets (subcomponent or component level); 4b Select the time-window and the failure events;
V l Analysis tools for reliability databases
4d Adjust the default report and print the report.
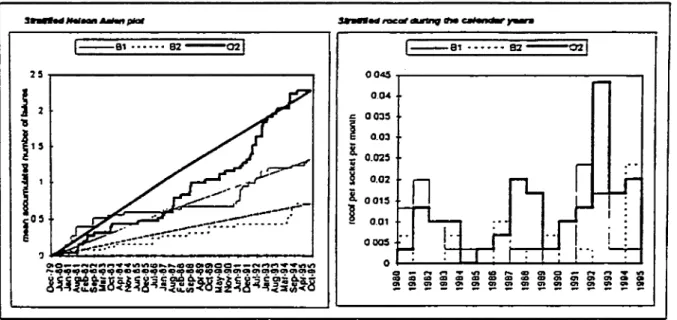
Examples of "simple" analysis tools for a reliability database are giVen m figure 0.2. 1--81 ... 82-021 o.o.c <: OO:lS
i
0.03 R ;; 0.025i
0.02 R o o1s~
0.01 ocos 1--81 ... 97-021Figure 0.2: Examples of analysis tools for a reliability database
The prototype RDB developed in this work, shows that when the proper analysis tools are installed, the TUD database can help its users in identifying possible common cause failures and trends in reliability and costs of a population of component sockets. Furthermore, the infiuence of test/maintenance programs, operating conditions and design can be checked by stratifying the population of component sockets onthese criterea.
.
t
l r lChapter
l
Background
1.1
Introduction
This report outlines the work performed in 1995 at Ris!2S national laboratory, under contract with SKI 1. The main goal of the work is to develop analysis
tools for a reliability database that can suit the information needs of the users of
the TUD 2 database, which is a reliability database (RDB) for 12 nuclear power
plants (NPPs) in Sweden and 2 NPPs in Finland.
The work is part of the NKS-RAK-1 3 project concerning maintenance strate-gies and ageing. As NPPs get older, the equipment reach an age where the fail-ure data may be observed to deviate from those predicted by the manufactfail-urer. The equipment may experience a "mid-life crisis" and maintenance performance should be reviewed with the purpose of re-optimizing safety and productivity. One of the results of this work is that a RDB like the TUD database is especially powerful in identifying this deviating equipment. Furthermore, it is shown that the data.base strucure of the TUD system is especially suitable for giving its users a broader perspective on maintenance performance and reliability of large groups of equipment like a processfsafety system as a whole or a group of component sockets of the same type. This broader perspective can lead to new insights and possible improvements.
For a RDB like the TUD databa.se, at least three types of users can be dis-tinguished:
l. The risk/reliability stajJ, wishing to prediet reliability of complex systems
and equipment at the nuclear power station;
2. The maintenance staff at the power station, interested in measuring and
optimizing maintenance performance;
3. The component designer, interested in optimizing component performance.
1
Swedish abbreviation for Swedish Nuclear Power Inspectorate
2
An a.cronym for Tilforliglighed-Underhal-Drift or Reliability-Maintenance-Operation
3
Swedish abbreviation for Scandinavian Nuclear Sa.fety Program-Reactor Safety-project l
2 Background
Discussions with the TUD office led us to conclude that only the fust two groups of users are considered as users of the TUD database. In this work we have therefore cancerned ourselves with the development of tools that can sui t the information needs of the maintenance staff and the risk/reliability staff both at the power stations and at SKI. From now on we will eaU these two groups of users the TUD users.
The TUD database contains failure reports and engineering reports on a large part of the equipment in the process and safety systems at the NPPs. Further, the TUD registers the changes in operating modes of each NPP. Since 1993 the TUD users have direct access through a personal computer to theserveron which the TUD database runs. This so called "client server" application makes it possible for the users to retrieve and analyse the information at the TUD database as well as supplying data to it. The resulting information feedback loop is illustrated in figure 1.1. NPP maintenance and risk/reliability s taft"
Q
ca.iäa
Analysis tools TUD da.tabasec
·-
·-o -Failure reports Engineering reports NPP operating data
Figure 1.1: Operating experience feedback loop
Currently, the information at TUD database is mainly used for the Swedish T4-book [T-book, 1995] of which an updated version comes out every seeond year. The T-book provides reliability parameters for the unavailability computations that aredonefor the safety-critical equipment at the NPPs as part of the proba-bilistic safety assessments (PSA). Hence, the T-book only considers safety critical failure events. The other main source of information for the T-book are there-fore the Licensee Event Reports (LER) assembled at SKI. The data processing methodology used for the T-book, is described in [Pörn, 1990) and reviewed in [Cooke et al.,1995].
f
!
l
Goa.ls of tbe work 3
The (feedback) analysis tools developed in this work are sup p osed to be in-sta.lled at the TUD database. The idea is that the TUD database provides a simple user in terface that enables the user to easily select the equipment (s )he wants to analyse together with the analysis tools. Next, the tools convert the "raw" TUD data on the selected equipment into a number of simple plots with numerical support. These plots show different aspects of the data and together form a report on the selected equipment. By installing the tools at the TUD database, the TUD users can make updates of that report anytime.
The main problem of the TUD database has been the lack of motivation of the personnel in the maintenance departments to report failures to the TUD database. At many stations the maintenance personnel does not make use of the TUD database, and will consequently not be very happy with the extra e:ffort this reporting demands of them. lmproving the operating experience feedback can improve the motivation of the station personnel responsible for the failure reporting and consequently improve the quality of the failure reporting.
1.2
Goals of the work
The main goal of this work is to supplement SKI's interest in the development of new methods, which can use the information in the TUD database and LERs for maintenance and safety purposes. These new methods are planned to be installed at the TUD office and used by the NPP staff. The users are mainly staff members working with maintenance and safety problems. Moreover, the methods have to support the investigators and inspectors at SKI in their analysis work concerning nuclear safety. The following subtasks are defined by SKI order 94441:
- Discuss maintenance problems in the Nordie NPPs; - Develop measures for maintenance performance;
- Investigate the type of data available to elicit the problems;
- Develop methods for indicating maintenance performance based on the merged data;
- Describe and discuss the problems for the users of the maintenance data;
- Describe the use for the regulatory body SKI of the methods developed.
This work is part of the RAK-1 project, the projectmembers of NKS-RAK-1 have ehosen several common accident sequences to illustrate their meth-ods. These accident sequences concern, along others, two safety systems at the boiling water reactors (BWR) in Sweden and Finland; the pressure relief system (314) and the core vessel spray system (323) respectively. In connectionwith our work, we areasked to look at:
4 Background
- Maintena.nce a.nd a.geing a.spects for 323 low pressure part, control, valves and pumps.
In the remaining part of the report we will refer to all these systems as the
benchmark systems. Descriptions of these systems are given in appendix B.
1.3
Outline of the report
This report describes the steps tha.t are followed in this work. We started our work with the investiga.tion of the type of data. a.va.ilable a.t the TUD database, STAGBAS 5 and the loca.l ma.intena.nce da.ta.ba.se for the equipment in the bench-mark systems. Cha.pter 2 starts with a.n overview of these different databases and their relation to the TUD system. Next, the contents of the TUD failure reports, engineering reports and unit operating time readings are described. A big part of the work concentrated on investigating which a.spects of the data are useful for processing with a.nalysis tools. The conclusions of this work are described in the last section of cha.pter 2.
The objective of the data a.na.lysis should guide the development of the anal-ysis tools. The ma.in objective of the ana.lanal-ysis is already sta.ted in the projects workorder: mea.suring ma.intena.nce performance. Yet, we have made a further investiga.tion into the objectives or information needs of the TUD users, which is described in Cha.pter 3. Cha.pter 3 describes the information needs of the ma.intena.nce sta.ff and risk/relia.bility staff a.t the station and a.t SKI.
The goal of the work is the development of a.nalysis tools that suit the in-formation needs of the TUD users. During the development of (in our opinion) useful tools we went through the following steps:
step 1. Investiga.te and select the data;
step 2. P lo t the data;
step 3. Sta.tistical ana.lysis of the data including analysis of trend and depen-dency;
step 4. Combine these steps in a. prototype RDB.
Most of this work is ba.sed on methods developed within the field of reliability a.na.lysis (repairable systems analysis see [Ascher and Feingold, 1984]). In addi-tion, ideas from the theory of quality control are used to easily present the data and the results of the analysis.
For the statistica.l analysis in step 3, probabilistic models are developed for which the mathematical background is given in appendix A. In this appendix the appropriate models for the failure/repair process of a repairable component socket are discussed. These models differ in the assumptions they make on the failurefrepair process, and their plausibility is therefore evaluated.
Outline of the report 5
In order to check the usefulness of the developed analysis tools, once they func-tion on the TUD system, we have ehosen to build a prototype RDB in Microsoft Offi.ce's relational database package ACCESS. We have loaded this prototype RDB with the TUD data we received for the benchmark systems. The prototype RDB gives us many new insights in the functioning of the TUD system and shows that the fiexibility of this system is the key for the successful use of many of the tools.
The extra benefi.t of creating our own database isthat it is now easy to incor-porate the LERs and even the local maintenance data in this database system. This way we can judge the accuracy of our tools based only on the TUD informa-tion compared to the situainforma-tion where all experience data is available. This work will be carried out in 1996.
As described in the previous section, part of this work is torunthe developed analysis tools on the TUD data on the equipment in the benchmark systems. The results of this data processing is described in Chapter 5. During the work we have discussed our id.eas with members of the maintenance staff at the power station, and the risk staff at the power station and SKI. The discussion of the prototype RDB is done together with:
- Mats Clementz (maintenance engineer at Barsebäck) - Peter Jacobsson (risk analyst at Barsebäck)
- Jerry Jönsson ( consultant at Sydkraft)
- Stig Olsson and Patrick Lindell (SKI inspectors)
and will be briefly described in chapter 5. The work planning of 1995 is given in the table below.
Table 1.1 : Project planning 1995
fe b mar ap r ma y ju n jul aug s ep o et Investigate and classify the data
• •
•
•
Analyse da.ta. a.nd develop tools
•
•
•
•
Mode1 the failurefrepair process
•
•
Identify the information needs
•
Discuss the tools wit the users
•
Make a. prototype program
•
•
nov
Chapter 2
Investigation
of
the
data
collected at the TUD
database
2.1
Introduction
In this chapter we investigate the TUD data available on equipment at each of the 12 NPPs in Sweden and for 2 NPPs in Finland. For the equipment at these NPPs there exist four main information systems that contain operating experience data:
l. TUD database
The TUD database contains engineering reports and failure reports on sub-component socket level for 12 NPPs in Sweden and 2 NPPs Finland. Fur-ther, one can find the NPP operating time readings at TUD. The type of data at the TUD will be further explained in the next section of this chapter.
2. STAGBAS
STAGBAS contains ROs 1 that give information on safety related failure events, including an analysis of failure causes, consequences and corrective actions taken. Since the ROs concern critical events, only the critical failure events that lead to a repair on that same component socket correspond to a failure report in the TUD system. Consequently, STAGBAS only contains a fraction of the failures reported to the TUD system. STAGBAS is currently being modified and will function as a modern relational database much like the TUD system. This means that the analysis tools developed for the TUD system can be easily installed at STAGBAS as well.
3. Local maintenance information systems
The local maintenance information systems are computerised systems for the processing of work orders. These workorders are based on predefined 1
Swedish equivalent of Licensee Event Reports (LERs)
Introduction 7
planned tests and maintenance actions, as well as on reporting of failures discovered during plant operation and outages.
After a detection of a failure at Barsebäck the maintenance engineer fills in a failure report which results in a workorder for a corrective maintenance jo b. Yet, a workorder can also be generated based on a preventive (not result of a failure) maintenance job. Next, the maintenance engineer receives a work permit and can start with the maintenance work. After the maintenance is performed the maintenance history will be incorporated in the failure report which will eventually be included in the TUD database. It is possible that during the preventive maintenance job a failure is detected, this failure will be reported to the TUD as weil. The maintenance engineer follows the sequence:
failure report ::::} work order ::::} work permit ::::} maintenance history in failure report 4. KSU's databaseon plant disturbances and scram reporting
KSU runs a computerized information system covering data on plant dis-turbances and safety-related occurrences. The TUD incorporates the NPP operating history part of this database.
Operating experience databases such as described above are part of a good func-tioning reliabilityfsafety program. Such a reliability/safety program should be integrated in all the phases of the life cycle of the equipment at the NPPs, from design to operation. The next figure refl.ects the result of a good functioning relia-bility program on the reliarelia-bility of the equipment throughout the different phases of the equipments lifecycle and the role of an operating experience database.
Nuclear equipment, e.g. safety systems, are complex, high technology sys-tems that must operate for long periods of time without serious failure and with a very long total life. A great amount of redundancy and diversity is used in nuclear facilities to ensure the safety of the plant. A large portion of the safety systems operate remotely while depending on human operatars for control func-tions. Repairs, inspections and overhaul of equipment are usually done at specific time intervals, when the plant is down for nuclear refueling. This process gener-ally follows a pattern of increasing complexity, depending on the operating times accumulated by the systems.
The physical environment in which the equipment operates is very severe and can have a serious detrimental effect on the camplex mechanical and electronic components of the equipment. High temperatures, high vibration, high humidity and the presence of corrosive fluids and gases take their toll. This means that throughout its operating phase, the reliability characteristics may start deviating from those predicted by the supplier. A reliability database (RDB) like the TUD database can help establishing these deviations. As discussed in Chapter l, we can distinguish three types of users for the TUD database; the component designer, the maintenance staff at the power station, and the risk/reHability staff.
8
,..
..
&: ='..
..
E,..
..
=
~ -~•
a:lnvestigation of the data. collected at the TUD da.tabase
Figure 2.1: Equipment life cycle
O~t-3 c:aU<actJon
~lysa ~nd tcacadb~clt
The role the TUD da.tabase plays in the reliability /safety programs at the NPPs and in the Nordie research programs, is to give its users a broader
perspec-tive on issues concerning safety, reliability, maintenance and costs of the equip-ment at the NPPs. This way, the different types of users can isolate areas of their concem and establish priorities for further investigation.
In the next chapter we try to define the objectives of the maintenance staff and risk/reliability staff and explore their information needs. In this chapter we take a look at the "raw" data which lies in the TUD-database.
2.2
Type of data collected
The TUD database contains failure reports, engineering reports (background data describing the observed equipment) and unit operating data from certain equip-ment in twelve Swedish and two Finnish nuclear units.
In the TUD data.base, the repaired equipment is classified up till the leve! of the subcomponent sockets. A socket is a functional position in a system, occu-pied by one component during one service sojourn. The component socket i.d. consists of the system number and the functional position within the system. The subcomponent i.d. consists of the component socket i.d. and the subcomponent type. Now for each combination of NPP i.d. and socket i.d. the TUD database can supply
- Engineering reports; - Failure reports;
.!
Type of data collected 9
- NPP operating data. Engineering reports
Table 2.1 : Contents of the engineering reports on component socket level and on subcomponent socket level
Content summary on component socket level
Plant Socket Operating modes Maintenance Subcomponents • Station • System • Percentage of total • Interval/frequency • List
• U nit • Position operating time • Dates of activation
of changes of operating modes
In this work, we have used these reports to create a table that contains the subcomponent sockets per component socket i.d. The use of this table will become clear in chapter 4, where we describe the developed prototype RDB.
Clearly, the fields Operating modes and Maintenance can be used for a de-tailed analysis of the component sockets behavior and maintenance performance.
Nevertheless, we have not yet incorporated these fields in our analysis tools and consicler that work for future projects. Ideas for using the Maintenance field are given in [Laakso et al., 1995].
Table 2.2 : Contents of the engineering reports on subcomponent socket level
Plant • Station • Unit
Content summary on subcomponent socket level Socket Manufacturer /design
• System • Code for manufacturer • Position • Type designation • Subcomponent • Codes for design
Operating data • First start time • End of follow up
• Operating environment -interna!
-externa!
• Descriptive codes for operating mode and circumstances
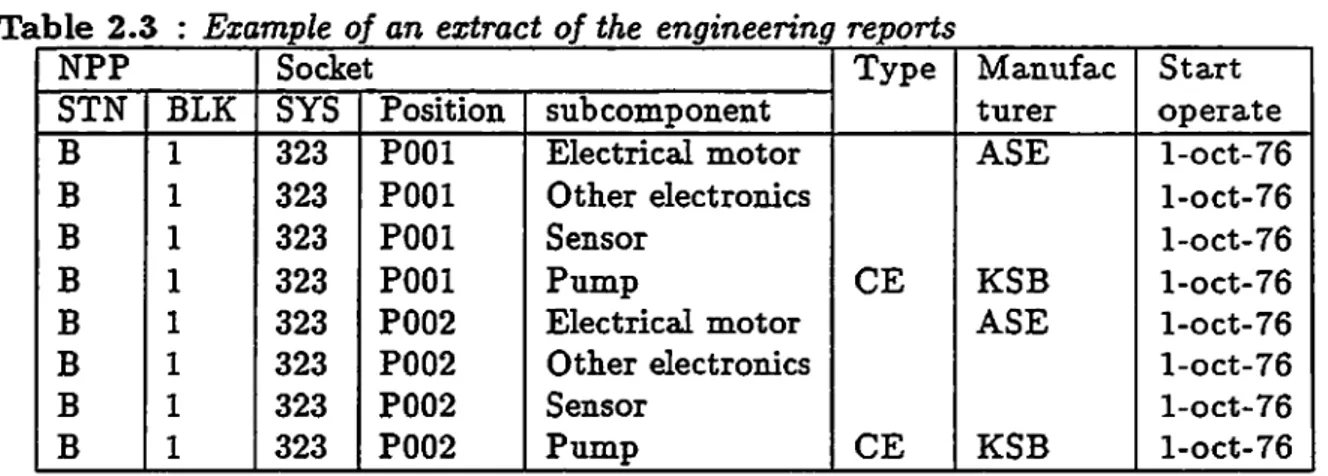
From these reports we have formed a table that contains the subcomponent i.d. together with the information that lies in the manufacturerfdesign field. An extract of this table is given below.
lO
Investigation of the data collected at the TUD databaseTable 2.3 : Example oj an extract of the engineering reports
NPP Socket Typ e Ma.nufac Start
STN BLK SYS Position subcomponent turer opera. te
B l 323 POOl Electrica.l motor ASE 1-oct-76
B l 323 POOl Other electronics 1-oct-76
B l 323 POOl Sensor 1-oct-76
B l 323 POOl Pump CE KSB 1-oct-76
B l 323 P002 Electrica.l motor ASE 1-oct-76
B l 323 P002 Other electronics 1-oct-76
B l 323 P002 Sensor 1-oct-76
B l 323 P002 Pump CE KSB 1-oct-76
This table is included in the prototype RDB sothat it is possible for the user to pool subcomponent sockets of the same design and compare performance of subcomponents from different manufacturers. The other fields in these engineer-ing reports on subcomponent level are not incorporated in the development of the analysis analysis tools. We have made this restriction due to a limitation in time for this work and future work should include these fi.elds.
Failure reports
Table 2.4 : Contents of the jailure reports
Content summary on (sub)component socket level Plant Socket Fa.ilure fields Repair fields
• Station • System • Detection date • Code for repair action • Unit • Position • Codes for: • Date start repair
• Subcomponent -Detection mode • Date replenished -Effect of fa.ilure -Typ e of fa.ilure Text • Failure - observation - type -cause • Repair - action
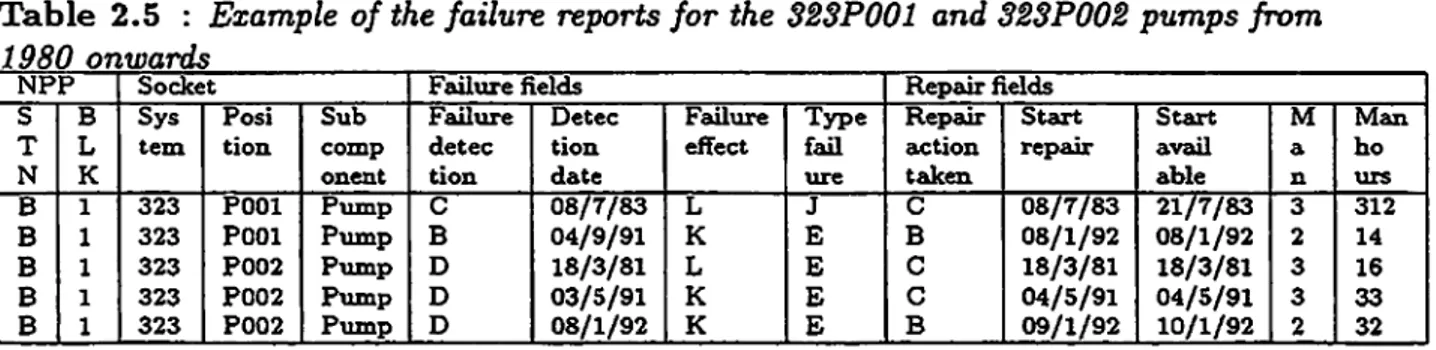
The part of the TUD database that contains the failure reports gives in-formation on the socket time histories. A service sojourn of a socket begins when a new or repaired (sub)component goes online, and terminates when the (sub)component is removed for any reason whatsoever. In this work we have formed a table based on all fi.elds of the failure reports, except the explanatory text. This table forms naturally the basis of the failure data analysis and an extract is shown below.
Type of data. collected 11
Table 2.5 : Example of the failure reports for the 323P001 and 323P002 pumps from 1980 onwards
NPP Socket Failure fields Repair fields
s B Sys Posi Sub Failure Detec Failure Typ e Repair Start Start M Man
T L tem tion comp detec tio n effect fall action repair avail a ho
N K on en t tion date ure taken able n urs
B l 323 POOl Pump c 08/7/83 L J c 08/7/83 21/7/83 3 312
B l 323 POOl Pump B 04/9/91 K E B 08/1/92 08/1/92 2 14
B l 323 P002 Pump D 18/3/81 L E c 18/3/81 18/3/81 3 16
B l 323 P002 Pump D 03/5/91 K E c 04/5/91 04/5/91 3 33
B l 323 P002 Pump D 08/1/92 K E B 09/1/92 10/1/92 2 32
The failure fi.elds of the TUD failure reports give respectively the code for the method of detection, the part that failed, the codes for failure effect and the failure type. The repair fi.elds give respectively the code for type of repair, the data-time that the (sub)component was taken out of service for repair, the date-time t hat the (sub )component was replenished, the number of men used and the manhours spend on the repair job.
Table 2.6 : Failure and repair field coding
Fa.ilure detection Typ e of fa.ilure
A Alarm A Fracture/Crack
B Operation supervision and ser- D Interna! tube leakage vice observation in controlroom E Externa! sealing leakage H Operation supervision and ser- F Interna! sealing leakage
c
D E G
vice observation otherwise G Deformation, displacement Preventive maintenance H Vibration noise
Test I Deposit,blockage
Inspection J Biting, seizure Real demand L bad contact
M Open circuit
~~~~~~---Effect of failure N Groundflnsulation fault --:-A--=w::-o-n':""'t-cl-=--od-=-e-/-=-s-to_p_/-:-di::":'. s_c_o_n_n_e-ct-- O Short circuit
B Won't open/startfconnect P Out of adjustment C Spurious closejstopjdisconnect R base program fault
D Spurious openfstartfconnect S Application program fault E Signal (measuring value) falls T database fault
F Spurious signal U Corrosion, erosion, wear G faulty measuring value (signal) W Operating error
H faulty regulation (governing) X U nidentified fault K Other functional failure Y Control equipment fault L N on-functiona.l obstruction Z Other
NPP operating data Action taken H Replacement of component with new item B Replacement of component with same item C Repair no replacement D Replacement of part of component Z other ( cleaning, lubrication
The TUD database contains information on the operating history of the NPPs. This operating history is given by the time instances at which the operating conditions are changed. The identified operating conditions are:
12 Investigation of the data collected at the TUD da.ta.base
- cold shut down;
- hot shutdown/hot standby; - startfstop process;
- power operation.
Tagether with these conditions, the turbine trips and reactor scrams are also given.
2.3
Aspects of the data of importance for the
analys is
In this seetian we discuss those aspects of the data that have in:fluenced the development of the analysis tools. N aturally, there are information needs that cannot be fulfilled with the part of the sockets operating history that lies at the TUD database. This seetian is meant to describe the boundaries that we encountered during this work. Furthermore, the quality of the data will be briefly discussed. A report that cancerns this issue is to be expected soon in the SKI reporting series.
The following boundaries of the information at the TUD database were en-countered during this work:
(i) The TUD database records only the repair actions and not the preventive maintenance actions although these actions have a big infiuence on the re-liability of the component
In the introduction of this chapter, the sequence that results in a failure report for the TUD office is described. It showed that the workorders that are part of the preventive maintenance program, will not be included in the TUD database unless a failure was detected during this preventive maintenance job.
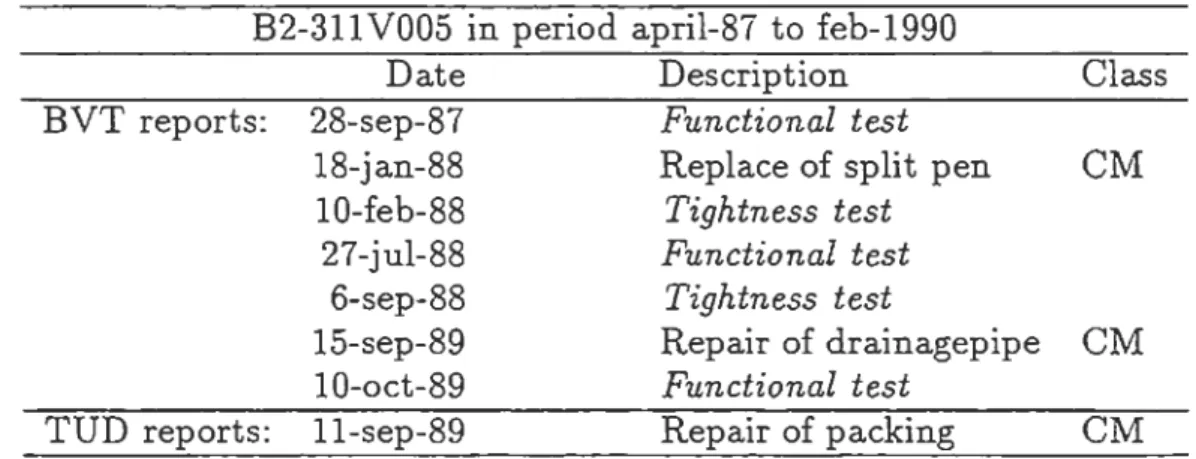
To illustrate the problems we run into when we want to judge the quality of the maintenance service, we give the full maintenance history on B2-311 V005, taken from the local maintenance information system at Barsebäck (BYT) and camparethat with the data at the TUD databaseon this socket.
Aspects of data of importance for analysis 13
Table 2. 7 : Example of local maintenance data and TUD failure reports on a component socket
B2-311V005 in period april-87 to feb-1990
Date Description Class BVT reports: 28-sep-87 Functional test
18-jan-88 Replace of split pen CM 10-feb-88 Tightness test
27-jul-88 Functional test
6-sep-88 Tightness test
15-sep-89 Repair of drainagepipe CM 10-oct-89 Functional test
TUD reports: 11-sep-89 Repair of packing CM
source: Barsebäcks local maintenance databae (BVT) and TUD database
PM = preventive maintenance; CM = corrective maintenance
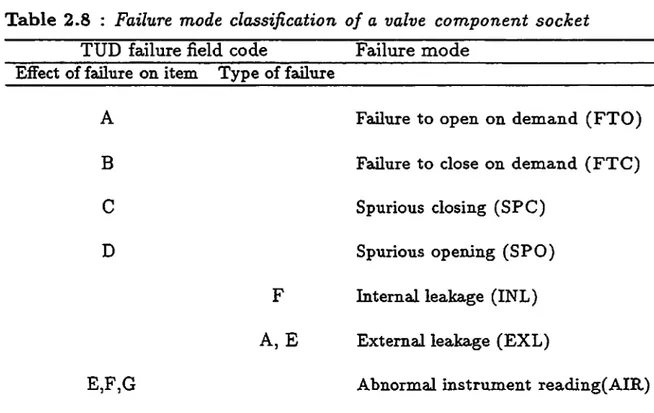
(ii) The failure cause cannot be read from the failure fields
A consequence of the fact that the failure report is filled in before the actual maintenance jo b starts, is that the failure cause is usually not known at that stage. Due to the fact that this field was not always filled in after the repair job was finished, the TUD failure reports no longer contain this field. In [Cooke et al.,1995] the design of a modern reliability database is dis-cussed. Here the failure fields in the failure reports differ slightly from those in the the TUD-database. The failure fields contain the method of detection, the failure mode, the failure cause, the failure mechanism and the functional consequence of the failure respectively. Information on the failure mechanism and failure mode can be read from the failure field codes. The table below shows how to classify the failure mode of a valve socket from the codes.
14 Investigation of tbe data collected at tbe TUD database
Table 2.8 : Failure mode classification of a valve component socket TUD failure field code Failure mode
Effect of failure on item Typ e of failure
A Failure toopen on demand (FTO)
B Failure to close on demand (FTC)
C
Spurious closing (SPC)D Spurious opening (SPO)
F Interna! leakage (INL)
A, E Externa! leakage (EXL)
E,F,G Abnorma! instrument reading(AIR)
(iii) The repair fields do not contain the maintainable parts that are repaired
When we want to process the operating experience data to support the maintenance staff, we would like to be able to distinguish which maintain-able part of the component socket was repaired. In the table below we give an example of how the subcomponents can be further subdivided in maintainable parts.
Table 2.9 : Maintainable parts of a valve
Equipment unit: Val ve
Subcomponents Valve Actuator Control and monitoring
Maintainable parts: Valve body Bonnet Seat rings Packing Seals Diaphragm Spring C ase Piston Stem Other valve Indicator components Seats /g askets
Pilot valve Positioner G ear Other actuator components Control uni t Monitoring Actuating device Power supply
Aspects of da.ta. of importa.nce for a.na.lysis 15
(iv) There are not always suitable codes for describing the failure event andfor
repair action
The failure/repair codes given in table 2.6 are often not suitable for classi-fying the failure even t and/ or repair action. In that case the maintenance engineer, responsible for the failure report, has to take the general code (other failure type, other failure e:ffect or other repair ). With this general code the data analysis with the help of a computer is less powerful. Still, the explanatory text in the failure report explains the failure event and repair action taken, when the user wants to read the reports.
(v) The operating experience data of a component is related to the socket at which it failed and not to the component itself
This is a subtie difference, it can be the case in a system with built in redundancy (for example the 314 system) that different components are entering and leaving the sockets. This can result in the problem that we can spot the weak sockets (positions in the system) but we cannot trace weak components.
(vi) Failures of a socket are only reported to the TUD when the failure results in
a repair action
In the introduction we explained that a failure report is written when a maintenance engineer wants a work permit to repair the failure. A func-tional failure of a socket can, however, be the consequence of a failure of equipment that is not considered to be part of that socket. This failure event is reported as a failure report of the equipment that is repaired. On the other hand, STAGBAS does link the critical failure events to the socket that critically failed. lt is thus only possible to give accurate esti-mates of critical failure rates on the basis of the operating history stored in the TUD database and STAGBAS together.
There are two aspects of the quality of the data that should be considered when we want to draw conclusions from the analysis.
(vii) N o t a 100
%
coverage of the recordingThere does not exist a 100
%
coverage of the failure reports on the actual repairs that occur at the component sockets. An investigation is made at the TUD office concerning this problem and will result in a SKI-report.(viii) No homogeneity of the reporting among different stations
When we see differences in the number of failure events in similar groups of equipment at different stations, this can be due to better maintenance performance or to heterogeneity in reporting among the different stations. Inter-station comparisons or pooling of similar equipment at different sta-tions should therefore be handled carefully.
Chapter 3
Description of TUD users
and
their inform.ation needs
3.1
Introduction
The goal of this work is to develop reliability data analysis tools that can can be installed at the TUD database and support the work of the TUD users; the maintenance staff and the risk/reliability staff bothat the nuclear power station and at the regulatory body, SKI. The (feedback) functioning of these tools is illustrated in figure 1.1. In this chapter the work and objectives of the TUD users are roughly described, resulting in a list of applications of the TUD databse.
The regulatory body, SKI is installed by the Swedish government to secure the safety of the public. SKI supports the Nordie research efforts (NKS) in the area of nuclear safety of which this work is a part. SKI's demand on the equipment at the NPPs isthat of safe/reliable functioning. The utilities demand the equipment to be operational cost-effective. However, cost-effectiveness and reliability / safety are closely connected at a nuclear power station. SKI has the authority to shut down the NPP in the case of risk situations. The large cost of NPP down time provides an economic incentive towards maintaining the reliability at the equipment at the accepted level.
For the purpose of preserving both operational cost-effectiveness and safety at the power stations, the utilities have employed a maintenance sta:ff and a risk/reHability staff at the power station. Broadly speaking, the maintenance staff has to keep the equipment operational cost-effective within the reliability restrictions set by the risk/reliability staff in the safety technical specifications (TS). In addition, the risk/reliability staff searches constantly for scenarios that can e:ffect the safety of the power station and tries to find means to lower their rate of occurrence.
In the following seetians we describe the work and information needs of the TUD users.
Maintenance staff at the nuclear power station 17
3.2
Maintenance staff at the nuclear power
sta-tion
The task of the maintenance staff is to make an overall cost-e:ffective mainte-nance program for the equipment at the NPP that meets the safety /reliability requirements set by the risk/reliability staff in the safety technical specifications. The systems and equipment used in the NPPs are sophisticated, complex, difficult to maintain and expensive. They are expected to operate for long periods of time without serious failure and must have a very long totallife. Typically, the physical environment in nuclear plants is severe and can have serious degraded effects on the equipment. A large portion of the safety systems (which are of main concern for SKI) operate remotely while depending on human operators for control functions. From these considerations we recognise the importance of a good maintenance program when the reliability of the equipment at the plant has to be preserved. A good maintenance program takes care of:
- Cost-e:ffective maintenance scheduling that keeps the equipment su:fficiently re-liable throughout its life cycle;
- Providing the maintenance personnel with the necessary skills, knowledge, re-sources and support to perform their maintenance actions properly.
The different aspects of a good functioning maintenance program are described in the work of [Sanden and Chockie, 1994). The TUD database with the proper tools installed, is able to support especially the first aspect of a good main-tenance program which is on a management level. In building a cost-e:ffective maintenance schedule there are two major classes of maintenance actions that can be distinguished:
1. Preventive maintenance aims to reduce the prohability of failure, and can
be divided into two subclasses:
a. systematic or scheduled maintenance; replacement or revision of parts of components at predetermined moments in time
b. condition based maintenance; the decision toreplace orrevise is made according to the outcome of a diagnostic study under for example test, inspection or continuous monitoring
The implementation of preventive maintenance can result in the detection of potential faults and shifts in performance specifi.cations for correction prior to an actual equipment failure. In addition, periodic preventive main-tenance also increases the familiarity of the technician with the functional and service aspect of the equipment.
2. Corrective maintenance is the repair after failure. The repair activity can
18 Description of TUD users and their information needs
a. Planned repair; repair action can be postporred and suitably planned b. Emergency repair; repair or rectification as soon as possible
Failures of equipment in safety systems are demanded to be repaired within a limited amount of time. This emergency maintenance can-not be planned in advance and in same cases requires a costly NPP shutdown.
($
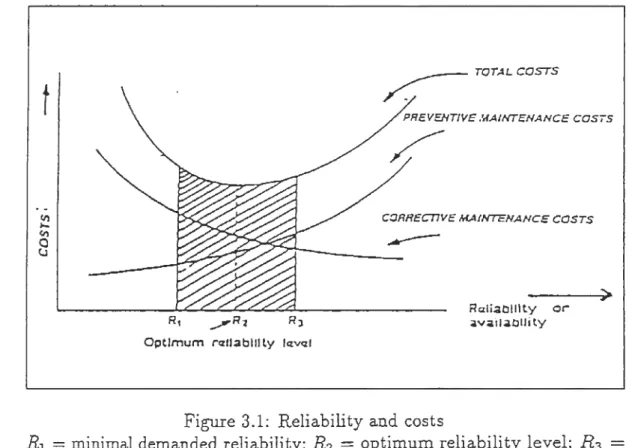
1.000.000 per day)Figure 3.1 illustrates the relationship between preventive maintenance, cor-rective maintenance, equipment reliability and costs.
t
R,
Optimum raUabtllly l~vql
~ TOTAL COSTS
PREVENTIVE .',{A/NTENANCE COSIS
CORREcnVE MAIHTCNANCE COSTS
Raliatllllty or 41V41il4tl1Ji ty
Figure 3.1: Reliability and costs
R1 = minimal demanded reliability; R2 = optimum reliability level; R3
Current reliability level
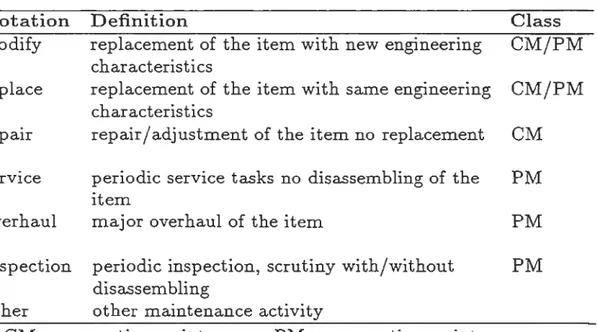
The classification of the different maintenance actions on the equipment at a NPP into corrective and preventive maintenance is shown in table 3.1.
Maintenance staff at the nuclear power station
Table 3.1 : Maintenance actions
Notation mo di fy replace repair service overhaul inspection other Definition
replacement of the item with new engineering characteristics
replacement of the item with same engineering characteristics
repair/adjustment of the item no replacement periodic service tasks no disassembling of the item
major overhaul of the item
periodic inspection, scrutiny with/without disassembling
other maintenance activity
C lass CM/PM CM/PM CM PM PM PM
CM = corrective maintenance; PM = preventive maintenance
19
Apart from replacement and modification, all the maintenance actions as stated in the above table are necessarily performed on maintainable parts of equipment at the NPP. The maintainable parts of a valve are given in table 2.7. As mentioned previously , the maintenance program on equipment situated in the safety systems at the NPP are strongly guided by their TS. The TS request
periodic tests and direct maintenance follow ups in case of failure on demand.
Since a portion of the safety systems operate within the containment, the main-tenance is usually done at specific time intervals, when the NPP is down for refueling.
The 314 pressure relief system (described in appendix B) is a standby system situated in the reactor containment. Due to the fact that the radiation and steam pressure are too high during the operating period of the NPP, tests and maintenance can only be performed when the plant is shut down. Thus resulting in the following test schedule:
- One test while shutting down the plant to annual overhaul - One test while starting up from the annual overhaul
Emergency maintenance of the pressure relief system leads to an expensive shut down of the plant. In figure 3.2 an idea is given of the types of maintenance actions taken on such a main valve socket throughout the operating years.
From the investigation of the information at the TUD database such as de-scribed in the previous chapter, we learned that the TUD data b ase does not register all the maintenance actions on the equipment at the NPP. This limita-tion makes it difficult to judge the maintenance program as a whole. However, the maintenance staff is responsible for the local maintenance information system at the nuclear station. Hence, they have both the TUD database and the local maintenance information systems at their disposal to identify:
20 Description of TUD users and their information needs
repair repair of repair repair
revision seatidisc st e m indicator pipe crack
l
Tl T
l
T!T INL T T FTOT AIR TEXLT
l )(l
0 ~l®_l
0l_
st.a.rt down down down down down stop
o bserva.tion observ&tion
0 = failure detection time ; x
=
maintenance action; T=
testFigure 3.2: Example of the operating history of a main relief valve (314V001-V020)
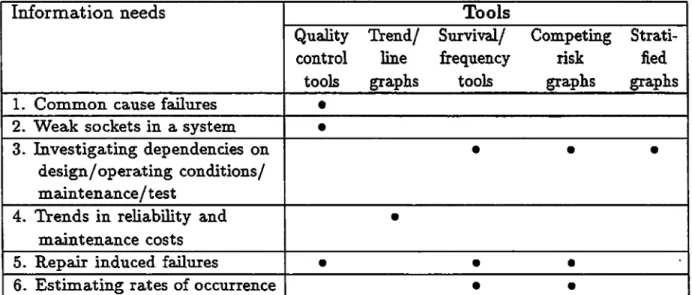
(i) Common cause failures;
(ii) Weak sockets in a system (outliers);
(iii) Whether and how
- test
f
maintenance programs - operating conditions- design
influence the reliability of the sockets; (iv) Trends in
- reliability of the sockets during the operating years of the NPP - costs of maintenance during the operating years of the NPP (v) Repair induced failures.
3.3
Risk/reHability staff at the nuclear
power
station and at SKI
The objective of the risk/reliability staff at the power station is to keep the risk of release of radioactive materials under the accepted level. Furthermore, the regulatory body in Sweden, SKI has a risk/reliability staff as weil which supports the SKI inspectors appointed to the different NPPs in Sweden. The main task of the SKI inspector is to investigate whether the safety at the NPPs they are appointed to, is at an acceptable level. The main source of information the SKI risk/reliability staff and inspectors at SKI work with are the LERs assembled at SKI and stored in STAGBAS. The LERs contain descriptions of safety critical events at the NPPs in Sweden.
When the risk/reliability staff at the station and at SKI is confronted with a safety critical event, a further investigation has to be made into its root causes.
Riskjreliability staff at the nuclear power station 21
The information at the TUD dat ab ase can then be of help for the inspector to pre-p are the right questions for the maintenance staff respre-ponsible for the equipre-pment that critically failed.
The staff and inspectors at SKI broadly want to identify similar issues from the operating experience data as the risk/reliability staff at the power station. There is though an extra aspect to the work of the staff at SKI: The staff at the SKI office are both on-line connected to the TUD database AND STAGBAS. A combination of these two operating experience databases can give extra insights and should be considered in this work.
The maintenance and test programs for safety critical sockets are strictly guided by the safety technical speci:fications (TS). The revision of these technical speci:fications is part of the work done by the risk/reliability staff. One method used is probabilistic risk analysis (PRA). The Nordie research project NKA-RAS-450 (1987-1990) concerned this topic; optimizing of technical specifications by use probabilistic methods see [Laakso et al.,l990]. The following stages can be pointed out in a PRA:
- Initial information collection
Piping, electrical and instrumentation drawings are collected, as weil as test, maintenance, operating and administration procedures. Discussions with design engineers and plant personnel contribute as well. Both generic and (if available) plant specific occurrence rates of undesired events, in-cluding "initial events", component failures and human errors, must also be collected.
The Swedish T-book [T-book, 1995] which is based on the failure reports and LERs of critical failure events, gives generic and NPP specific estimates of the rate of occurrence of undesired component failures for the 14 NPPs in Sweden and Finland.
- Event tree development and system modeting
In this phase the possible accident sequences (branches of the event tree) are identified. System modeling involves the study of safety systems which must fail in order for accident sequences to be realized. A useful classification of failures is in failure modes, effects and mechanisms. This classification allows the risk/reliability analyst to determine the way in which components and subcomponents interact with each other.
- Analysis of human reliability and procedures
The testing, maintenance and operating procedures are reviewed to identify the potential human errors to be included in the system analysis.
- Data-base development
Identifying data sources, compiling data, selecting appropriate mathemati-cal reliability models and estimate their parameters, and a.ssessing the fre-quencies of initiating events are activities in this phase.
22 Description of TUD users and tbeir information needs
- Accident sequence quantification
Computer codes are initialized, run and the results interpreted.
*
Externa! event analysis*
Uncertainty analysis*
Development and interpretation of resultsThe risk/reliability staff at the nuclear power station should work close
to-gether with the maintenance staff. This means that the information needs of the
maintenancestaff statedin the previous section, should interest the risk/reliability
staff as weil. In addition to these information needs, the safety /reliability staff wants to identify:
(i) Estimates of rates of occurrence of undesired events;
Chapter 4
Tools developed for the TUD
users
4.1
Introduction
In the previous chapter we have investigated the information needs of the users of the TUD database which resulted in a list of applications of the TUD database. In this chapter we describe the tools that are developed in this work. The statistical
rnethods which support mostofthese tools, are described in appendix A.
The analysis tools developed in this work are the result of going through the following analysis steps
step l . Investigate and select the data;
step 2. Make simple plots of the data;
step 3. Analyse the data with statistical methods, including analysis of trend and dependency;
step 4. Combine and implement these three steps in a prototype RDB.
The "environment" in which the tools are to function is the TUD database. The TUD database is a relational database system in ORACLE which runs under a UNIX operating system. In this work we have developed a prototype RDB in Microsoft Access based on the failure reports and engineering reports of the benchrnark systems.
This prototype RD B ena b les us to design the analys is tools according to the possibilities of a relational database. Second, it facilitated the analysis of the benchrnarksystems which was one of the goals of the work and will be presented in the next chapter. The main user-interface of the prototype RDB is shown in
figure 4.1.
The analysis steps the TUD user has to go through in this prototype RDB are:
4a. Build a population of sockets (subcomponent or component level);
24 Tools developed for the TUD-users
l
LBuild a population of componeut sockcts.
'l
3.Choosc the tool:s l it;j
rn
Trand/lina groplu;:Re10dor 1ype: jBoiling- ra:KD' Slalion:
l
il3t sel! a<: t @] Unit:~ Mean accvmulated number ollailuras
Salety system group: IF-T l!J System: jPresU~re relief syrtt .. !il
.
tK;Mean nurnbar allailuro avenio par ya ar Fundian:tJalva [_tjs>fllly I:!JsarYa ,..,..allod
W
Position:~ ta e!I!] Sul\lival/lnoquancy anatysio:~ Sul\lival plot
cubcomponant: ~aiYI l :!J
~ Tima averaga hazard rata plot Canlral charts:
~ Outliarc cantro l ch att
L
2.Sclcct the failurc evealsJ
liil Parela diagram-s
--
-
--
,
[J Time since stan ar power.unil1.. 4.Stratify the dat~---·---J
'caleadar time !
ll-t-80 l ond lt-1-94 l
[L)
wlli!J
mo111hs~ s lotion !E plant Ii ma~~ulaC1urer
·---E FDilure eHed c Failure mode a Compeling lailure made
! i
l l
l'
5.Edit tbc report -·-·---1l §ICiiCII1äi
w
l"*"nalleatage @ jF:ailuta ta cpen on - . v i §]~ä'5CI
l
·-l
Figure 4.1: Analysis user-interface for a reliability database 4b. Select the failure events;
4c. Select the analysis tools to be incorporated in the report; 4d. Adjust the default report and print the report.
In this chapter we explain the possibilities for the user in each of these four steps of data analysis. We start with exploiting the possibilities of the TUD database for pooling equipment and selecting data on different types of failure events which are step l and 2 of the user-interface.
Once the data is selected on the pool (population) of sockets, there is a first need for simple charts that give the complete picture of the selected failure events.
In these charts a distinction is still made between the sockets. This enables the user to judge whether there are outliers in the group of equipment which should be treated seperately.
When no distinction is made between the individual sockets in the population, several graphical presentation tools are developed that can compress the data in one understandable graph. The ad vantages of using graphs (plots) are that it makes information easier to remember, helps the user pick out trends and patterns and can reveal hidden facts and relationships not previously recognised. However, when the data is sparse, the user has to be careful not to jump to conclusions based only on the graphs. This can be avoided by supporting the graphs with statistical confidence bounds and significance levels. The statistical methods that underlie this support are discussed in appendix A.
l
Pooling of equipment and selection of failure events 25
Next, stratification of the selected pool of equipment in different strata (sub-groups) is an effective method to isolate the cause of a problem and compare the performance of different plants, manufacturers etc. When the graphs show differences between the strata, the so called homogeneity of the entire population can be questioned. The stratified data will be accompanied with a significance level for homogeneity in the population.
4.2
Pooling of equipment and selection of
fail-ure events
In this section we will first give the motivation for building a population of sockets for analysis. Next, we discuss the general features of the operating experience data at the TUD database for a pool of sockets and give the different approaches towards the selection of failure events the users can have.
Pooling equipment
When the user wants to in vestiga te a single so eket, the data is often too sparse to apply statistical methods. However, it has to be emphasized that this is still the preferable situation; to treat the data from each socket separately when possible.
In most of the safety systems of a NPP, there exists built in redundancy which means that multiple copies of the same component socket are available in that system (see appendix B). Moreover, the same safety systems exist in different NPP's which provides the possibility of large pool of similar sockets. Hence, there exist possibilities for the user to pool different sockets andregard themas a population of similar sockets. N aturally, this provides the analysis tools with more failure/repair events so that stronger statistical results can be obtained. Y et, by regarding thesocketsas similar, the assumption of homogeneity is made. There exists statistical tests for homogeneity within a population of sockets, which are described in the appendix A. In section 4.4 we give stratification methods for a population of sockets which together with the statistical tests, enable the user to check the plausibility of homogeneity within the population.
N o te t hat the user can have other intentions for pooling equipment t han only making inference on one socket type. It is weil possible that the user wants to investigate equipment situated in a certain part of the plant or the behavior of a system as a whole, the resulting pool of sockets is then not regarded homogeneous.
Component socket operating mode and time related versus demand related failures
There are three classes of operating modes for a component socket: l. continuous operation
26 Tools developed for the TUD-users
2. standby 3. intermittent
Components operating in the standby mode are normally passive, hut can be intermittently called upon to perform some function.
In
the intermittent mode a component is sometimes in continuous operation and sometimes in standby. This can arise when two or more components are available to perform a single function and are placed in service intermittently.The failure cause gives reasons why a {sub)component fails. These reasons maylie outside the (sub)component itself, as when a (sub)component fails due to over-stress eaused by other failures upstream. Failure eauses are grouped into two broad categories, time-relat ed failures and demand related failures. Most com-monly, a failure occurring when the component is called ito service from standby mode is classified as demand related. Failures occurring while te component is in continuous operation are classified as time-related.
The operating mode of the component socket should be taken into account when analysing the failure data. For example; when analysing the failure data of a pool of similar sockets, it is weil possible that one socket has the operating mode continuous operation while the other sockets are redundant and are in standby. Naturally the socket in continuous operation is much more subject to time related failures associated with the failure mechanism wear.
Moreover it should be noticed that a component socket that has the operating mode continuous operation, does not operate steady and continuously throughout the whole calendar year. For each NPP there exists periods of cold shutdown, hotshutdown and start/stop processes and differences in power operation. This means that there exist time related failures, notably those related to failure mech-anism wear, for which calendar time might not be the most useful metric. For this reason the user can choose between NPP operating time and calendar time for the analysis of the data.
A component socketthat is in standby operating mode is subject to demand related failures. When we assume that this component socket does not degrade during standby, the statistkal analysis of the failure data is quite simple. The metric we use for the analysis isthen preferably number of demands.
Service sojourns, time to failure and time between failure
From the description of the contents of a failure report, we know that for each socket there exists information on three different events occurring in time: the failure detection date, the start of repair date and the replenished at socket date respectively.
From the events start of repair even t and replenished at so eket, we get the so called socket service sojourns. A service sojourn begins when a new or repaired subcomponent goes online, and terminates when a subcomponent is removed for any reason whatever.