Surface Films and Corrosion of Copper
ISSN 1104-1374 ISRN SKI-R--99/27--SEJouko Hilden
Timo Laitinen
Kari Mäkelä
Timo Saario
Martin Bojinov
March 1999
Surface Films and Corrosion of Copper
Jouko Hilden
Timo Laitinen
Kari Mäkelä
Timo Saario
Martin Bojinov
VTT Manufacturing Technology, Materials and Structural Integrity,
P.O. Box 1704, FIN-02044 Espoo, Finland
March 1999
This report concerns a study which has been conducted for the Swedish Nuclear Power Inspectorate (SKI). The conclusions and viewpoints presented in the report are those of the authors and do not necessarily coincide with those of the SKI.
CONTENTS
Preface 3
1 Summary / Sammanfattning 4
2 Introduction 6
3 Literature survey on corrosion of copper in sulphide solutions 8
3.1. Introduction 8
3.2. Thermodynamic stability of copper and its oxidation products 9 3.2.1 Potential-pH diagrams for bulk oxidation products
in the presence of sulphide ions 10
3.2.2 Potential-pH diagrams of bidimensional layers of
adsorbed elements on metal surfaces 11 3.3. Composition of corrosion layer on copper in the presence
of sulphide ions 12
3.4. Voltammetric studies 12
3.5. Sulphur-assisted corrosion mechanisms 15 3.6. Electrical properties of surface films on copper in the presence
of sulphide ions 16
4 Summary of results in nearly neutral tetraborate solution 17
4.1. Introduction 17
4.2. Experimental 17
4.3. Results and discussion 18
4.3.1 Voltammetric measurements 18
4.3.2 Resistance-potential curves 20 4.3.3 Impedance response of the films on copper 22
4.4. Conclusions 30
5 Summary of results in borax solution with chlorides 31
5.1 Introduction 31
5.2 Experimental 31
5.3 Results and discussion 31
5.3.1 Resistance-potential curves 31 5.3.2 Addition of chlorides on steady state films formed in
chloride-free solutions 32
5.3.3 Impedance response of films on copper 33
5.4. Conclusions 36
6 Results in borax solution with 10 ppm H2S 37
6.1. Experimental 37
6.2. Results and discussion 37
6.2.1 Voltammetric measurements 37
6.2.2 Resistance - potential curves 41 6.2.3 Resistance - time and potential - time curves 41 6.2.4 Impedance response of the films on copper in presence
of sulphides 46
6.3. Conclusions 49
7 General conclusions and implications for localised corrosion 50
PREFACE
This report summarises results from several projects carried out as part of a research program funded by Swedish Nuclear Power Inspectorate (SKI) and Radiation and Nuclear Safety Authority, Finland (STUK). Co-operation with Christina Lilja, SKI, and Juhani Hinttala, STUK, is gratefully acknowledged. The reports published earlier are STUK-YTO-TR 105 (1996), “Environmentally assisted cracking behaviour of copper in simulated ground water, STUK-YTO-TR 106 (1996), “Electrical properties of oxide films formed on copper in 0.1 M borax solution”, STUK-YTO-TR 134 (1997), “The effect of chlorides on the electric properties of oxide films on copper” and SKI Report 96:80 (1996), “The effect of nitrite ion on the electric properties of oxide films on copper”.
Espoo, March 10, 1999 Authors
1 SUMMARY
In Sweden and Finland the spent nuclear fuel is planned to be encapsulated in cast iron canisters that have an outer shield made of copper. The copper shield is responsible for the corrosion protection of the canister construction.
General corrosion of the copper is not expected to be the limiting factor in the waste repository environment when estimating the life-time of the canister construction. However, different forms of localised corrosion, i.e. pitting, stress corrosion cracking (SCC), or environmentally assisted creep fracture may cause premature failure of the copper shield. Of the probable constituents in the groundwater, nitrites, chlorides, sulphides and carbonates have been suggested to promote localised corrosion of copper. The main assumption made in planning this research program is that the surface films forming on copper in the repository environment largely determine the susceptibility of copper to the different forms of localised corrosion. The availability of reactants, which also may become corrosion rate limiting, is investigated in several other research programs. This research program consists of a set of successive projects targeted at characterising the properties of surface films on copper in repository environment containing different detrimental anions. A further aim was to assess the significance of the anion-induced changes in the stability of the oxide films with regard to localised corrosion of copper. This report summarises the results from a series of investigations on properties of surface films forming on copper in water of pH = 8.9 at temperature of T = 80 oC and pressure of p = 2 MPa.
The main results gained so far in this research program are as follows:
• The surface films forming on copper in the thermodynamic stability region of monovalent copper at 80 oC consist of a bulk part (about 1 µm thick) which is a good ionic and electronic conductor, and an outer , interfacial layer (0.001…0.005 µm thick) which shows p-type semiconductor properties
• The thin outer layer controls the corrosion properties of copper, corrosion rate being limited by ionic transport through the layer and the charge transfer step of the film dissolution
• Chlorides cause a breakdown of the oxide film in the stability region of divalent copper, but they seem to have no effect on the properties of the film in the stability region of monovalent copper; oxidising conditions with simultaneous exposure to chlorides are thus expected to subject copper to localised corrosion
• Sulphides at the concentration of 10 ppm dissolved H2S were found not to promote the formation of a three-dimensional film of Cu2S (or other copper sulphides), thus the mechanisms of localised corrosion which operate under reducing conditions and are based on the formation of copper sulphides seem not to be valid. In the presence of 10 ppm H2S the corrosion rate of copper is controlled by the charge transfer step of the dissolution of the outer layer.
SAMMANFATTNING
Både i Finland och Sverige har slutförvaringen av använt kärnbränsle tänkt ske genom inkapsling i gjutjärnsbehållare med ett kopparhölje, där kopparhöljet fungerar som kapselns korrosionsbarriär.
Korrosion av kopparhöljet anses inte vara den faktor som begränsar livslängden för kapseln under slutförvarsförhållandena. Olika former av lokala skademekanismer som t.ex. gropfrätning, spänningskorrosion, spänningskorrosion-sprickbildning samt accele-rerad krypning till följd av omgivningens påverkan kan skada kopparhöljet betydligt fortare än väntat. Vissa element i grundvattnet som t.ex. klorider, sulfider och karbonat har visat på tendenser att främja lokal korrosion av koppar.
Vid planeringen av detta projekt har huvudantagandet gjorts att ytfilmsbildningen på kopparytan bestämmer materialets känslighet för lokala korrosionsattacker under omgivningens påverkan. Projektet ingår i ett forskningsprogram som består av flera på varandra följande projekt som inriktar sig på att påvisa ytfilmens betydelse vid korrosion av kapselns kopparhöje under slutförvarsförhållanden och med förutbestämda kon-centrationer av anjoner. Förekomsten och koncentrationen av olika reaktiva element som påverkar korrosionshastigheten undersöks i flera andra forskningsprogram. Denna rapport är ett sammandrag av resultat från en serie ytfilmsmätningar av koppar i vatten vid en temperatur av 80°C (pH 8.9) och ett tryck på 2 MPa.
Huvudresultat hittills i forskningsprogrammet:
• Ytfilmen som bildas på kopparytan vid 80°C består av en 1µm tjock ytfilm som leder både joner och elektroner samt ett semikonduktivt gränsskikt av tjockleken 0.001 -0.005 µm.
• Det tunna gränsskiktet bestämmer huvudsakligen kopparns korrosionskänslighet, eftersom korrosionshastigheten bestäms av jontransporten genom gränsskiktet och laddningsöverföringssteget vid upplösningen av gränsskiktet.
• Klorider orsakar nedbrytning av CuO-baserade ytfilmer som förekommer under oxiderande förhållanden men påverkar inte Cu2O-filmen; oxiderande förhållanden med klorider närvarande förväntas därför förorsaka lokal korrosion av koppar.
• Sulfider i en koncentration av 10 ppm (H2S) visade på bildningen av Cu2S (eller andra sulfider). Lokal korrosion vid reducerande förhållanden baserad på bildning av kopparsulfider verkar dock inte troligt.
2 INTRODUCTION
In Sweden and Finland the spent nuclear fuel is planned to be encapsulated in cast iron canisters that have an outer shield made of copper. The effect of the repository environment on the life time of the canister and its materials needs to be known when the barrier properties of the canister are estimated.
The copper shield is responsible for the corrosion protection of the current canister construction. General corrosion of the canister shield is currently estimated not to be the life-limiting factor in the waste repository environment. However, different forms of localised corrosion, i.e. pitting corrosion, environmentally enhanced creep fracture and stress corrosion cracking (SCC) phenomena, may potentially limit the protective properties of the copper canister.
The repository environment is oxidising for some time after closing up, but is considered to become reducing when oxygen is consumed, and to stay reducing unless replenishment of oxygen occurs e.g. during an ice age. However, the oxides that form on copper during the manufacture are typical for an oxidising environment, and reduction of these oxides can be very slow. Therefore, information on the susceptibility of copper to localised corrosion after exposure to both oxidising and reducing environments is needed.
This project is a part of a larger long term research program called “Correlation of Oxide Film Properties and Susceptibility to Localised Corrosion in Repository Environment”. The program was launched in order to develop a mechanistic understanding as well as a sufficient database for assessing the possibility of stress corrosion cracking and the extent of pitting of copper under the expected disposal vault conditions. The main assumption made in planning this research program is that the surface films forming on copper in the repository environment largely determine the susceptibility of copper to the different forms of localised corrosion. A proper characterisation of surface films forming on copper in repository environment is not available, and thus a considerable part of this research program is devoted to such a characterisation. New surface sensitive techniques have become available, which pinpoints the need for a more detailed investigation of the role of the surface films. As this type of approach is rather new, experimental work needs to be performed not only in simulated ground water but also in solutions with more accurately controlled properties. Borate solutions are used in order to establish a constant pH.
Each project of the program consists of characterisation of the electrochemical and electrical properties of the surface films on copper in a given environment. The projects are shown in Table I. The surface film characterisation work is supported by separate projects in which modelling of pitting and stress corrosion cracking of copper is being performed.
In general, the corrosion rate of any metal increases exponentially with temperature. This assumes that there is a fast supply of oxidant and no accumulation of inhibiting corrosion products such as a persisting layer. In the repository conditions at the depth of 500 metres the hydrostatic pressure alone can be 5 MPa. Mor et al. studied effects of temperature on the corrosion in sea water at different hydrostatic pressures and
concluded that copper corrosion rate is always increased by a pressure rise and that the increased corrosion rate is further accelerated by increasing temperature [1]. The increase in hydrostatic pressure can accelerate cathodic or anodic processes depending on the conditions. In order to guarantee relevant experimental conditions, the tests of all the projects were carried out under elevated pressure in an autoclave.
Table I. List of projects. TBS = tetraborate solution (0.1 M Na2B4O7, T = 80 o
C, p = 2 MPa), RGW = Reference Ground Water.
Environment Redox-conditions Year of completion
TBS Reducing 1996 TBS + NaNO2 Oxidising 1996 TBS + Cl- Reducing 1997 TBS + S2- Reducing 1998 TBS + CO32- Reducing 1999 RGW + anions Reducing 1999
This report gives an overview on the main results from tests performed in pure tetraborate solution and in tetraborate solution with chlorides. The results from tests performed in tetraborate solution with nitrites showed that nitrites do not have a noticeable effect on the surface film properties. Thus these tests are not reviewed in this report.
In addition to the overview of earlier results, a detailed description of test results on the effect of sulphide ions in the form of 10 ppm dissolved H2S is reported. The purpose of the new experimental work described in this report was to characterise the electrical and electrochemical properties of surface films forming on copper in tetraborate solution with 10 ppm of S2- covering the fourth environment shown in Table I.
3 LITERATURE SURVEY ON CORROSION OF COPPER IN SULPHIDE SOLUTIONS
3.1 Introduction
Many literature reviews on the corrosion of copper have been presented [2-5]. However, little information can be found about the behaviour of copper in sulphide solutions. Sequeira [6] presents some potential-pH diagrams for the Cu-S-H2O system, but does not give any references to experimental corrosion studies of copper in solutions containing sulphide ions. Some natural analogue studies have been made to model the corrosion of copper in repository conditions containing sulphide species [7,8].
It has been proposed that corrosion of copper is controlled by the availability of dissolved sulphide ions in the groundwater passing onto the surface of the canister i.e. the diffusivity of sulphide in the bentonite clay, inside of which the canister is placed [9,10]. If this is the only source of sulphide, then the life time of the canister would be over 106 years even if rather conservative pitting factors are assumed [11]. However, according to the present knowledge the role of sulphate ions as a source of additional sulphide can not be excluded. It has been shown that the kinetic inhibition of the direct oxidation of copper by sulphate is so strong that no examples of this kind of inorganic reduction at repository relevant temperatures are known [12]. But sulphate ions may act as a source for sulphide ions if they are reduced by micro-organisms, as described below. The role of sulphate as a source for sulphide has been debated ever since the existence of the sulphate reducing bacteria (SRB) under hostile repository conditions was suggested in the beginning of 1980’s. These micro-organisms can reduce sulphate to sulphide according to the following schematic reaction:
SO42- + 4H2 → S2- + 4H2O (1)
In reports published in the of 1980’s and early 1990’s it was assumed that bacterially assisted sulphate reduction is possible, but it was suggested to be limited by the availability of organic matter in the repository and the groundwater [9,13]. This seems to include the assumption that the only possible micro-organisms able to reduce sulphate would be heterotrophs, i.e. micro-organisms which use organic matter as a carbon source. In later reports the existence of autotrophs, i.e. micro-organisms which can use dissolved CO2 has also been discussed [14]. AECL Research studied the effects of sulphide produced by SRB, but with the assumption that the biofilm is not present on the canister surface [15], because of the radiation and heat effects were supposed to restrict the populations close to the containers. Sulphide ion concentrations as high as 10-2 M have been shown to be possible by SRB within biofilms [16], but reliable estimates for the concentrations outside the biofilm are difficult to give.
If it is true that significant amounts of sulphate can be reduced to sulphide by SRB, then also kinetic and pitting aspects of sulphide-assisted corrosion of copper become more important. As an example, in their scooping calculations Worgan et al. modelled also a situation where sulphate is reduced to sulphide by sulphate reducing bacteria (SRB) and
a pitting factor of 5 was adopted. Time to failure by pitting corrosion in their case was estimated to be about 10000 years [11].
This shows that the possible risks for sulphide-induced localised corrosion of copper should not be neglected. To address this question and to plan the experimental part of this work, a short literature survey on different aspects of the influence of sulphide ions on the behaviour of copper was made. This survey comprises a description of the thermodynamic stability of the oxidation products and of the composition of the surface films on copper in the presence of sulphide ions, results on the effect of sulphide ions on the voltammetric behaviour of copper and comments on the influence of sulphide ions on the corrosion (especially pitting corrosion) of copper.
3.2. Thermodynamic stability of copper and its oxidation products
Copper is considered a semi-noble metal having an intermediate thermodynamic stability. It is normally stable in non-aerated acid or neutral media, but can corrode in the presence of oxygen. Contrary to these assumptions, Hultquist measured copper to be oxidised by water with hydrogen evolution [17], but later studies by other researchers seem to show that his results were erroneous due to inadequately controlled experimental conditions
[18,19].
The presence of sulphide ions makes possible the formation of copper sulphides in the surface film on copper. The equilibrium potentials (given vs. NHE) at 25°C for the electrochemical formation of Cu2S and CuS are
2 Cu(s) + S2-(aq) ↔ Cu2S(s) + 2e
-E1/V = -0.890 + 0.0295 p[ S 2-]
(2) Cu(s) + S2-(aq) ↔ CuS(s) + 2e- E2/V = -0.698 + 0.0295 p[ S2-] (3) For the latter potential the temperature dependence is ∂E2 / ∂T = -1.040 mV/°C.
The following pH dependent ionic equilibria determine the predominant sulphide species
H2S ↔ HS- + H+ pK4 = 7.04 (4)
HS- ↔ S2- + H+ pK4 = 11.96 (5)
Although copper is not oxidised in water with low oxygen content in the absence of sulphide ions, the values of the equilibrium potentials given above show that copper may be oxidised even in the absence of oxygen when HS- is present. As a result, copper and copper alloys are normally not selected for environments known to contain high concentrations of sulphur or sulphides.
The thermodynamic stability of metals can be illustrated by means of potential-pH (Pourbaix) diagrams. These have been also widely used to predict corrosion of copper. The potential-pH diagram indicates the conditions for immunity, passivation and corrosion. It does not, however, give any information about the rate of the possible corrosion reactions, or the effectiveness of passivation.
3.2.1. Potential-pH diagrams for bulk oxidation products in the presence of sulphide ions
Potential-pH diagrams for the system Cu-S-H2O are available from several sources [6, 20, 21]. Some potential-pH diagrams have been calculated specially when studying the repository of nuclear waste [22, 23]. In these diagrams non-stoichiometric sulphide minerals djurleite Cu1.934S and anilite Cu1.75S are also taken into account, not only chalcocite (cuprous sulphide) Cu2S and covellite (cupric sulphide) CuS. In the latter of these studies a literature review of earlier thermodynamic calculations is presented. Other collections of references to thermodynamic studies has been supplied by Sequeira [6]. Figures 1a, 1b, 2a and 2b show some potential-pH diagrams from the literature. In Figures 1a and 1b the stability fields of different copper sulphides are shown while in Figures 2a and 2b the formation of different copper oxides has been taken into account.
(a) (b)
Figure 1. Stability fields of metallic copper and different copper sulphides at
temperatures 25°C and 100°C, activity of dissolved sulphur [S] = 10-4
(either as HS- or SO
42-). Dotted lines indicate the pE-range at which water
can act as oxidant, upper limit [H2] = 10-9 corresponds to the estimated
lowest concentration of H2(aq), lower limit corresponds to the H2(aq)
activity of 1 [23]. The variable pE is defined as pE nF
RTE =
2 303. , where E is
(a) (b)
Figure 2. (a) Potential-pH diagram for part of the Cu-O-H system: assumed activity
for dissolved Cu=10-6; potentials relative to NHE; (b) Potential-pH diagram
for part of the Cu-S-O-H system: assumed activity for dissolved Cu=10-6;
potentials relative to NHE.
The diagrams demonstrate the possibility of the formation of copper sulphides at potentials well below the equilibrium potential for the Cu(I)/Cu couple in the absence of sulphide ions.
Experimental checks of the potential-pH diagrams of copper-sulphur-water systems have not been published since the very early study of Horvath [24].
3.2.2. Potential-pH diagrams of bidimensional layers of adsorbed elements on metal surfaces
The potential-pH diagrams discussed in the preceding chapter have been constructed by using thermodynamic values of bulk substances. However, when an aggressive anion, such as sulphide is adsorbed on the metal surface, surface energies should also be taken into account. Due to high surface energies, adsorbed layers may be formed in potential -pH domains where a classical diagram does not predict such phases. This phenomenon must not be neglected, because an adsorbed monolayer or even part of such layer can induce marked changes in the reactivity of the metal.
Marcus has extended the principle of potential-pH diagrams to the case of bi-dimensional layers of adsorbed elements on metal surfaces [25]. He and his co-workers have calculated potential-pH diagrams for sulphur adsorption on surfaces of iron, nickel and chromium [26]. Their calculations show that adsorbed sulphur layers can be present under conditions in which bulk sulphide is not stable. The source of the sulphur can be sulphur inclusions of the metal or dissolved sulphur species (S, H2S, HS
-, S2O3
2-, HSO4
-and SO42-) from water. In their calculation Marcus et al. noticed that detrimental effects of sulphur extend to the range where sulphides are not thermodynamically stable.
3.3. Composition of corrosion layer on copper in the presence of
sulphide ions
The composition of the sulphide layer formed may have a great influence on the corrosion resistance of copper. For example djurlite, unlike other sulphides, has been reported to provide corrosion protection [15]. The composition of the copper sulphide layer has been determined in several investigations, but the results seem not to be applicable to the disposal vault conditions, because the composition of the layer has a strong dependence on its history [27-32].
For example, de Chialvo et al. [27] suggest that the copper sulphide in an alkaline solution changes its structure as follows, when the potential is increased in the positive direction:
Cu → Cu / Cu1.8S → Cu / Cu1.8S / Cu2S → Cu / Cu1.8S / Cu2S / CuS (6) They proposed the following reactions for the initiation of the growth of the sulphide layer:
2 Cu(s) + S2-(aq) ↔ Cu(HS)ad + 2e
-(7) or
2 Cu + S2- ↔ Cu2S + 2e- (8)
Khairy et al. concluded that the film which is formed consists of a Cu/Cu2-δS layer which is over-layered with CuS [28, 29]. Scharifker et al. [31] concluded that the film formed on copper surface in their voltammetric experiments has the stoichiometry of Cu2S with chalcocite structure.
3.4. Voltammetric studies
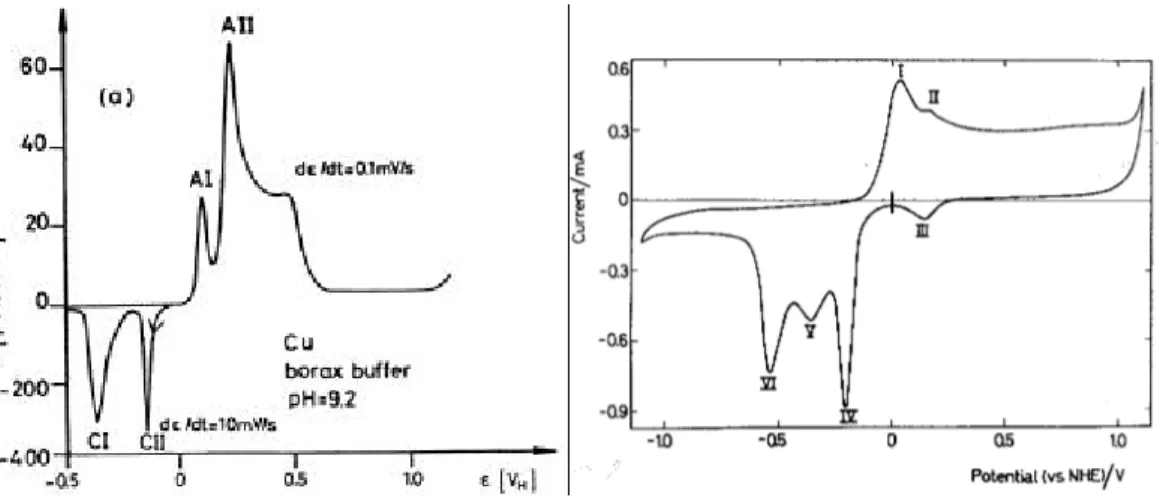
Voltammetric measurements are a tool to obtain an overview of the electrochemical behaviour of a material at different potentials and to obtain preliminary kinetic information. Unfortunately, all the studies found in the literature concerning copper-sulphide systems at moderately alkaline solutions have been performed using carbonate-based buffer solutions [27, 31]. These results cannot be directly applied to nuclear waste repository conditions, because the literature data indicates that voltammetric behaviour of copper may be greatly influenced by the composition of the electrolyte solution. This is illustrated in Figures 3a and 3b, in which voltammograms of copper in moderately alkaline solutions of different composition are presented. Differences between the voltammograms are considerable, although the pH values of the solutions are quite close to each other.
In the voltammogram of copper in a borate buffer solution (Fig. 3a), peaks AI and CI have been ascribed to the formation and reduction of the Cu(I) oxide, i.e. Cu2O, respectively [33]. Peaks AII and CII refer to formation of CuO2
reduction of CuO/Cu(OH)2, respectively. On the other hand, the voltammogram in a mixture of carbonate and bicarbonate is more complicated (Fig. 3b). It is possible that the formation of copper carbonate species (malachite CuCO3Cu(OH)2) can take place at such a high concentration of carbonate species at pH 9.8 [5]. It is important to note that the differences may also to a considerable extent be due to the different potential sweep rates.
Figure 3. (a) Copper electrode in borax buffer , pH = 9.2, potential sweep rate 0.1mVs
-1 [33]; (b) Copper in 0.1 M NaHCO
3 + 0.1 M Na2CO3 pH 9.80, potential
sweep rate 200mVs-1. Apparent copper electrode area 0.322cm2 [27].
Because of the different experimental environment from that in the nuclear waste repository conditions, the discussion below has to be considered with some caution. However, the results reviewed below deserve to be presented in order to give an idea of the possible influences of sulphide ions on the voltammetric behaviour of copper.
The voltammograms of copper measured by De Chialvo et al. [27] in carbonate-based solutions containing sulphide ions (Fig. 4, compare also with Fig. 3b) demonstrate that the presence of sulphide ions leads to the appearance of additional peaks (VII, IX and X) and changes the structure of current peaks. De Chialvo et al. interpreted peak VII to correspond to the formation of copper sulphide, which is formed at potentials close to the equilibrium potentials of the Cu2S/Cu and CuS/Cu couples. The cathodic peaks observed during the negative-going potential scan suggest that two different copper sulphide may be formed. Their voltammetric results show that formation of the copper sulphide film shifts the threshold potential for the copper oxide formation in the positive direction and increases the cathodic and anodic currents for the film reduction and formation processes.
Figure 4. Voltammograms run with copper electrodes in 0.1 M NaHCO3 + 0.1 M
Na2CO3 + x Na2S at 200mVs-1. a) x = 10-3 M ; b) x = 5*10-3 M ; c) x = 10-2 M.
Apparent copper electrode area 0.322 cm2 [27].
De Chialvo et al. [27] also found out that the dissolution current at pH 9 increases linearly with the concentration of sulphide in the solution in the potential range where a copper sulphide can be formed (-0.7 VNHE < E < -0.2 VNHE). However, the linear dependence they achieved is difficult to apply to very low concentrations (under 0.001M), because the correlation of the linear regression was not sufficient. When a rotating disc electrode was employed, they noticed that at lower rotation rates the dissolution rate was increased, but no current maximum in the potential range (-0.7 VNHE < E < -0.2 VNHE) was observed. At high rotation rates they observed a current maximum at -0.3 VNHE < E < -0.4 VNHE.
De Chialvo et al. did not detect soluble products during the reactions of copper in a carbonate-based solution of pH 9 containing sulphide ions by means of a rotating copper disc-gold ring electrode. This observation is supported by the results of Scharifker et al., who measured the ratio of Qa/Qc (anodic/cathodic charge) in the cyclic voltammogram when potential was swept in the range where copper sulphide is formed [31]. The measured ratio was 1 and independent of pH and of sulphide concentration, which strongly suggests that no soluble products were formed. Another supporting result to the idea that the oxidation and reduction of copper in the presence of sulphide ions are solid
state processes was given by Syrett [32]. He found out that the corrosion rate of copper was not markedly dependent on testing time or hydrodynamic conditions in water with low oxygen content and containing sulphide ions.
It can be concluded that despite the great importance of sulphides in copper corrosion, only few electrochemical and corrosion studies [27-32] have been performed on this matter. Unfortunately, in most of them the sulphide concentration has been much too high to be comparable with repository conditions. Some experimental studies have been published, which were performed in simulated nuclear waste repository conditions [34], but it seems that more experimental studies are needed in relevant conditions. Not only the effect of sulphide ions, but also possible synergetic effects of sulphide with other aggressive ions should be clarified, because the joint actions of different ions are theoretically extremely difficult to model.
3.5 Sulphur-assisted corrosion mechanisms
It has been generally assumed that for copper containers uniform corrosion and possibly pitting will occur during the initial oxidising period. Pitting is the usual form of corrosive attack at surfaces, which have nonprotective films and/or scale deposits or other foreign substances. Growth of a corrosion pit involves a type of anodic reaction, which is an autocatalytic process. In such a process the corrosion within a pit produces conditions which are both stimulating and necessary for the continuing activity of the pit [35]. As reducing conditions are obtained in the disposal vaults, the slow uniform corrosion will be the dominant form of corrosion [36,37,9]. However, studies performed by Vasquez Moll et al. showed that also sulphide induced pitting corrosion of copper may take place in reducing conditions [30]. They found out that the most severe potential for the sulphide influenced pitting corrosion of copper lies just below the threshold potential of copper oxide formation i.e. at -0.1 to -0.2 VSHE. Thierry et al. reported that the production of hydrogen sulphide by sulphate-reducing bacteria might lead to pitting corrosion of copper and copper alloys. In this case corrosion is due to the formation of a thick non-adherent layer of chalcocite (Cu2S) or covellite (CuS1+x) [38]. Some other results show also that if pitting corrosion occurs in reducing conditions the mechanism involves sulphides [23,39]. However, it should be noticed that results from this kind of voltammetric studies should not be taken as the only basis for conclusions. The environmental history of the surface film, especially cyclic redox conditions, has a great influence on the formation of pits [38,40,41].
Even though there is no clear picture of the mechanism which could explain sulphide induced pitting corrosion of copper, some general aspects of sulphur assisted corrosion mechanisms of different metals summarised by Marcus can be used to clarify the possible role of sulphide ions [25]. According to him, sulphur may accelerate active dissolution of metals, because adsorbed sulphur weakens metal-metal bonds and thus lowers the activation energy for dissolution. This effect can be strongly localised. Sulphur can also poison the passivation process by blocking the sites of adsorption of the hydroxyl ions, which are necessary precursors in the formation of the passive state. The critical value of
sulphur coverage on the surface is 0.7-0.8 monolayers of sulphur atoms. Furthermore the adsorbed sulphur inhibits nucleation of the oxide or diminishes the density of nucleation sites and slows down the lateral growth of the oxide film. When a passive film grows on top of the adsorbed sulphur layer the structure and the properties of the passive film are modified. Current density in the passive state can be several times higher for a film formed with sulphur present at the metal-oxide interface. On the other hand it has been reported that djurlite, unlike other sulphides improves the corrosion resistance of copper [15].
One has to remember that the effects of the various anions in combination might be quite different from those obtained for each anion individually. Synergetic effects can appear and the aggressiveness of one species can be modified by the presence of another species, which can have an accelerating or inhibiting influence. Especially when considering the role of different anions in copper pitting, there exists a large discrepancy concerning the joint action of different anions and even actions of individual anions when the time scale and conditions are changed [42-44]. It seems that more experiments in carefully controlled environments are required to reconcile the theory of pitting corrosion of copper and practical observations in sulfur/suphide containing solutions.
3.6. Electrical properties of surface films on copper in the presence of sulphide ions
In order to correlate the observations concerning the influence of sulphide ions on the corrosion behaviour of copper with measurable quantities, one approach is to characterise the effect of sulphide ions on the electrical properties of the surface films on copper. Schmuki and Boehni have studied pitting corrosion and semiconductive properties of passive films on stainless steels and concluded that there is a correlation between the distribution of localised states in the passive film, i.e., its defect structure, and the stability of the film [45]. It is, however, uncertain whether their results can be used when copper-sulphide films are studied, because possible pitting of copper sulphide film is entirely different from the pitting of passive oxide films on stainless steels.
Khairy et al. studied the conductivity of the sulphide film formed on copper electrodes [28,29]. Calculated values of the specific conductance of the deposited sulphide film were about 3.8*10-5Ω-1cm-1. They concluded that the conductivity is due to the defects in the Cu2S lattice caused by vacant cation sites as well as some Cu2+ ions replacing Cu+ ions.
4 SUMMARY OF RESULTS IN NEARLY NEUTRAL TETRABORATE SOLUTION
4.1 Introduction
The structure of the passive film on copper in a tetraborate solution has been interpreted to consist of a Cu2O layer in the stability region of monovalent copper species. At higher potentials the duplex film structure has been interpreted to consist of an inner Cu2O layer and of an outer CuO/Cu(OH)2 layer [46]. Additionally, substoichiometric CuOx or adsorbed Cu(OH)ad layers have been empirically detected at low overpotentials [47]. Also higher valence copper oxides CuOy • zH2O or copper III oxide have been suggested to exist at high positive overpotentials [48]. Both the film formed in the stability region of monovalent copper (consisting of mainly Cu2O) and the film formed in the region of divalent copper (consisting of mainly Cu2O + CuO/Cu(OH)2) have been found to show p-type semiconductive properties [49-57].
4.2 Experimental
Oxygen free phosphorus microalloyed copper (Cu OFP) containing 99.992 wt-% Cu and 45 ppm P produced by Outokumpu Poricopper Oy was used as the test material in all the experiments. The chemical composition of the test material is shown in Table II. The specimens were taken from a sheet hot rolled at temperature from 850°C to 800°C. The properties of the copper sheet analysed by Outokumpu Poricopper Oy are presented in Table III.
Table II. Composition of the investigated Cu OFP material. O / ppm P / ppm Fe / ppm Cu / %
1.5 45 2 99.992
Table III. Properties of the investigated Cu OFP material. tensile strength (MPa) yield strength (MPa) fracture strain (%) grain size (mm) conductivity (% IACS) 215 52 50 0.09 - 0.12 97.5
Tests were performed in an autoclave in 0.1 M Na2B4O7 (tetraborate) solution at 80 °C. The volume of the autoclave was 8 dm3. Tetraborate solution was made of pro analysis Na2B4O7 (Merck 1.06306) and of water prepared in a MILLI-RO
®
15 water purification system (Millipore). The pH at 80 °C was estimated to be 8.9 using thermodynamic calculations. Dissolved oxygen was removed from the electrolyte solution by bubbling with a gas mixture of Ar + 3% H2, after which the autoclave was pressurised to 2 MPa
using the same gas mixture. Electrode surfaces were ground using 4000 grit SiC emery paper.
Potentials were measured against a hydrogen electrode in the same solution. All the potentials in this work are reported versus reversible hydrogen electrode scale (RHE). The potential scale can be changed into the standard hydrogen scale (SHE) by subtracting 0.623 V from the RHE value, i.e. ESHE = ERHE - 0.623 V.
Voltammetric measurements were carried out using a Wenking LB 81M potentiostat and a Hi-Tek Instruments PPR1 waveform generator. Impedance measurements were performed by a Solartron ECI 1287/FRA 1260 system in a frequency range 0.01 Hz - 10 kHz at an AC amplitude of 10 mV (rms). Capacitance vs. potential curves were registered at a sweep rate of 1 mVs-1, and a frequency of 540 Hz at an AC amplitude of 10 mV (rms). The electrical properties of surface films were measured using the contact electric resistance (CER) technique. The used CER apparatus was manufactured by Cormet Ltd. Before starting CER tests, air borne oxides were removed from the contact surfaces (diameter 2 mm) using 4000 grit SiC emery paper. The surfaces were rinsed with MILLI-RO® 15 water and pressed together after which the CER apparatus was installed immediately into an autoclave. The contact displacement used was 2 µm which corresponds to a nominal contact pressure (compressive stress) of 0.67 MPa.
4.3. Results and discussion
4.3.1 Voltammetric measurements
Figure 5 shows a potentiodynamic polarisation curve measured with a sweep rate of 0.1 mV/s. In the positive going sweep two anodic peaks (AI and AII) are seen, indicating the oxidation of metallic copper to monovalent copper, (AI), and further to divalent copper (AII).
During the negative going sweep the reduction peaks CII and CI are the reduction counterparts of the oxidation peaks AII and AI, correspondingly. The peak CI is split in two parts. A noteworthy feature in the positive going sweep is that the current density in the stability areas of both monovalent copper and divalent copper does not increase as a function of potential. This indicates that the rate limiting step of the oxidation reaction is not a charge transfer step.
The surface film thickness after potentiostatic oxidation for different times was calculated from the charge consumed in cathodic reduction of the films. The results for three different oxidation potentials are shown in Fig. 6. The thickness is in the range of 10-6 m. It is noteworthy that the thickness increases clearly more rapidly at the oxidation potential of 0.75 VRHE and at 1.0 VRHE than at 0.6 VRHE.
Cu / 0.1 M tetraborate sweep 0.1 mVs-1 -0,2 -0,15 -0,1 -0,05 0 0,05 0,1 0,15 0,2 -0,2 0 0,2 0,4 0,6 0,8 1 1,2 1,4 POTENTIAL / VRHE CURRENT DENSITY / mA cm -2 A I AII CI CII
Figure 5. Potentiodynamic polarisation curve of Cu OFP in 0.1 M Na2B4O7, T = 80 oC,
p = 2 Mpa, sweep rate 0.1 mV/s.
Cu / 0.1 M tetraborate
film thickness after oxidation at different potentials
0 50 100 150 200 250 300 350 400 0,1 1 10 time / h Thickness / nm 0.6 V RHE 0.75 V RHE 1.0 V RHE
Figure 6. Surface film thickness as a function of oxidation time for Cu OFP in 0.1 M
Na2B4O7. Data is shown for oxidation potentials of 0.6 VRHE , 0.75 VRHE and
4.3.2 Resistance-potential curves
The contact electric resistance of the surface film measured in 0.1 M tetraborate solution is shown in Fig. 7 as a function of potential, together with the current density of the CER tips measured simultaneously. The used sweep rate was 0.1 mV/s. The polarisation current of the CER tips shows basically the same features as the one measured with a separate flag type working electrode shown in Fig. 5. Within the potential ranges corresponding to the stability regions of monovalent and divalent copper oxides the current density does not increase as a function of potential. Further, with this slower sweep rate the nearly steady state current density in the potential region of the monovalent copper is equal or slightly higher than that of the divalent copper.
Contact electric resistance is seen to increase by about seven decades at the potential where metallic copper oxidises to monovalent copper, indicating the formation of a surface film containing most probably Cu2O. The resistance reaches a maximum of about 15 Ωcm2 and then decreases as the potential increases, which is an indication of p-type semiconductor properties of the oxide. The fine structure of the R vs. E curve (i.e. peaks in resistance situated at about +0.85 V and +1.0 V) are related to the formation of copper (II) compounds, i.e. CuO and Cu(OH)2. Further increase of potential is seen to result in a decrease in resistance.
In the negative going sweep the resistance first increases but then exhibits a minimum at ca. 0.6 V. This minimum coincides with the start of the cathodic current CII due to the reduction of Cu(II) to Cu(I). A subsequent maximum is observed at ca. 0.4 V, after which the resistance decreases to the level of a clean surface at about the same potential at which the reduction current CI starts to increase. The low value of the resistance indicates that the surface film on copper is reduced totally and also that the film is relatively easy to reduce, as the potential difference between the peak potentials of film formation and reduction is only about 0.2 V. At the potential where monovalent copper oxidises to divalent copper (above 0.7 V) the resistance shows an increase by roughly one order of magnitude. At still higher potentials the resistance decreases when potential increases.
The surface film resistance of Cu OFP in a 0.01 M tetraborate solution (see Fig. 8) was found to be rather similar to that measured in a 0.1 M solution. The first maximum in the value of resistance at about +0.5 VRHE is again related to the formation of the monovalent copper, i.e. Cu2O. The following maximum in the value of resistance at about +0.8 VRHE and the subsequent plateau are related to the formation of divalent copper compounds such as CuO and Cu(OH)2.
0.000001 0.00001 0.0001 0.001 0.01 0.1 1 10 100 -0.2 0 0.2 0.4 0.6 0.8 1 1.2 POTENTIAL / VRHE RESISTANCE / Ohm cm 2 -1.5 -1 -0.5 0 0.5 1 1.5 2 2.5 3
CURRENT DENSITY / mAcm
-2
COPPER OFP 0.1 M Na2B4O7
T = 80 oC, p = 2 MPa
Figure 7. Contact electric resistance (symbols) and current density (line) of Cu OFP as a function of potential. Sweep rate 0.1 mV/s.
0,0000001 0,000001 0,00001 0,0001 0,001 0,01 0,1 1 10 100 1000 0 0,2 0,4 0,6 0,8 1 1,2 1,4 POTENTIAL / VRHE RESISTANCE / ΩΩ cm 2 Resistance COPPER OFP T = 80 oC, p = 2 MPa 0.01 M Na2B4O7 sweep rate 0.1 mVs-1
4.3.3 Impedance response of the films on copper
The semiconductor properties of the oxide films on copper were investigated by measuring the capacitance of the specimen during a negative going potential sweep. The result in the form of C-2 versus electrode potential -plots for oxide films formed at 0.6 VRHE and at 1.3 VRHE are shown in Fig. 9. The capacitance of the film formed at 1.3 VRHE remained constant at potentials where divalent copper oxide (mostly CuO) is stable, i.e. E > 0.75 VRHE, indicating that the film shows no semiconductor behaviour. However, the capacitance of the film that was formed at 0.6 VRHE (mostly monovalent copper oxide, Cu2O) showed a decreasing capacitance (linearly increasing C-2 as a function of decreasing potential) in the potential range 0.55 VRHE < E < 0.75 VRHE. This indicates that the film that is mostly Cu2O shows p-type semiconductor properties.
To determine the semiconductor characteristics of the film formed in the monovalent copper oxide region, the space charge layer capacitance was extracted from the data of Fig. 9 assuming that the capacitance at 0.0 VRHE is equal to the Helmholtz layer capacitance of the copper/electrolyte interface. Plot of the inverse space charge layer capacitance squared vs. potential, i.e. Mott-Schottky -plot is shown in Fig. 10. It is well approximated with a straight line according to the following relationship valid for p-type semiconductors
Csc -2
= (2/eεεoNA)(Efb - E + kT/e) (9)
and the corresponding potential axis intercept furnishes an estimate of the flatband potential of the film: 0.82 ± 0.01 VRHE. From the slope of this dependence, using a value of 12 for the dielectric constant of Cu2O [56], a value of the acceptor density is calculated as n = 7·1020 cm-3. This value is typical for anodically formed semiconductor films [56].
0,000 0,002 0,004 0,006 0,008 0,010 0 0,2 0,4 0,6 0,8 1 1,2 E / VRHE C -2 / 10 -6 F -2 2 h 0.6 V 1 h 1.3 V
Figure 9. C-2 versus electrode potential for Cu OFP oxidised at 0.6 V
RHE and at 1.3 VRHE. 0.0000 0.0005 0.0010 0.0015 0.0020 0.0025 0.0030 0.6 0.65 0.7 0.75 0.8 0.85 E / VRHE Csc -2 ( µµ Fcm -2 ) -2 Slope -1.7 X 10¹⁰ (Fcm-2)-2V-1 Intercept 0.82 V Cu OFP 0.1 M Na2B4O7, 80 oC 2 h at 0.6 VRHE
Figure 10. Mott-Schottky plot for a film grown at +0.60 VRHE on Cu OFP in 0.1 M
For a p-type semiconductor, the width of the space charge layer is a function of the acceptor density and the potential drop, i.e
W = (2εεo/eNA) 0.5
(Efb - E) 0.5
(10)
From this equation, the space charge layer thickness, i.e. the thickness of the semiconducting part of the surface film becomes W = 8*10-10 m at E = 0.6 VRHE. It is clear that the semiconducting part of the film is only a small fraction of the total film thickness shown in Fig. 6.
From general grounds, it is very likely that the corrosion rate of a metal covered with a surface film exhibiting semiconductor or insulator properties is limited by the transport of metal ions through it. Thus factors influencing the electrical and transport properties of the surface film most probably have a great impact on the corrosion rate. In order to investigate the role of different conditions for film formation on copper, impedance spectroscopic measurements in 0.1 M Na2B4O7 were performed in two ways:
• Starting from a fresh, mechanically ground surface, reducing the airborne film at -0.2 V vs. RHE for 30 min and forming an anodic film by potentiostatic polarisation of the copper electrode at 0.6 or 0.75 V vs. RHE for 3...20 h. Measuring the impedance response during film formation.
• Simulation of a cyclic oxidising / reducing / oxidising condition by performing a series of cyclic potentiodynamic sweeps (potential range -0.2 / 1.2 / -0.2 V vs. RHE, sweep rate 0.1 and 1 mVs-1), reducing the formed film at -0.2 V vs. RHE for 30 min and forming an anodic film by potentiostatic polarisation of the copper electrode at 0.6 or 0.75 V vs. RHE for 3..20 h. Measuring the impedance response during film formation. Fig. 11 shows the electrochemical impedance spectra of Cu oxidised at 0.6 V and Fig. 12 the spectra of Cu oxidised at 0.75 V for 3…20 h following the first experimental procedure. The results point to two dominating processes in the stability region of monovalent copper. The process resulting in the time constant at higher frequencies could be related to the electronic properties of the semiconductor part of the film, while that at lower frequencies is a combination of a interfacial charge transfer and a transport process.
The spectra shown in Figs. 11 and 12 can be successfully described with the following equivalent circuit
Rel R1
C1
R2 ZW
C2
where Rel is the electrolyte resistance, R1 and C1 are the semiconductor layer resistance and capacitance, respectively, R2 is the charge transfer resistance and C2 the interfacial capacitance.
10-2 10-1 100 101 102 103 104 105 100 101 102 103 104 frequency / Hz |Z| / Ohm cm 2 Cu / 0.1 M Na2B4O7, 80 °C 0.6 V vs. RHE 3 h 7 h 11 h 14 h 17 h 20 h -50 -40 -30 -20 -10 0 phase / deg
Figure 11. Impedance spectra for Cu OFP oxidised in 0.1 M Na2B4O7 (T = 80oC, p = 2
MPa) at E = 0.6 VRHE. Oxidation of fresh surface.
10-2 10-1 100 101 102 103 104 105 101 102 103 104 frequency / Hz |Z| / Ohm cm 2 Cu / 0.1 M Na2B4O7, 80 °C 0.75 V vs. RHE 3 h 7 h 11 h 14 h 17 h 20 h -60 -50 -40 -30 -20 -10 0 phase / deg
Figure 12. Impedance spectra for Cu OFP oxidised in 0.1 M Na2B4O7 (T = 80oC, p = 2
MPa) at E = 0.75 VRHE. Oxidation of fresh surface.
ΖΖW = RW tanh [( [(jωτW) 0.5] / (/ (jωτW)0.5
where RW is the transport resistance and τWis the time constant of the transport process. As the transport process can be described by a finite-length Warburg impedance, it most probably occurs in the semiconductor part of the anodic film. The best-fit values of the parameters RW, , τW, R1,C1,R2 and C2 are collected in Table IV for the two potentials at which the measurements were carried out.
Table IV. Fitting parameters for Cu OFP oxidised in pure tetraborate solution for
3…20 hrs at +0.6 VRHE (a) and +0.75 VRHE (b).
(a) 0.6 V RHE Time / h R1/Ωcm 2 C1/µFcm -2 R2 /Ωcm 2 C2/µFcm -2 RW/Ωcm 2 τ W /s 3 15 13.6 429 370 4900 72 7 12.2 15.0 1060 320 4850 156 11 19 12 1432 440 6400 200 14 10 14.5 1364 490 10400 400 17 13 14 1419 270 6700 400 20 12.2 13.7 1060 193 7500 400 (b) 0.75 V RHE Time / h R1/Ωcm2 C1/µFcm-2 R2 /Ωcm2 C2/µFcm-2 RW/Ω cm2 τW /s 3 93 19 234 39 2210 16.4 7 160 12 512 23 6540 64 11 150 11 450 21 9550 190 14 155 11.5 440 21 12250 400 17 150 12.8 490 19 13200 400 20 150 12.6 450 20 13220 400
The following conclusions can be made from the data in Table IV:
• The rate of the ionic transport process (inversely proportional to the transport resistanceRW) which is likely to be the limiting step in the corrosion reaction is practically the same for both potentials. The resistance RW does not change very much with the time of oxidation at 0.6 V and increases up to 14 h of oxidation at 0.75 V.
• The time constant of the transport process τW increases up to 14 h of oxidation and preserves a constant value for longer times. As this time constant can be described with the equation τW = δ
2
/ D, where δ is the thickness of the layer in which the transport occurs and D is the diffusion coefficient of the transported ionic species, this probably means that for oxidation times longer than 14 h the thickness of the barrier part of the anodic layer does not change any more.
• The rate of the interfacial charge transfer reaction (inversely proportional to R2) is ca. two times higher at 0.75 V than at 0.6 V. This is in good correlation with the higher steady state current density measured at 0.75 V when compared to 0.6 V.
• The capacitance of the semiconductor layer C1 is practically the same for both potentials whereas its resistance is much higher at 0.75 V than at 0.6 V. At present, no clear explanation of this observation can be given.
Figure 13 shows the electrochemical impedance spectra of Cu oxidised at 0.6 V and Fig. 14 that of Cu oxidised at 0.75 V for 3…20 h following the second experimental procedure. It turned out that these spectra although quantitatively different from those obtained using the first experimental procedure, contain the same number of time constants and can be described using the same equivalent circuit. This is a good indication that the experimental procedure does not change fundamentally the nature of the processes controlling the impedance response of the copper / anodic film / solution system.
The best-fit values of the parameters RW, , τw, R1,C1,R2 and C2 are collected in Table V for the two potentials at which the measurements were carried out.
The following conclusions can be made:
• The rate of the transport process is significantly greater for the film formed at 0.75 V when compared to that formed at 0.6 V. Furthermore, a significant increase of the transport resistance with the time of oxidation at 0.6 V is observed indicating the formation of a film which is the less defective, the longer the oxidation time. This result is in accordance with the fact that the time constant of the transport process is roughly 4 times smaller than in the case of films formed according to the first experimental procedure (cf. Tables IV and V). This indicates that probably the thickness of the barrier part of the layer is smaller in the case of the films formed according to the second experimental procedure. It is likely that less defective films will grow to a smaller thickness, because of the lower ionic defect transport rate.
• The charge transfer resistance R2 is once again ca. 3 times smaller at 0.75 V indicating a faster rate of the charge transfer reaction at this potential.
• The capacitance of the semiconductor part of the layer C1 for the films formed according to the second experimental procedure is significantly smaller at 0.6 V when compared to 0.75 V. This may mean that the semiconductor part of the film at 0.6 V is thicker or has a smaller dielectric constant. Another important feature is that the capacitance C1 decreases with the time of oxidation at 0.6 V and stays roughly constant at 0.75 V. The values of this capacitance at 0.75 V are close to a typical value for the Helmholtz layer capacitance, i.e. the thickness of the semiconducting part of the layer is less than a monolayer. This fact is in correlation to the result that the resistance of the semiconducting part of the layer R1 is significantly smaller for films formed at 0.75 V than at 0.6 V and decreases with the oxidation time.
10-2 10-1 100 101 102 103 104 105 101 102 103 104 frequency / Hz |Z| / Ohm cm 2 Cu / 0.1 M Na2B4O7, 80 °C 0.6 V vs. RHE 3 h 7 h 11 h 14 h 17 h 20 h -50 -40 -30 -20 -10 0 phase / deg
Figure 13. Impedance spectra for Cu OFP oxidised in 0.1 M Na2B4O7 (T = 80oC, p = 2
MPa) at E = 0.6 VRHE. Oxidation of surface after cyclic sweeps.
10-2 10-1 100 101 102 103 104 105 101 102 103 104 frequency / Hz |Z | / Ohm cm 2 Cu / 0.1 M Na2B4O7, 80 °C 0.75 V vs. RHE 3 h 7 h 11 h 14 h 17 h 20 h -60 -50 -40 -30 -20 -10 0 phase / deg
Figure 14. Impedance spectra for Cu OFP oxidised in 0.1 M Na2B4O7 (T = 80oC, p = 2
MPa) at E = 0.75 VRHE . Oxidation of surface after cyclic sweeps.
Table IV. Fitting parameters for Cu OFP oxidised after cyclic sweeps in pure
tetraborate solution for 3…20 hrs at +0.6 VRHE (a) and +0.75 VRHE (b).
0.6 V RHE Time / h R1/Ωcm2 C1/µFcm-2 R2 /Ωcm2 C2/µFcm-2 RW/Ω cm2 τW /s 3 110 12.4 433 52 5300 55.7 7 128 6.15 577 76 7800 81.1 11 115 7.12 754 43 9300 93.8 14 101.5 10.6 1214 15 10120 84.1 17 132 5.36 700 80 13700 100 20 118 5.28 623 67 14020 77.5 (b) 0.75 V RHE Time / h R1/Ωcm 2 C1/µFcm -2 R2 /Ωcm 2 C2/µFcm -2 RW/Ω cm 2 τ W /s 3 38 76.7 112.5 80 2200 18.8 7 39.5 103 206 310 3560 36.5 11 36 58 360 165 6656 100 14 16.5 68 260 190 5260 71.2 17 14 58 227 190 5920 79 20 15 56 330 120 7800 143
The results shown above give rise to a physical model for the structure of the surface film forming on copper at potentials where monovalent copper is stable. The film thickness calculated from the reduction charge was of the order of 10-6 m. However, the capacitance values measured indicate that the semiconducting layer of the film has a thickness of the order of 10-9 m. The model shown in Fig. 15 describes the film as consisting of a thin semiconducting layer at the film/electrolyte -interface and a thick inner layer. The location of the thin semiconducting layer is suggested to be at the film/electrolyte -interface, although it is realised that the location is influenced by the ratio of the rate of the formation of cation vacancies at the film/electrolyte -interface and the rate of formation of oxygen vacancies at the metal/film -interface.
INNER LAYER CONDUCTOR (IONIC AND ELECTRONIC) Cu OFP Vcu' OUTER LAYER WATER d = 10-9m P-TYPE SEMI-CONDUCTOR d = 10-6m
Figure 15. A physical model of the structure of surface films forming on copper in 0.1
M Na2B4O7 at 80 oC and in the potential range where monovalent copper is
stable.
4.4 Conclusions
The surface film forming on Cu OFP in 0.1 M Na2B4O7 at T = 80 o
C in the stability region of monovalent copper oxide can be described to consist of a bulk film and a thin outer layer. The bulk film has a thickness of about 10-6 m and it is a good electronic and ionic conductor. The thin outer layer at the film/electrolyte interface has a thickness of about 10-9 m, and shows p-type semiconductor properties. In the stability range of divalent copper the bulk film has the same thickness and is also a good electronic and ionic conductor. The thin outer layer does not show semiconductor properties. The rate of oxidation of copper, i.e. the corrosion rate of copper is controlled by the transport of cation vacancies in the thin outer layer both in the stability region of monovalent and divalent copper.
5 SUMMARY OF RESULTS IN BORAX SOLUTION WITH CHLORIDES
5.1 INTRODUCTION
In borax solution containing chloride ions CuCl is supposed to precipitate on the Cu2O layer. At higher potentials the structure of the surface film on copper has been suggested to be best represented by a hydrous inner Cu2O layer non-homogeneously covered by Cu(OH)2 and CuCl precipitates [49].
n-type semiconductive characteristics have been observed when copper was immersed in 0.1 M NaCl solution, which was probably due to the formation of a CuCl layer on top of the Cu2O film [60]. A similar structure has been suggested in the presence of chlorides in weakly acidic [61] and alkaline [62] solutions. Cu2O can be formed on copper in the presence of chlorides at any pH [62]. Modestov et al. [62] suggest that CuCl also affects the semiconductive properties of Cu2O by doping it with Cl
ions.
5.2 Experimental
The effect of chlorides on surface films and electrochemical behaviour of copper was studied in 0.01 M and 0.1 M Na2B4O7 electrolyte. Chloride additions were made in the form of NaCl. In other respects the experimental conditions were similar to those described earlier for tests conducted in 0.1 M Na2B4O7 electrolyte, see section 4.2.
5.3. Results and discussion
5.3.1. Resistance-potential curves
The film resistance together with the polarisation current of the CER tips measured at 80oC in 0.01 M tetraborate + 0.03 M NaCl solutions is shown in Fig 16. Measurements in 0.1 M tetraborate solution were unsuccessful because of what was interpreted as formation of slime-like electrically conducting substance between the closely separated CER tips.
In 0.01 M tetraborate solution containing chlorides, a dramatic decrease in resistance was observed when the potential reached the value of approximately +0.8 VRHE during the sweep in the positive direction as shown in Fig. 16. A strong increase in the anodic current was observed at about the same potential. No significant increase of resistance was observed at higher potentials. At lower potentials in the stability region of monovalent copper the resistance was higher by roughly one decade than in the same solution without chlorides, see Fig. 8. These results indicate that chloride ions have a detrimental influence on the film on copper in the stability region of Cu(II), while they exert only a minor influence on a film formed in the stability region of monovalent copper, Cu(I).
0,000001 0,00001 0,0001 0,001 0,01 0,1 1 10 100 1000 0,2 0,3 0,4 0,5 0,6 0,7 0,8 0,9 1 1,1 POTENTIAL / VRHE RESISTANCE / Ω Ω cm 2 -5 0 5 10 15 20 CURRENT DENSITY / mA cm -2 Resistance Current COPPER OFP T = 80 oC, p = 2 MPa 0.01 M Na2B4O7 + 0.03 M NaCl sweep rate 0.1 mVs-1
Figure 16. The film resistance and the current density of the CER specimens measured as a function of potential in a solution containing 0.01 M tetraborate + 0.03 M NaCl.
5.3.2 Addition of chlorides on steady state films formed in chloride-free solutions The effect of chloride ions on the stability of steady state surface films grown both in the stability region of monovalent (at +0.60 VRHE) and in the stability region of divalent copper (at +1.00 VRHE) in chloride free 0.01 M tetraborate solution was studied at 80oC. An addition of 0.03 M and a subsequent addition of 0.07 M chlorides in electrolyte did not affect the film resistance (ca. 200 Ωcm2) of a film grown for 17 hours in the stability region of monovalent copper (mainly Cu2O) in 0.01 M Na2B4O7 at +0.60 VRHE. A different behaviour was observed for films grown in the stability region of divalent copper (Fig. 17). The resistance of a film grown on Cu OFP for 18 hours at +1.00 VRHE in 0.01 M Na2B4O7 was approximately 2 Ωcm
2
before the NaCl injection of 0.03 M as shown in Fig. 17. The chloride injection increased the polarisation current of the CER specimens significantly, but no changes in the film resistance were observed during the first hours since the start of the injection. However, after an exposure of approximately five hours to the chlorides, the film converted first to an insulator for less than a one minute, which was followed by an abrupt film resistance decrease of eight orders of magnitude. Simultaneously the polarisation current increased again.
0.000001 0.00001 0.0001 0.001 0.01 0.1 1 10 100 17 19 21 23 25 27 29 31 TIME / hrs RESISTANCE / ΩΩ cm 2 0.1 1 10 CURRENT DENSITY / mA cm -2 Resistance Current COPPER OFP T = 80 oC, p = 2 MPa 0.01 M Na2B4O7 + 0.03 M NaCl E = +1.0 V vs. RHE Cl- injection
Figure 17. The effect of NaCl injection on the resistance and on the current density of the CER specimens for a film grown for 18 hours on Cu OFP in the stability
region of divalent copper (at +1.0 VRHE) in 0.01 M tetraborate solution. The
total NaCl concentration was 0.03 M, and it was injected during the time period from 1 hour to 2 hours.
These results indicate that also in the case of steady state films chloride ions greatly influence the stability and the properties of the anodic film formed in the stability region of divalent copper.
5.3.3. Impedance response of the films on copper
Figure 18 shows the electrochemical impedance spectra of Cu OFP after 2 h oxidation in the potential region where divalent copper oxide is stable (1.0 VRHE) and in the potential region where monovalent copper oxide is stable (0.6 VRHE), both measured in 0.1 M Na2B4O7 + 0.03 M NaCl.
The spectrum measured at +0.6 VRHE is to a certain extent similar to that measured in pure borax without the presence of chlorides, see Fig. 11, although the impedance is clearly smaller and the transport process is not detected. The spectrum measured at +1.0 VRHE shows one time constant at high frequencies probably related to the electronic conduction process and an additional time constant at low frequencies which probably describes the mass transfer through a porous layer. Moreover, the magnitude of the impedance at f→0 at +1.0 VRHE was found to be ca. 1.5 decades lower in the solution containing Cl- ions than in the pure tetraborate solution, once again in agreement with the CER results. This is probably due to the enhanced rate of the charge transfer reaction of copper oxidation by some chloride-assisted localised corrosion mechanism.
More information on the electronic properties of the surface films was gained by registering the capacitance of the Cu electrode during negative potential sweeps after 2 h
of oxidation in the potential regions of the stability of monovalent (0.6 VRHE) and divalent (1.0 VRHE) copper oxides in the 0.1 M Na2B4O7 + 0.03 M NaCl solution. Such sweeps are shown in Mott-Schottky coordinates in Figure 19 (a). Similar data is presented for the 0.1 M Na2B4O7 solution without the presence of chlorides in Fig. 9. It can be concluded that the anodic film formed in the stability region of monovalent copper (0.6 VRHE ) exhibits p-type semiconductor properties both in the Cl- free and Cl -containing solution as the inverse capacitance squared increases with the potential decreasing from 0.7 to 0.5 VRHE. The subsequent decrease of this parameter is related to the reduction of the Cu(I) in the film to metallic copper. The film grown in the stability region of divalent copper (1.0 VRHE) has no clear semiconductor properties since the square of the inverse capacitance stays rather constant in the range 0.7 to 1.0 VRHE both in the Cl- free and Cl- containing solutions.
To determine the semiconductor characteristics of the film formed in the monovalent copper oxide region, the space charge layer capacitance was extracted from the data of Fig. 19 (a) assuming that the capacitance at 0.0 VRHE is equal to the Helmholtz layer capacitance of the copper/electrolyte interface. Plots of the inverse space charge capacitance squared vs. potential were well approximated with straight lines according to the equation (9) presented above, as shown in Fig. 19 (b).
10-2 10-1 100 101 102 103 104 105 100 101 102 103 Frequency (Hz) |Z| / Ohmcm 2 E = +1.0 V E = +0.6 V -75 -50 -25 0 25 theta
Figure 18. Impedance spectra of Cu OFP after 2 h oxidation in the potential region
where divalent copper oxide is stable (1.0 VRHE) and in the potential region
where monovalent copper oxide is stable (0.6 VRHE), 0.1 M Na2B4O7 + 0.03
0,000
0,002
0,004
0,006
0,008
0,010
0,012
0,014
0
0,2
0,4
0,6
0,8
1
1,2
1,4
POTENTIAL / V
RHEC
-2/
µ
F
-2 2 h 0.6 V, start 0.75 V 2 h 1.0 V, start 1.2 V (a) slope = -1.51 X 10 10 (Fcm-2)-2 V-1 intercept 0.83 V 0 0.0005 0.001 0.0015 0.002 0.0025 0.003 0.0035 0.6 0.65 0.7 0.75 0.8 0.85 E / VRHE Csc -2 / ( µµ Fcm -2 ) -2 (b)Figure 19. Inverse of capacitance squared, C-2 versus electrode potential for (a)
monovalent and divalent oxides grown on Cu OFP in 0.1 M Na2B4O7 + 0.03
M NaCl at 80°C and (b) the space charge layer (Mott-Schottky plot) of a
film grown at +0.60 VRHE.
The corresponding intercept with the potential axis furnishes an estimate of the flatband potential of the film at 0.82 ± 0.01 VRHE (Fig. 19b),. From the slope of this dependence, using a value of 12 for the dielectric constant of Cu2O [56] the value of the acceptor density becomes NA = 8·1020 cm-3 for the 0.1 M Na2B4O7 + 0.03 M NaCl solution. This
value is slightly higher than the one estimated for the Cl- free Na2B4O7 solution earlier (7·1020 cm-3). This may indicate that the film formed at +0.6 VRHE in the solution containing chloride ions is slightly more defective than that formed without the presence of chlorides.
5.4. Conclusions
In the potential region of divalent copper, surface films formed in Na2B4O7 solutions containing chloride ions were found to be prone to break down. The breakdown of the films was observed during potentiodynamic scans in the presence of chloride ions, as the film resistance abruptly decreased by several orders of magnitude at E > 0.7 VRHE. Also, steady state films formed in chloride free Na2B4O7 solution in the stability region of divalent copper broke down, when chloride ions were added afterwards to the solution. Impedance of the films formed in the presence of chlorides at +1.0 VRHE was found to be more than a decade smaller than that of the films formed at +0.6 VRHE. This indicates a markedly higher corrosion rate at the higher potential +1.0 VRHE.
6. RESULTS IN BORAX SOLUTION WITH 10 PPM H2S
6.1 Experimental
Tests were performed in an autoclave in 0.1 M 0.1 M Na2B4O7 + 10 ppm hydrogen sulphide (H2S) solution at 80°C temperature. Hydrogen sulphide was added by bubbling continuously through the solution a gas mixture of Ar + 3% H2 + 350 ppm H2S (supplied by AGA Ltd) at a pressure of 2 MPa. This gas mixture was calculated to give an equilibrium concentration of 10 ppm of dissolved H2S in the water. All the tests were performed in a static nickel cladded autoclave. In other respects the experimental conditions were similar to those described earlier for tests conducted in 0.1 M Na2B4O7 electrolyte, see section 4.2.
6.2 Results and discussion
6.2.1 Voltammetric measurements
The cyclic voltammogram in Fig. 20 shows the same features as the one measured in borax solution without H2S. The peaks AI and AII are connected with the formation of monovalent and divalent copper, respectively. The peak AIII with its cathodic counterpart CIII, not seen in the solution without H2S (Fig. 5) are suggested to be related to the formation and reduction of a higher valent copper species or e.g. peroxide incorporated in the Cu(II) matrix. During the positive going sweep with the scale used no clear peaks can be discerned in the potential
-0.3 -0.2 -0.1 0 0.1 0.2 0.3 0.4 0.5 -0.5 -0.3 -0.1 0.1 0.3 0.5 0.7 0.9 1.1 1.3 1.5 POTENTIAL / VRHE
CURRENT DENSITY / mAcm
-2 COPPER OFP 0.1M Na2B4O7 +10ppm H2S p=20 bar, T=80°C Sweep rate 0.1 mV/s