A Review of Dryout Heat Fluxes and
Coolability of Particle Beds
APRI 4, Stage 2 Report
April 2002
and supervised by the Project Board, consisting of:
OKG Aktiebolag Mauritz Gärdinge, chairman
Swedish Nuclear Power Inspectorate Oddbjörn Sandervåg
Ringhals AB Anders Henoch
Forsmarks Kraftgrupp AB Ingvar Berglund
Barsebäcks Kraft AB Erik Larsen
A Review of Dryout Heat Fluxes and
Coolability of Particle Beds
APRI 4, Stage 2 Report
Ilona Lindholm
VTT Energy
P.O. Box 1604
FIN-02044 VTT
Finland
April 2002
This report concerns a study which has been conducted for the Swedish Nuclear Power Inspectorate (SKI). The conclusions and viewpoints presented in the report are
fragmentation in case of deep subcooled pool. A set of most relevant data for reactor applications have been chosen. Based on this, a general particle size distribution has been constructed.
Information from fragmentation and dryout tests and the Lipinski 0-D correlation have been utilised to assess the debris bed coolability for the Olkiluoto severe accident scenario. The calculation shows that a well-mixed bed would be coolable. A several cm layer of finer particles on top of the bed would reduce the dryout heat flux below the heat fluxes produced by decay heat in Nordic BWRs. In that case the particle bed would heat up and eventually melt. An estimate of melt pool coolability in Nordic BWRs has also been conducted. Based on the MACE and COTELS experimental data the melt pools in the pedestal are slowly coolable. The concrete erosion does not threaten the containment failure margins, except maybe at Forsmark 1 and 2 units. Release of non-condensable gases may cause an earlier start of filtered venting in Olkiluoto, Forsmark and Oskarshamn 3 plants.
particles is 500 kW/m2 to 1 MW/m2.
An effect of bed thickness can be seen for small particles and medium range (50-500 mm) beds. For thick beds, > 500 mm, the dryout heat flux does not any more change as the bed height increases.
The dryout heat flux increases with increasing coolant pressure. This can be explained by the increasing vapour density, which can remove more latent heat from the bed. Debris bed stratification, with small particles on top, clearly decreases the dryout heat flux. The dryout heat flux in a stratified bed can even be smaller than a heat flux of an equivalent debris bed consisting of the smaller particles alone. This is due to the capillary force, which draws liquid towards the smaller particles and causes the dryout to occur at the interface of the particle layers.
A model has been developed by Lipinski to estimate dryout heat fluxes in a particle bed. The model has been derived based on solution of momentum, energy and mass conservation equations for two phases. The 1-D model can take into account variable particle sizes (stratification) along the bed and different coolant entry positions. It has been shown that the model can quite well predict the observed dryout characteristics in most experiments. The simpler 0-D model can give reasonable estimates for non-stratified beds.
Results and observations of several tests on melt jet fragmentation in a water pool were studied. Significant amount of data with prototypic material tests exists. All of the tests show significant fragmentation in case of deep subcooled pool. An additional observation is that no energetic melt coolant interaction (steam explosion) has been reported for prototypic materials. A set of most relevant data for reactor applications have been chosen. Based on this, a general particle size distribution has been constructed. The average particle size obtained by this way was about 3.5 mm.
Information from fragmentation and dryout tests and the Lipinski 0-D correlation have been utilised to assess the debris bed coolability for the Olkiluoto severe accident scenario. The calculation shows that for well-mixed beds with 3.5 mm particles the dryout heat flux would be close to 1 MW/m2, well above the estimated heat flux due to decay heat. Stratification of finer particles on top of the bed due to e.g. a steam
explosion would reduce the dryout heat flux to 50-200 kW/m . This would be below heat fluxes produced by decay heat in Nordic BWRs.
The key uncertainty considering particle bed coolability is due to the particle size distribution and stratification. If the possibility of a thick fine particle layer on top of the bed can be ruled out, the particulate debris bed in Nordic BWRs will be coolable.
A rough estimate of melt pool coolability in Nordic BWRs has also been conducted. The MACE and COTELS experimental data have been summarised. Based on the data, the melt pools in the pedestal are slowly coolable. The concrete erosion does not threaten the containment failure margins, except maybe at Forsmark 1 and 2 units. Release of non-condensable gases during MCCI may cause an earlier start of filtered venting in Olkiluoto, Forsmark and Oskarshamn 3 plants.
2.1.3 Tests at Winfrith by Stevens... 17
2.1.4 DCC-1 and DCC-2 Tests at Sandia National Laboratory... 18
2.1.5 Experiments at UCLA by Tung et al... 20
2.1.6 Tests at KfK by Barleon et al... 20
2.1.7 SILFIDE Tests at EdF ... 21
2.1.8 Tests at Technical University of Munich ... 22
2.1.9 POMECO Tests at KTH ... 23
2.2 BOTTOM FLOODING OF THE BED... 23
3 STRATIFIED BEDS ... 26
3.1.1 DCC-3 Test in Sandia National Laboratory... 26
3.1.2 POMECO tests at KTH ... 31
4 LIPINSKI’S MODEL FOR ESTIMATING DRYOUT HEAT FLUXES ... 32
4.1 THE LIPINSKI 1-D MODEL... 32
4.2 THE LIPINSKI 0-D MODEL... 34
5 AN ASSESSMENT OF BWR REACTOR SITUATION ... 36
5.1 FORMATION OF PARTICLE BED... 36
5.1.1 CCM Tests at Argonne National Laboratory ... 36
5.1.2 KROTOS Tests at JRC ISPRA ... 39
5.1.3 FARO Tests at JRC ISPRA ... 40
5.1.4 The Olkiluoto case... 43
5.2 PARTICLE BED COOLABILITY ON PEDESTAL FLOOR... 48
5.2.1 The experimental results... 48
5.2.2 The Olkiluoto case... 50
5.3 MELT POOL COOLABILITY ON PEDESTAL FLOOR... 53
5.3.1 MACE Tests... 54
5.3.2 COTELS experiments ... 55
5.3.3 Coolability of melt pool by top flooding in plant scale ... 55
6 CONCLUSIONS... 59
fs particle shape factor, =1 for spheres
=0.78 for rough particles g acceleration of gravity = 9.81 m/s2 hfg heat of vaporisation [J/kg] J Leverett’s function Jg, J*g = 2 / 1 ∆ ⋅ ρ ρ gD
jg g , dimensionless vapor flux
Jl, J*l = 2 / 1 ∆ ⋅ ρ ρ gD j l
l , dimensionless downflow liquid flux
jg vapor superficial velocity in bed [m/s]
jl liquid superficial velocity in bed [m/s]
L total bed height [m]
Lc channel lenght at the top of the bed [m]
pc capillarypressure [Pa]
pv vapor pressure [Pa]
pl liquid pressure [Pa]
q heat flux, may be a function of elevation in bed [W/m2]
qL heat flux at a given elevation in the bed predicted by 0-D Lipinski model
in the laminar limit [W/m2]
qT heat flux at agiven elevation in the bed predicted by 0-D Lipinski model in
the turbulent limit [W/m2]
qd incipient dryout heat flux [W/m2]
qd,channel incipient dryout heat flux accounting for the effect of channeling [W/m2]
s saturation, liquid fraction in pores [-]
Sb bed total surface area/bed total volume [1/m]
S volumetric heat source [W/m3]
sL effective saturation at dryout at the top of the bed for 0-D model in the
laminar limit [-]
sT effective saturation at dryout at the top of the bed for 0-D model in the
turbulent limit [-]
Twater water temperature [oC], [K]
vf melt velocity at the water pool surface in the pedestal [m/s]
w inlet mass flux at the base of the bed [kg/(m2s)] wi weight fraction [-]
z coordinate [m]
Greek Letters
∆ρ density difference [kg/m3] ∆p pressure difference [Pa]
ε bed porosity [-]
λc capillary head [m], the distance which the fluid would be drawn up into a
dry bed from below agaist gravity µv dynamic viscosity of vapor [kg/m-s]
µl dynamic viscosity of liquid [kg/m-s]
νv vapor velocity [m/s]
νl liquid velocity [m/s]
ρv density of vapor [kg/m3]
ρl density of liquid [kg/m3]
σ surface tension [kg/s2] θ liquid/solid wetting angle
as hydrogen and carbon oxides. This in turn will increase the pressure in the containment.
One preventive measure for corium-concrete attack in a severe accident is to guarantee existence of a sufficient water pool in the containment pedestal to start immediately the cooling of debris. On the basis of experiments performed on corium-water interactions, it is justified to assume that corium will undergo significant fragmentation and cooling while falling through a deep water pool. Such a situation leads to formation of a particle bed on the containment floor. A question remains, however, if the coolant will be able of sustained decay heat removal from the debris bed.
The key parameters affecting the water access to a particle bed are the bed porosity and particle size and the geometry and the morphology of the formed particle bed. Furthermore, the coolant flow path into the bed may have important effect on accessibility of water.
These phenomena have been studied earlier for different applications in the chemical industry, which has led to development of models for packed beds. However, these packed beds generally did not have internal heating, which restricts the applicability of the earlier results directly to Light Water Reactor (LWR) accidents.
Research on coolability of internally heated particle beds first started with the sodium-cooled reactors. It was extended after TMI-2 accident in 1979 to address also LWR accidents. A number of experiments and modelling of dryout heat flux in homogeneous or two-layer particle beds were conducted till the mid 80ies, when Lipinski developed the much-applied correlations for estimation of dryout heat fluxes in particle beds. Recently, the studying of particle bed coolability has received new attention for more accurate models and reduction of remaining uncertainties in the existing modelling. The coolability of particle beds have received more interest, since the melt pool experiments have suggested that it may be difficult to cool a melt pool by pouring water on top. Particularly, new information of corium fragmentation and related particle size distributions has become available in the 90ies, and this has increased the interest in coolability of stratified particle beds as well as search for the means to enhance particle bed coolability.
A special interest to Swedish and Finnish nuclear research is that at Nordic BWRs the containment compartment below the pressure vessel will be flooded prior to the anticipated pressure vessel failure as a severe accident management measure. According to analyses performed for Nordic BWRs [Lindholm et al., 1997], the vessel failure starts with small initial hole and the discharge of melt will proceed as a continuous jet. The water pool in the pedestal is deep and subcooled, and it is reasonable to assume that significant melt fragmentation occurs.
The objective of this review is to summarize results of experimental investigations of dryout heat fluxes in homogeneous and stratified particle debris beds. Moreover, the data obtained will be applied to a typical BWR reactor case to assess coolability of debris in the containment pedestal during a severe accident. In addition, a short discussion is included on current status of melt pool coolability issues.
2
DRYOUT HEAT FLUXES IN PERFECTLY
MIXED BEDS
2.1
COOLANT ENTRY FROM THE TOP OF THE BED
2.1.1 Tests at UCLA by Schrock et al.
Schrock et al [Schrock et al., 1986] have studied the flooding of an isothermal particle bed by steam and water. The particles were made of stainless steel and were either spherical or cylindrical. The spherical particles had a diameter of 8, 16 or 39 mm, and the cylinders were 16 mm in diameter and height. The particle bed was placed in a Pyrex glass tube. Two different tube sizes were employed, one with an inner diameter of 15 cm and one with 30 cm. The particle bed height was 25 cm.
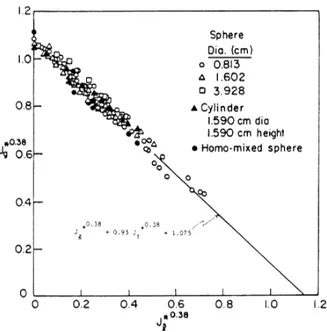
The purpose of the experiments was to study parametrically the effect of upward steam flow to the downward water access. Steam was injected uniformly from the bottom of the bed and water was poured through an annular distributor on top of the particle bed. The test was initiated with injection of steam into dry bed to heat up the particles to the steam temperature. After reaching a steady state the water injection was started. Water was pre-heated to a desired temperature and either saturated or sub-cooled water (50 oC) was used. The mass of water that penetrated the particle bed was collected into a reservoir vessel in the test vessel lower plenum and measured. The excess water that did not penetrate into the bed was collected to a reservoir in the upper plenum and measured. With each steam flow rate, the penetrating flow rate of water was measured. The results of the measured counter-current steam and water flows are presented in Figure 1. The intersection of the measured correlation line and the vertical axis gives the value of steam flow, where no water is able to penetrate the bed. This flow rate can be used to calculate the dryout heat flux.
Figure 1. Measured stream and water superficial velocities at steady state for
homogeneous beds [Schrock et al., 1986].
The Wallis’ correlation (1) is used as basis in describing dependence of superficial gas and liquid velocities.
C J m
Jng+ ⋅ nl = (1)
The parameters n, m and C of correlation (1) were determined from the measured data and the Wallis correlation got the numerical form presented by Equation (2):
075 . 1 95 . 0 0.38 38 . 0 + ⋅ = J Jg l (2)
The dryout heat flux can be calculated from Equation (3) utilising the parameters n, m and C
⋅
⋅
+ ⋅ ∆ − ⋅ ⋅ ⋅ = m g d h C q g l n n l fg n d ρ ρ ρ ρ ε ε 2 1 3 2 1 1 6 (1 ) (3)By substituting the parameter values C=1.075, n=0.38 and m=0.95 the dryout heat flux can be plotted as a function of particle diameter d. A comparison of different dryout
heat flux predictions to the measured data is shown in Figure 2. The correlation (3), shown as the solid line, fits rather well also with other data. It can be seen from the Fig. 2 that the dryout heat flux for 3.5 mm particle bed is about 1 MW/m2. For 1 mm particles the dryout heat flux is about 300 kW/m2.
Figure 2. Comparison of dryout heat flux predictions with data [Schrock et al., 1986].
2.1.2 Tests at Purdue University by Hu & Theofanous
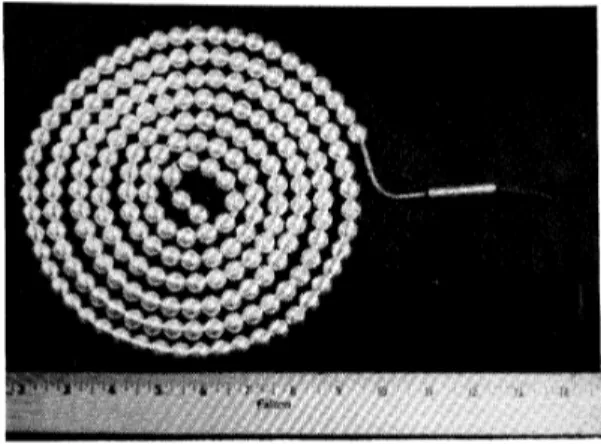
Hu & Theofanous [Hu & Theofanous, 1986] reported experiments in a volumetrically heated deep particle beds. The cylindrical bed had a diameter of 21.6 cm and height of 101.6 cm. The bed was assembled by layering a coiled resistance heater with threaded 1.27 cm aluminium balls (Fig 3), into particle bed of average 8 mm stone gravel (Fig. 4) as shown schematically in Fig. 5. The porosity of the bed was measured to be 0.387. A total of 240 thermocouples were placed throughout the bed and were scanned at 5 s intervals during the test. The beds were submerged in water and studied coolant penetration into the bed from the top.
Figure 3. The electric heater. [Hu &
Theofanous, 1986] Figure 4. Stone fragments used in bed.[Hu & Theofanous, 1986]
Figure 5. Debris bed module showing present internal structure of bed. All dimensions
in centimetres. [Hu & Theofanous, 1986]
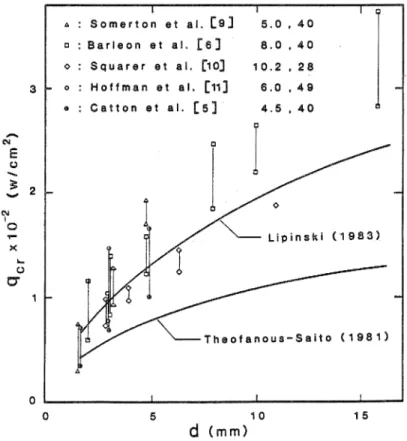
Figure 6 illustrates the existing measured data referenced by Hu and Theofanous. The measured data show large scattering. For example for 3-mm particles the measured dryout heat fluxes vary between 670 kW/m2 and 1.5 MW/m2. The Lipinski correlation applied by Hu and Theofanous gives rather a good agreement with measurements with large particles (> 2 mm).
Figure 6. The available experimental data on debris bed coolability in the large
particle regime. Water 1 bar, ε = 0.4. Lipinski, Theofanous-Saito. [Hu & Theofanous, 1986]
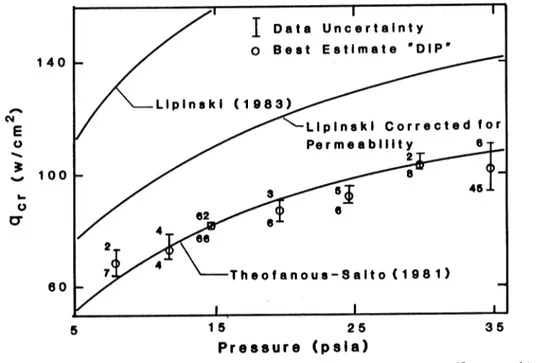
According to Theofanous & Hu the pressure dependence of dryout heat flux is overpredicted by about 35-40 % with Lipinski’s correlation (Fig. 7). This statement is based on their measured dryout heat fluxes with non-spherical particles (8 mm) in a bed with porosity 0.386. Theofanous & Hu measured the dryout heat flux for large particles in deep beds to be 821 kW/m2 at atmospheric pressure and about 1.1 MW/m2 at pressure 2.4 bar.
The structure of the dryout zone with varying heating power can be visualised as shown in Fig. 8. The dryout zone spreads into a larger area with increasing power, and also the dryout occurs higher in the bed with higher heating powers. On the other hand, with lower powers the dryout zone tends to remain limited and the deposited energy tends to go to heating up of the dry region rather than to expansion of the dry zone.
Figure 7. Comparison of measured incipient dryout heat fluxes with predictions. Water,
ε=0.386, d=8 mm. The extremes of ranges at 14.7 and 35 psia were obtained in independent runs. [Hu & Theofanous, 1986].
Figure 8. The dryout propagation pattern as function of applied power [Hu &
Theofanous, 1986]. Water 1 bar, ε = 0.386, D=8 mm, o: 100-200°C, φ: 200-300°C, •: >300°C.
2.1.3 Tests at Winfrith by Stevens
Stevens (1986) has carried out dryout heat flux experiments with equal-sized spherical steel balls and water. The particle beds were shallow, 5-15 cm deep, and the particle size varied from 0.22 to 5 mm. The water pool on top of the bed was held at a constant
value of 6 cm. He varied the ambient pressure in the tests and reported that pressure increase from 1 bar to 9 bar increased the dryout with up to 75 % with bed flooded from the top. The influence of pressure increases with larger particles. With particles of 3.5 mm the measured dryout heat flux at 1 bar was 960 kW/m2 and at 9 bar 1.35 MW/m2.
2.1.4 DCC-1 and DCC-2 Tests at Sandia National Laboratory
Sandia National laboratory performed a series of DCC (Degraded Core Coolability) tests to verify the accuracy of existing coolability models in previously untested severe accident parameter regimes (Reed et al., 1986; Reed et al., 1985). The first two tests studied the behaviour of a homogeneously mixed, deep UO2 particle beds in a
pressurised water bath, with pressure varying from atmospheric to 170 bar.
The DCC-1 test was run with small particles having a broad size distribution. The mean particle size was 0.71 mm with an effective, Fair-Hatch weighted diameter of 0.31 mm. Fair-Hatch diameter is defined by the formula (4):
1 − − ⋅ =
∑
i i i s Hatch Fair d w f d (4)where fs is a shape factor (1 for spheres, 0.78 for rough particles), wi is the weight
fraction of particles with sieve diameter di
The measured porosity of the bed was 0.345. DCC-2 test had a narrower size distribution of larger particles with the mean and effective particle diameters being 2.43 mm and 1.42 mm, respectively. The measured porosity of DCC-2 bed was 0.41. By adopting the definitions of Lipinski’s model, the flow was laminar in DCC-1 test and in transition region in DCC-2 test.
The diameter of the UO2 particle bed was 10 cm and the height was about 50 cm. The
bed was placed in a test package containing coolant pool unit and instrumentation. The package was heated in the ACRR (Annular Core Research Reactor) with normal internal fission power.
Several dryout measurements were performed with varying pressure. Figures 9 and 10 show the measured dryout heat fluxes as functions of pressure in DCC-1 and DCC-2 tests, respectively. The measured dryout heat fluxes in DCC-1 were low, about 20 kW/m2 at 1 bar and about 50 kW/m2 at 5 bar. In general all available calculation models overestimated the dryout heat flux at pressures higher than 10 bar.
The measured dryout heat fluxes in DCC-2 tests were markedly higher. The local dryout was measured at 500 kW/m2 at 3 bar, at 10 bar the local dryout was obtained with heat flux of about 900 kW/m2. The global dryout was obtained with heat fluxes 1.0-1.7 MW/m2. Lipinski 1-D model was able to predict well the local dryouts at all pressures. The Lipinski 0-D model predicted well the global dryouts.
Figure 9. DCC-1 dryout heat flux vs. pressure [Reed et al, 1986].
DCC tests also studied quenching, i.e. a reverse process to searching of the dryout heat flux. A submerged particle bed is first brought to dryout and then further heated up to elevated temperatures (>1000 K). After that the power is reduced and the bed allowed to quench. Reed et al. (1986) refer to the frequent observations in out-of-pile quenching experiments where a liquid finger is propagating downwards and quenching only a portion of the bed until it reaches the bottom of the bed and spreads outward. After that the quench front progresses upward. In DCC-1 test bed, no liquid fingering was observed. The quench front moved uniformly downwards and took hours to reach the bottom. In DCC-2 test the quenching took only a few minutes. However, the test bed of DCC-2 had a radially non-uniform temperature and permeability distribution, which caused the water penetration downward from the high permeability side of the bed. After reaching the bottom the water moved upward the low permeability zone. This inhomogeneity probably modified the process. This has been interpreted as liquid finger type of quenching [Reed et al. 1986].
2.1.5 Experiments at UCLA by Tung et al.
Tung et al. (1986) have performed coolability tests with volumetrically heated particle beds with top flooding and simultaneous air injection from the bottom of the bed. The air injection simulated the gas releases from concrete erosion. The particle bed consisted of stainless steel balls with diameter ranging from 0.6 mm to 1.6 mm. The bed height varied between 18 and 25 cm. The overlying water layer was maintained at about same height as the particle bed at all times. Air was injected with constant flow rate. The average temperature of the bed was between 150-350 oC. The bed was heated with induction coil, and the volumetric power was scaled to 0.5 –1 W/cm3. This is of the same order as expected in a reactor situation. In Olkiluoto reactor case the assumption of 1-% power level uniformly generated in a debris bed with in-vessel steel included results in volumetric power of about 0.65 W/cm3. With the heating rate 1 W/cm3 Tung et al. observed that about 2.5 cm at the bottom of the bed did not quench for 1.6 mm particles. About 7-cm thick layer from the bottom did not quench in a similar test with 0.8-mm particles. However, with lower heating rate, 0.5 W/cm3, the bed quenched in 15 minutes. These tests were performed with zero bottom gas flow. The next test was carried out with air injection of 11.3 cm/s. This is a high value for siliceous concrete releases, but typical for limestone/sand concretes. In the ACE tests the measured superficial gas velocities for siliceous concrete were 2.6-2.9 cm/s. With air injection of 11.3 cm/s, about 1 cm from the bottom of the bed did not quench. Considering the lower gas release rates from the concrete in the Nordic BWRs, this result suggests that ongoing concrete erosion does not affect the overlying particle bed dryout heat flux.
2.1.6 Tests at KfK by Barleon et al.
Kernforschungszentrum Karlsruhe (Barleon et al., 1986) have measured dryout heat fluxes and quenching phenomena in an inductively heated beds of small particles. The height of homogeneously mixed particle bed varied between 16-20 cm. The spherical stainless steel particles of the tested three beds ranged in size between 0.15-0.71 mm, 0.2-0.5 mm or 0.2-0.315 mm. The porosities of the beds were 0.363, 0.395 and 0.4,
2.1.7 SILFIDE Tests at EdF
More recent experiments have been performed by Decossin (1999) with SILFIDE test facility. The particle bed was constructed of particles with spherical steel balls of diameter 1.7-7.1 mm. The bottom of the bed was rectangular with sides being 60 cm and 10 cm. The bed height was 50 cm and the porosity of the bed was 0.4. Water was coolant and the tests were operated in atmospheric pressure. The bed was heated by induction. A lot of effort was needed to minimise and assess the non-uniformities caused by the eddy currents.
The measured dryout heat fluxes were higher than those estimated by Lipinski’s 1-D method, but lower than Lipinski’s 0-D predictions. For 2, 3.4, 4.7 and 7.1 mm particles the measured dryout heat fluxes were 0.7, 1.0, 1.5 and 1.65 MW/m2, respectively. The bed height was varied from 0.3m to 0.5 m, and the dryout heat flux decreased as the bed height increased. Actually with deeper beds of relatively large particles (4.76 mm) the dryout heat flux seemed to approach the Lipinski’s 1-D estimate. Figure 11 shows the results of the SILFIDE tests.
Figure 11. Dryout heat fluxes measured in the SILFIDE tests [Décossin, 1999].
2.1.8 Tests at Technical University of Munich
Zeisberger et al. (1999) have recently carried out experiments on particle bed coolability at typical in-vessel pressures. One objective of the tests was to study gap-cooling phenomena for particle beds. The tests are included in this review, because the general phenomena are similar in the ex-vessel situation. The bed configuration was a narrow slice, 50 x 15 cm from the bottom and 13 cm high. The bottom of the bed was 10o inclined to simulate pressure vessel lower head curvature. The bed consisted of spherical steel and glass balls, either 2-mm steel balls or a mixture of 4-mm steel balls
2.1.9 POMECO Tests at KTH
KTH has studied dryout heat fluxes with POMECO test facility (Konovalikhin et al, 2000). Their particle bed was constructed of relatively fine sand particles heated with imbedded resistance heaters. The porosity of the bed was varied from 0.26 to 0.4 by different mixtures of sand particles. The coolant was nearly saturated water and the test pressure was atmospheric. The cross-section of the bed was 35 x 35 cm and the bed height was 45 cm. The POMECO test matrix was designed to investigate the effects of particle size, bed porosity and stratification on the dryout heat flux.
In the homogeneous bed tests the measured dryout heat fluxes with top flooding were 90 and 222 kW/m2 for beds with mean particle size of 0.2 and 0.9 mm, respectively. The bed porosity was about 0.4 in these tests. If the bed porosity was reduced (with the mean particle size being 0.8 mm) the dryout heat flux decreased significantly, down to 45 kW/m2. It was further reported that the measured dryout heat fluxes with larger particles agreed rather well with the predictions by Lipinski’s 0-D model. However, it was noted that Lipinski’s model underpredicted the dryout heat flux with the small particles (mean size 0.2 mm).
POMECO tests also investigated the effect of downcomers or a sort of bottom flooding on dryout heat fluxes. The addition of open, vertical tubes into the sand bed increased the dryout heat fluxes markedly, by 50-470 %. The enhancement of coolability effect was strongest in a bed with smallest particles or lowest porosity. This cooling effect is driven by stronger capillary effect, as has been recognised also in the earlier studies. It must be mentioned here that all measured dryout heat fluxes for POMECO test beds were lower than the anticipated decay heat fluxes in a typical Nordic BWR situation. On the other hand, the applied particle sizes were rather small and the applied beds were rather thick when compared against the data on observed particle size distributions in melt fragmentation tests that will be discussed in Chapter 5.1.
2.2
BOTTOM FLOODING OF THE BED
Tsai and Catton (1986) have studied the effects of water entrance to a particle bed from different directions. Their tests addressed a situation, where a heap of debris would be
surrounded by water and rest on permeable plate. The test apparatus consisted of a 14.4 cm Pyrex glass tube placed inside a coil for inductive heating. The glass tube was filled with two kinds of particles, 6-mm glass beads formed the bottom of the bed and an annular ring near the walls. An inner cylinder was formed of steel particles with diameters of 1.6, 3.2 and 4.8 mm. Induction affected only the steel balls. Water was injected from the top and from below.
Their key observations were that due to the coolant entry from sides and bottom, a multidimensional porous bed has a higher dryout heat flux than a homogeneous bed. The dryout heat flux decreases as the diameter of the heated part increases relative to the unheated zone and approaches asymptotically the dryout heat flux of semi-infinite particle layer. The side flow of water has less effect with smaller particles.
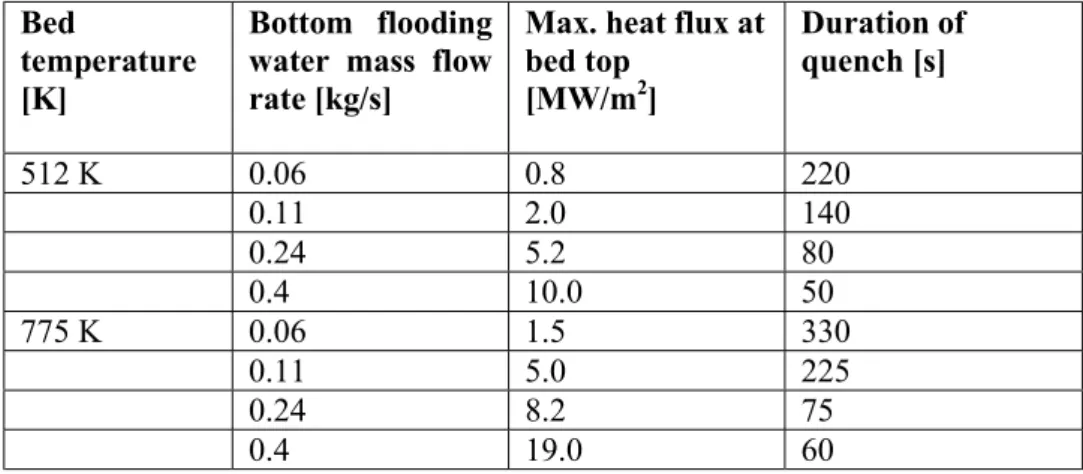
Tutu et al. (1986) have performed experiments on particle bed coolability by bottom flooding at atmospheric pressures. The particle bed consisted of homogeneous steel balls with diameter 3.175 mm. The bed diameter was 10.8 cm and height 42.2 cm. The porosity of the bed was 0.39. The injected water was saturated and the initial temperature of the bed was varied 512 K, 594 K or 775 K. The superficial velocity of the inlet water was 1.1, 1.98, 4.42 or 7.4 mm/s corresponding to mass flow rates of 0.6, 0.11, 0.24 and 0.4 kg/s, respectively.
The quench front propagated as a uniform front from bottom to top of the bed. The measured peak heat fluxes leaving the debris bed are gathered in Table 1. The cooling was efficient even with smallest mass flow rate. In all cases the dryout heat flux exceeded the decay heat flux in a typical reactor situation.
Table 1. Dryout heat fluxes with water injection from the bottom measured for 3.175
mm particles.
Bed
temperature [K]
Bottom flooding water mass flow rate [kg/s]
Max. heat flux at bed top [MW/m2] Duration of quench [s] 512 K 0.06 0.8 220 0.11 2.0 140 0.24 5.2 80 0.4 10.0 50 775 K 0.06 1.5 330 0.11 5.0 225 0.24 8.2 75 0.4 19.0 60
Tung and Dhir (1986) have performed experiments on quenching heat fluxes of bottom flooded particle beds. They heated up 3.2 – 4.8 mm homogeneous particle beds and measured the pressure spikes caused by rewetting and quenching. The particles were initially heated up to 400 oC or 600 oC. They measured maximum quenching heat fluxes that were up to of 19 times the calculated dryout heat flux. The pressure spike caused by
At a lower particle bed temperature range (T<900 oC) and subcooled sodium (by at least 300oC) the incipient dryout was reached with power density of 0.425 W/g, corresponding to heat flux of 424 kW/m2. Lipinski’s model predicted the dryout power to be 0.345 W/g. The first dry zone formed close to the bottom of the bed, at the elevation 5.5-6 cm from the bottom. The dry zone expanded within one minute downwards to the next thermocouple elevations at 4 cm from the bottom. The dry zone also expanded rapidly laterally over the whole cross-section of the bed. The measured downward heat transfer was 260 kW/m2, so the dryout power was about 164 kW/m2. After the first dryouts the power was increased to produce local fluidisation or channel formation in the bed. The first channels formed with heating power of 1.0 W/g. The channel formation was observed as an increase of the measured boiling temperature and pressure until a decrease in temperature occurred due to local pressure relief. After the disruption of the channel the power was again increased until a dryout occurred at the power level 1.06 W/g. The disruption event had increased the coolability by a factor of 2.5. The Lipinski’s model overpredicted the incipient dryout power in a channeled bed by a factor of 2 and also predicted that the dry zone was thin, 6 mm, in contrast to 30 mm, what was measured in the test.
As an interesting side information from the tests it can be mentioned that the power was gradually increased to study the heat transfer phenomena at the elevated UO2
temperatures. The power was increased until 2500 oC was reached, which was deemed to be the point, where melting of the particles would commence. The needed power level was 1.6 W/g (corresponds to heat flux 1.59 MW/m2). The downward heat flux ranged 50-450 kW/m2. The dry zone where the maximum temperatures were reached was 6 cm thick and located at the bottom of the bed. The dry zone expanded quite rapidly, once established. This gives some estimate for the possible downward cooling of passive core catchers.
3
STRATIFIED BEDS
3.1.1 DCC-3 Test in Sandia National Laboratory
The third degraded core coolability experiment, DCC-3, was performed at Sandia National Laboratory in the early 80ies (Boldt et al., 1986). DCC-3 was designed to examine the influence of particle stratification on incipient dryout powers as a function of pressure up to 6.9 MPa and further to study the benefits of coolant inlet flow at the base of the debris.
Because the dryout heat fluxes in DCC-1 and DCC-2 experiments were already measured at very high pressures up to 170 bar, the DCC-3 test needed only to address the pressure dependent effects in the range from 70 kPa to 6.9 MPa, where the most significant influence s were recognised to be. The overall experimental set-up for DCC-3, as shown in Figure 12, was similar to all of the in-pile coolability experiments at SNL.
Figure 12. DCC-3 experiment overall set-up by Boldt et al [Boldt et al., 1986].
The debris bed of DCC-3 test consisted of UO2 (enriched to 10% U-235). The bed was
10 cm in diameter and 50 cm thick. The bed porosity was 41%, yielding a total fuel mass of 24.1 kg. The debris bed was stratified and comprised two homogeneously mixed particle distributions (Fig. 13). The lower 40 cm-layer consisted of large particles with a surface-area-averaged particle diameter of 4.67 mm corresponding to an effective
Figure 13. DCC-3 particle size distribution [Boldt et al., 1986].
The water pool in the experiment was maintained at the level 0.5 meters above the debris bed surface. The additional bottom flow system injected saturated water and provided forced flow to the crucible bottom.
The DCC-3 experiment took 10 days. The first set of experiments investigated incipient dryout between saturation temperatures of 155 and 250ºC with only top flooding. The first dryout demonstrated that the dryouts were global in nature. The global dryouts extended across the entire width of the bed and cut off the water flow from the overlying pool to the bottom of the bed. The measured dryout powers without bottom injection varied between 117 kW/m2 and 285 kW/m2.
The second set of measuremenst investigated the dryout powers with bottom flooding. The saturation temperatures varied from 166 oC to 211 oC. The bottom flooding rate was 0.01-0.08 gpm. The dryout heat fluxes with bottom flooding at saturation were significantly higher than with top flooding. The measured dryout heat flux at saturation temperature 166 oC (corresponds to about 7 bar) varied from 179 kW/m2 to 1.3 MW/m2 with flooding rates of 0.01 and 0.08 gpm, respectively.
Eventually the reactor power was increased using large steps and the dryout measurements were extended until a fuel temperature of 792ºC was reached. Following this the reactor power was lowered and the bed allowed to quench. The quenching took about 50 minutes (Fig. 14).
be coolable under reactor accident conditions with top flooding. Boldt et al. (1986) concluded that the dryout level of a stratified bed can not be conservatively estimated based upon the dryout level of the smallest particles.
The observation can be explained by capillary forces. Figure 16 shows the saturation profile for a 2-layer stratified bed. Saturation in the bed is nearly unity above the particle layer interface. Immediately below the interface, the saturation jumps to a very small value, increases rapidly to about 0.5 and then increases slowly as the bottom of the bed is approached. The critical flooding condition takes place at the point of minimum saturation at the interface of the two layers. This minimum is much lower in a stratified bed than in a homogeneous bed.
The reason for the jump in saturation is found in the capillary pressure/saturation curve, which is based upon the Leverett correlation (see also discussion in Chapter 4)
( )
( )
5 ) 1 ( 1 cos 150 175 . 0 1− = − ⋅ ⋅ ⋅ ⋅ ⋅ = P d s− s J c ε θ σ ε (5) The capillary pressure Pc, must be continuous across the interface of the layers.Equation (5) states that the capillary pressure Pc is a continuously decreasing function of
s. The capillary pressure Pc is higher for smaller particles. The continuity of Pc across
the interface is fulfilled only the saturation s in the coarse layer is low enough to balance the high capillary pressure of the fine particle layer.
For all runs with the bottom flooding the dryout was located at the stratification of interface. If the bottom flow is sufficiently high, the stratification will play no role in the dryout and the bed will behave like a deep bed of the smaller particles. Figure 17 shows the dryout heat fluxes in DCC-3 test with varying bottom flooding rates. It can be seen that even with as small a bottom flow as 0.3 mm/s the DCC-3 type of bed would be coolable in reactor case.
Figure 16. Predicted saturation profile (bottom flow, uniform heating, 166ºC) [Boldt
et al., 1986].
Figure 17. Dryout heat fluxes in DCC-3 test bed with bottom flooding of the bed.
In the first two test sets the bottom layer had porosity 0.37 and mean particle size 0.9 mm. The thickness of the bottom layer was 24 cm. The top layer consisted either of finer particles (mean particle diameter 0.2 mm, porosity 0.39) or of low porosity sand (porosity 0.26, mean particle size 0.8). The thickness of the top layer was 13 cm. The measured dryout heat fluxes were 88 and 54 kW/m2, which are in line with the Lipinski’s 1-D model, that states that in deep stratified beds the dryout heat flux is the same as if the bed consisted completely of finer top layer particles. In the other two test sets the particle sizes and bed porosities were similar to the first two test sets, but the thickness of the top layer was 24 cm and that of the bottom layer was 13 cm. The measured dryout heat fluxes were 56 and 122 kW/m2. The addition of downcomers increased the dryout heat flux by a factor of 2-4, but still the dryout heat fluxes would be below the expected decay heat fluxes for example in Olkiluoto reactor case.
4
LIPINSKI’S MODEL FOR ESTIMATING
DRYOUT HEAT FLUXES
The most referenced and applied models for estimation of dryout heat fluxes in a particle bed are developed by Lipinski [Lipinski, 1982]. The first model by Lipinski, the so-called 0-D model, was developed for homogeneous beds. Later model, so-called 1-D model takes into account also the changing particle size and porosity of the bed as a function of elevation.
In most reactor application cases, particularly in cases with deep particle beds, the 0-D model gives reasonable enough estimates for dryout heat fluxes. However, the calculation of the stratification effects needs 1-D model.
4.1
THE LIPINSKI 1-D MODEL
The Lipinski’s 1-D model is based on the solution of momentum, energy and mass conservation equation of a two-phase fluid flow. The momentum equations for liquid (l) and vapour (v) are:
(
)
(
)
(
1)
0 1 150 1 ) 1 ( 75 . 1 3 3 2 2 3 3 − + + = − + − − g dz dp s d v s d v v v v v v v v v ρ ε µ ε ε ρ ε ( 6)(
1)
0 150 ) 1 ( 75 . 1 3 3 2 2 3 3 + + = − + − g dz dp s d v s d v v l l l l l l l ρ ε µ ε ε ρ ε (7) The equations are based on the fundamental work by Ergun [Ergun, 1952], who correlated the pressure drop in a porous media to the sum of laminar and turbulent components. For velocities typical of dryout, the transition from laminar to turbulent flow occurs with about 1 diameter particles. The factors 150 and 1.75 are empirical, but values close to them can also be derived by analytical means.The energy conservation equation is: S h v dz d lv v v )= (ρ ( 8)
and mass conservation: 0 ) ( v + v = d ρ ρ (9)
J is a dimensionless function that is used to correlate the capillary pressure with saturation of the pores. The function (and capillary pressure) becomes very large when saturation decreases close to the residual saturation1. J is zero, when saturation is 100 %. Integration of Equation (9) with the boundary condition that the bottom net inflow is w gives w v vv l l v +ρ = ρ (12)
By integration of Equation (8) one gets q
v
hlvρv v= (13)
If the heat source is uniform one can write z
S
q= ⋅ (14)
By subtracting Equation (7) from Equation (6) and by differentiating Equation (10) and inserting it with Equations (13) and (14), one gets the basic equation of Lipinski 1-D model ± ⋅ ⋅ − ⋅ − ⋅ ⋅ ⋅ ⋅ − + + − ⋅ ⋅ ⋅ − ⋅ + ± − ⋅ ⋅ ⋅ − ⋅ = ⋅ − + ⋅ − ⋅ ⋅ ⋅ ⋅ − ⋅ ⋅ ⋅ − ⋅ ⋅ ⋅ − d h q w s p d w s s h d q s s h d q g d dz d J dz ds ds dJ d l lv l l l v v lv l v lv v l µ ε ε ε ρ µ ρ µ ε ε ρ ρ ε ε ρ ρ ε ε σ θ ε ε σ θ ) 1 ( 150 5 . 3 75 . 1 ) 1 ( ) 1 ( ) 1 ( 150 1 ) 1 ( 1 ) 1 ( 75 . 1 ) ( 1 cos 150 ) 1 ( cos 150 3 3 3 3 2 3 2 3 3 2 3 2 m (15)
The upper sign applies if q>hlv and the lower sign applies for q<hlv.
The first two terms are the capillary pressure gradients due to variations in the saturation and particle diameter. The second term is operative only in stratified beds. The third term is the hydrostatic pressure gradient. The fourth and fifth terms are the laminar and turbulent flow resistances, respectively. The last term is the flow resistance from the inlet flow [Lipinski, 1982]. The sensitivity of the equation to some parameters is demostrated in Appendix 1.
4.2
THE LIPINSKI 0-D MODEL
Solution of the differential equation (15) is complex. The 0-D model is adopted in this study for giving good first estimates for dryout heat fluxes in simple reactor application cases. In the 0-D model, the bed is assumed to be uniform.
The capillary effect has a simple form
d p pv l ⋅ ⋅ − ⋅ ⋅ = ∆ − ∆ ε θ ε σ (1 ) cos 6 (16) Equation (16) describes the pressure drop between the totally wet and totally dry portions of the bed.
In the simpler 0-D model Equation (15) becomes an algebraic equation, which is much easier to solve: g L d d h q w s p d w q s s h d q s s h d v l l lv l d l l v v lv d l v lv ⋅ − + ⋅ ⋅ − ⋅ ⋅ ⋅ = ± ⋅ − ⋅ − ⋅ − ⋅ ⋅ ⋅ ⋅ − + ⋅ + − ⋅ ⋅ ⋅ − ⋅ + ⋅ + − ⋅ ⋅ ⋅ − ⋅ ) ( ) 1 ( cos 6 ) 1 ( 150 5 . 3 75 . 1 ) 1 ( ) 1 ( ) 1 ( 150 1 ) 1 ( 1 ) 1 ( 75 . 1 3 3 3 3 2 3 2 2 3 3 2 3 ρ ρ ε ε σ θ µ ε ε ε ρ µ ρ µ ε ε ρ ρ ε ε (17)
With an impermeable bottom of the bed w=0 and the Equation (17) can be written as
q q q q q q L T T L T d + − ⋅ ⋅ =
2 2 4 4 2 2 2 1 (18) whereThe dryout heat flux qd can be obtained by maximising equation (18) in respect of s. At
the limits of laminar and turbulent flow conditions, the critical effective saturations are, respectively:
( )
+ = − ρ µ ρ µ v l l v L s 4 1 1 1 (22)( )
+ = − ρ ρ v l T s 4 1 1 1 (23)The values sL and sT define the range of s to varied in maximising of Equation (18).
If coolant on top of the bed is sufficiently subcooled, a region with vertical vapour channels may form on top of the bed. The channels increase the dryout heat flux. The effect of channels may be taken into account in the 0-D calculations by calculating the channel region height with the equation
g d L l p c ⋅ − ⋅ ⋅ ⋅ ⋅ = ) ( cos 6 ρ ρ ε θ σ (24)
where ρp is the density of debris particles. The dryout heat flux can be calculated now
L L q q c d channel d = − 1 , (25)
Equations (18)-(25) were programmed into a simple Fortran code DRYFLUX for application into a hypothetical reactor case.
5
AN ASSESSMENT OF BWR REACTOR
SITUATION
A simple assessment on coolability of debris bed in a typical Nordic BWR case has been performed. The example reactor is Finnish Olkiluoto case. Since all the Nordic BWRs have similar features the results can be to some extent extrapolated to other ABB reactors as well.
The first key issue to be considered is the formation of a particle bed on the pedestal floor after the vessel breach. Based on the various particle bed coolability experiments discussed in the previous chapters, it can be concluded that the dryout heat flux and thus the coolability of a granular debris bed is most dependent on particle size, bed porosity and mixing characteristics in the bed. Currently, there are no means to introduce forced bottom injection to the particle bed in the pedestal. Thus, this discussion focuses on top flooding case.
In some core melt fragmentation tests part of the melt formed porous solidified cake. Against this background, a short review on melt pool coolability tests have been included.
5.1
FORMATION OF PARTICLE BED
The fragmentation of core melt when falling-through a water pool have been studied experimentally in the 90ies. The information is critical to the assessment of particle bed coolability. The following simulant and real material fragmentation tests are reviewed to find a representative particle size distribution for real plant cases.
The most important melt jet fragmentation tests are the CCM, FARO and KROTOS tests with real corium materials. Simulant material tests can give valuable information about the physical phenomena, but the final quantification of fragmentation issues need should rely upon real corium material test results. From well-performed simulant material tests the MIRA tests from KTH have been selected for this review.
5.1.1 CCM Tests at Argonne National Laboratory
A total of six CCM tests were performed in COREXIT facility at Argonne National Laboratory in early 90ies [Spencer et al, 1994]. The purpose of the tests was to study ex-vessel melt jet fragmentation.
The applied core melt was a mixture of real reactor materials composed of 60 %UO2-16
% ZrO2-24 % SS. The debris was melted in a separate melt generation vessel to a
temperature ~ 2800 K, and then poured into the interaction vessel with water pool. The debris was melted using the exothermic chemical reaction
Pressure at the onset of corium injection [bar]
1.1 1.75 3.15 3.55 1.34 2.02
Maximum velocity of debris at the water surface [m/s]
3.39 5.30 8.15 8.73 2.58 5.57
The experiment CCM-1 studied the break-up of a small single-hole pour of debris into sub-cooled water. In CCM-2 test debris was poured through four small holes with the water temperature being near saturation. The test CCM-3 was similar to the test CCM-1 except that the debris mass was larger and the water was saturated. CCM-4 was a single-hole test with larger corium mass and larger hole diameter. Test CCM-5 was similar to CCM-1, except that the water pool diameter and thus the water volume was larger. This test was purposed to study the effects of the walls in the previous tests. The water was sub-cooled in CCM-5. The test CCM-6 was similar to CCM-5 except for the water temperature being near saturation.
The post test examinations of test CCM-1 revealed that the debris in the cavity vessel was in a form of loosely bound or sintered particles with the bed height of 15 –27 mm. The test vessel walls and the base were not attacked by corium. The bed porosity was estimated to be 53 %. Both oxidic and metallic particles had similar shape. All sizes and shapes were present, but the majority was spherical, hollow shells. The typical particle size was 3 mm, but some particles with diameter over 10 mm were found, too.
In CCM-2 test the debris bed had a large globule of metallic debris and small spherical particles. The particles were sintered together into large chunks with significant voids. The base of the test vessel showed no erosion. The debris bed height was relatively uniform, about 45 mm. The estimated porosity was 68 %.
In CCM-3 the debris resembled that of CCM-1, with the bed height being between 19 to 38 mm. Most of the particles were spherical and hollow. The agglomerated particles were also plentiful but fragile. The porosity of the debris bed was 65 %.
In CCM-4 the debris characteristics were similar to the previous tests. Also the porosity of the debris was 63 %.
In CCM-5 the particle bed had a rough surface with particles of various shapes and sizes. The particles were brittle, and many of them hollow. Some particles were sintered together. The porosity of a debris bed sample was determined to be 67 %. In the CCM-6 test the porosity of debris was 63 %.
The particle size distribution was determined by sieving and by a sonic sifter. For CCM-2 test the sieving was not possible because the interaction vessel base was largely agglomerated. Figure 18 shows the particle size distributions.
As general conclusions from the CCM tests it is reported [Spencer et al, 1994] that, the most important parameters affecting the fragmentation is the number of debris streams, their diameter in relation to the water pool depth and the water subcooling. The multi-jet discharge reduced the quench fraction significantly. The corium fall-stage quenching ratio ranged from 55 to 72 % with subcooled water. With saturated water the observed quench fraction was lower. The oxidation fraction of steel was estimated to be 2-35 %, with higher oxidation taking place in saturated water. Only in multi-jet experiment, substantial corium particle re-agglomeration was observed. No steam explosions occurred in any of the tests.
The average mean particle size of CCM tests is 2.7 mm. Thus examining of Figure 18 suggests that the particle size distribution of CCM-1 could be chosen roughly representative for Nordic BWR applications.
Figure 18. Particle size distribution in tests CCM-1 ... CCM-6. [Spencer et al., 1994].
5.1.2 KROTOS Tests at JRC ISPRA
The KROTOS facility was designed to study energetic fuel-coolant interactions [Huhtiniemi & Magallon, 1999]. The first set of tests employed aluminium oxide as melt. A spontaneously triggered, propagating explosion was achieved relatively easily in highly subcooled water pools. Explosions were obtained by using an external trigger in pools near saturation conditions. The fine and rapid fragmentation induced rapid and strong pressurisation. The conversion ratio of thermal energy to kinetic energy was estimated to be 1.5-2.5 % in the alumina tests.
Some KROTOS tests have also been performed with corium material. A total of 13 corium tests have been performed by the end of 1999. In most of the tests an external pressure shock was applied to trigger a propagating interaction between corium melt and water. The debris composition was 80 % UO2-20 % ZrO2 and the mass varied
between 2.4 and 5.1 kg. The water pool depth was about 1 m, and both subcooled and nearly saturated water pools were tested. In tests K-56 and K-58 about 4 kg of corium
was injected into about 1 m deep, highly subcooled water pool (290 K). Neither of the tests produced a spontaneous explosion. However, in test K-58 an external trigger was applied to induce an energetic interaction.
The temperature of the melt in tests K-56 and K-58 was 3077 K. The initial pressure in the facility was 3.7 bar, which corresponds well the anticipated containment pressure e.g. in Olkiluoto pedestal at the failure of the pressure vessel. The melt jet diameter was 3 cm. The melt/coolant mass ratio was 0.11. The velocity of the melt jet at the entrance of the water pool was high, 30 m/s.
The fragmentation was complete in both tests K-56 and K-58. In K-56 without explosion, the debris mean particle size was reported to be 1.4 mm [Huhtiniemi & Magallon, 1999]. In test K-58 with explosion the mean debris particle size was almost an order of magnitude smaller, 0.177-mm. One interesting result from the test K-58 was that the energy conversion ratio was noticeably smaller than in the alumina tests, i.e. 0.15 %.
Table 3. Particle size distribution in selected KROTOS steam explosion tests with external
triggering.
Particle size class [mm] Mass fraction of the class
K-53 K-58 K-63 0.0 – 0.02 5 % 8 % 2 % 0.02 – 0.045 5 % 15 % 8 % 0.045 – 0.1 11 % 18 % 16 % 0.1 – 0.25 15 % 15 % 17 % 0.25 – 0.5 12 % 15 % 16 % 0.5 – 1.0 22 % 18 % 15 % 1.0 – 2.0 24 % 10 % 20 % 2.0 – 4.0 6 % 1% %
5.1.3 FARO Tests at JRC ISPRA
FARO tests investigated corium jet break-up and coolability during fall-through of a water pool [Magallon et al. 1999]. Altogether 12 melt break-up tests were performed. The melt mass was 100-200 kg in most of the tests. The pressure of the test vessel was varied from primary system values 58 bar to containment conditions 2-5 bar. The tests were performed with real corium material comprising a mixture of 80 %UO2-20 %
ZrO2, which was melted in a separate furnace by direct electrical heating. The melt was
then poured into a release vessel, from where a well-controlled pour could be performed to the test vessel housing a water pool. The temperature of the melt at start of injection was about 3000 K. The particle size in FARO tests varied between 0.25 – 11 mm. The key characteristics of selected FARO tests are shown in Table 4. The tests L-24 ... L-33 were performed in low pressures typical for containment during severe accidents.
gradually fully closed due to crust formation L-31 2 92 5 3.3 – 3.5 2990 6.4 1.45 / 481 0.19 L-33 4 100 5 3070 11.5 1.60 / 625 0.16
A good mixing and significant melt break-up and quenching were observed. In high-pressure tests the addition of small amount of Zr (4 %) enhanced quenching and produced a totally fragmented debris bed. In test L-31 all debris formed particles, whereas little quenching was observed during fall-through in L-29. This suggests according to the experimentalists that the quenching process may be sensitive to the initial conditions.
In test L-27 the melt was poured by gravity at 5-bar pressure into a saturated water pool. The pressure maximum of 14.8 bar in the test vessel was reached in 3 s. The pressure remained above 10 bar during the rest of the measured test period. The maximum temperature increase of the test vessel bottom plate was 230 oC, measured at 13 s after the start of the melt pour. 76 % of the debris was fragmented and the rest formed coherent cake. Unfortunately, the particle size distribution was not determined from this test [Silverii & Magallon, 1999a]. The post-test examinations revealed that the debris had heaped into one sector of the test vessel floor. The height of the heap was 14-15 cm. In other parts of the test vessel floor the debris bed height was only 5-7 cm.
In test L-28 the melt was discharged by gravity at 5-bar pressure. The initial discharge hole diameter was 5 cm, but it gradually decreased to 4.4 cm due to crust formation in the hole. The pressure increased in the test vessel to about 17 bar, around which value it stayed the rest of the test duration. The temperature of the test vessel bottom plate reached its maximum at 8 s after the start of the melt pour. The maximum temperature increase was 531 oC. The debris bed geometry was heap-like, the height being 17 cm at the middle of the heap and reducing towards the periphery, being 5 cm close to the tests vessel walls. No other debris characterisation was available in the test data report [Silveree & Magallon, 1999b].
In test L-29 no loose particle debris was found, all debris was characterised as cake formed of agglomerated large particles. This was the only test where the initial discharge hole with diameter 5-cm was gradually totally blocked by melt before all melt had poured out of the discharge vessel. The debris bed height in the interaction vessel was 3-4 cm in the middle and 6-8 cm in the peripheral region. The maximum temperature increase of the bottom plate was 317 oC measured at 22 s after the start of the pour. The maximum pressure increase in the test section was 0.2 bar.
In test L-31 the gravity driven debris discharge occurred at 2-bar pressure. The initial discharge hole diameter was 5 cm, but it decreased to 4.6 cm due to crust growth. The height of the debris at the bottom of the water-interaction vessel was quite uniform, about 17 cm. All debris was fragmented. The particle size of debris was smaller on the top than on the bottom. The mean particle size, defined so that 50 % of the particles are smaller than the mean size, was on the top 3 mm, in the middle of the bed 3.4 mm and at the bottom 5.2 mm. The particles were not in general spherical. The maximum measured bottom plate temperature was 91 oC, reached at 22 s after the pour of the melt. No significant pressurisation of the test vessel took place; the maximum pressure increase was 0.46 bar. The long-term coolability data cannot be obtained from FARO experiments, since there was no simulation of decay heat in the particle bed. Figure 19 shows the measured particle size distributions in test L-31.
6.0 – 10 5 % 15 %
10.0 – 11.0 0 4.5 %
5.1.4 The Olkiluoto case
The total core melt mass in the Olkiluoto plant is estimated to be about 180 000 kg. If this melt were uniformly spread on the pedestal floor, a 37-cm deep melt pool, without voids, would be formed. However, if this amount of melt would form a rubble bed instead of a melt pool, having average porosity of 60 % measured in CCM-tests, the particle bed height would rise up to 62 cm. Even deeper particle beds can be envisioned in cases, where the rubble bed would form a heap rather than being spread uniformly. Based on PASULA calculations [Lindholm et al., 1997], the most likely failure mode of the Olkiluoto pressure vessel is an instrument tube penetration. The inner diameter of an instrument tube is 7.1 cm and there are a total of 50 instrument tube penetrations in the Olkiluoto pressure vessel lower head. The jet diameters of the FARO experiments coincide well with the Olkiluoto reactor case.
If the pedestal flooding is successfully carried out, about 518 m3 of water has drained into the pedestal prior to the discharge of core melt. The corresponding water pool height is 8.3 m and water mass 513 000 kg. The temperature of water in the pedestal sump is 319 K and the pressure in pedestal is 1.01 bar.
The ratio of corium mass vs. water mass in Olkiluoto plant is 0.38, which is close to that in FARO test L-28. The water in Olkiluoto pedestal is sub-cooled by 56 degrees. The pool heat sink (before the pool starts to boil) is enough to quench about 57 % of the whole corium mass, if energy is entirely used for heating of the pool. However, noticeable fragmentation took place in FARO and CCM experiments also with saturated water.
An estimation for the debris discharge velocity in Olkiluoto plant can be made as follows. The initial pressure in the RPV is assumed 3-10 bar. The initial velocity of debris at the opening of an instrument tube nozzle can be evaluated from the formula
0.99 t coefficien discharge is C kg/m 8800 corium of density the is Pa 10 9 -2 head lower RPV the across difference pressure is p where , 2 3 5 0 = = ⋅ = ∆ ∆ ⋅ ⋅ =C p v ρ ρ (26)
By applying the numerical values in the formula (26), we get for initial velocity 6.7 – 14.2 m/s. If the instrument tube nozzle ablation is ignored (∅tube = 0.071 m) and the
average corium density of 8800 kg/m3 is assumed, the estimated mass flow rate through one penetration will be 233-495 kg/s. According to the model developed by Pilch [Summers et al, 1994] the area of the instrument tube penetration in lower head of Olkiluoto pressure vessel would grow to ten times the initial area in 13 s. Taking this growth into account, the debris discharge rate would be 2334 – 4947 kg/s. The average discharge rate during the first 13 s of the pour would be 1283 –2721 kg/s. With the discharge rate of 2721 kg/s the pool would be saturated in 28 s. After a 28 s pour of the melt, the debris/water ratio would be 0.15, which is rather close to that in the KROTOS (0.11) and the FARO experiments L-31 and 33 (0.16 and 0.19).
The final velocity of debris at the water surface of the pedestal pool is obtained from s g v vf = + ⋅ ⋅ 2 1 0 (27)
where g is acceleration of gravity = 9.81 m/s2 and s is the distance from the RPV bottom to the pedestal pool surface = 12.7 m. The substitution of numerical values gives for the debris velocity at the surface of the pedestal pool the value 15 - 22 m/s. This is at least twice the velocities applied in the available tests. It is possible that debris will disperse to some extent already when hitting the pool surface with this high velocity.
The values of the key parameters that have been observed to affect most the melt fragmentation history are gathered in Table 6. The particle size distribution varies significantly in different tests as learned in the previous sections. However, the general trend is that median particle size is generally a few millimetres, with a relatively small fraction of small particles (less than 1 mm in diameter). In order to discriminate between the measured results the reviewer has first started with the fact that corium tests are closer to Olkiluoto case than any of the simulant tests. Furthermore, corium release with a significant metal fraction can be expected in Olkiluoto making CCM and CWTI tests interesting. On the other hand, water temperature has been observed to be an important factor for particle sizes and overall fragmentation. The water in the pedestal of Olkiluoto is subcooled in the beginning of debris discharge, but becomes rather soon saturated. Both subcooled and saturated pools need to be addressed for Olkiluoto case. Jet diameter and pool depth/water mass is often reported to have an effect on overall
Test P [bar] Twater [oC] jet diameter [mm] debris/ coolant mass ratio velocity at water surface [m/s] comments Spencer, Gabor & Cassulo
1.013 25 or 100 N/A 0.08 N/A simulant
ALPHA 1.013 50 30 3.5 simulant metal mixture EJET-tests 1.013 30 or 88 38, 76 or 163 0.08 – 0.1 simulant Fe-Al2O3 MIRA-20, 21, 22 tests 1.013 25, 50, 75 or 95 25 0.07 3 or 6 simulant binary oxide CWTI-9 and CWTI-10 1.413 1.813 94 25 22 25.4 0.23 0.12 3.17 4.09 corium (oxide + 24 % metal) CCM-1 CCM-2 CCM-3 CCM-4 CCM-5 CCM-6 1.1 1.75 3.13 3.55 1.34 2.02 57 99 100 63 55 101 25.4 20 25.4 50.8 50.8 50.8 0.06 0.51 0.09 0.24 0.022 0.025 3.4 5.3 8.2 8.7 2.6 5.6 corium (oxide+24 % metal) FARO L-24 L-27 L-28 L-29 L-31 L-33 5 5 5 2 2 4 152 151 151 4 18 20 10 10 5 5 5 5 0.25 0.24 0.33 0.08 0.19 0.16 11.2 10.8 11.0 6.4 6.4 11.5 corium oxide KROTOS K-56 K-58 3.73.7 1818 3030 0.110.11 3030 corium oxide Olkiluoto reactor 3-10 50-100 71-213 0.16 13-23 oxide + metal
In consideration of these aspects, 6 tests were selected for closer analysis to find a representative particle size distribution for Olkiluoto case (Table 7). The effect of small-mass steam explosions has to be considered as a separate sensitivity case, with extra layer of fine particles, in the planned dryout heat flux tests.
Table 7. Comparison of experimental particle size distributions that are considered
representative for Nordic BWR applications.
Mass fraction of particle size class [w-%] Particle size class [mm] L-24(1 L-31(2 CCM-1(3 CCM-3(4 CCM-5(5 MIRA-20(6 <0.25 2 0.7 12.3 6.5 1.4 0.25-0.35 1 0.8 6.2 3.2 1.4 0.35-0.5 2 1 6.3 3.2 3.5 0.5-0.7 3 3 8.6 6.5 4.9 0.7-1.0 4 3 7.5 6.6 2.9 3 1.0-2.0 20 18 18.5 18 21.1 12 2.0-4.0 48 43 16.0 23 28.2 45 4.0-6.0 15 11 12.3 16 18.3 29 6.0-10 5 15 12.3 17 18.3 11 10-11 4.5
(1 suitable system pressure and jet velocity, saturated water pool, corium test
(2 slightly low system pressure and jet velocity, subcooled water, applicable
debris/coolant ratio, corium test
(3 subcooled water, low pressure and jet velocity, corium contains also metals (4 saturated water, applicable pressure and jet velocity, low debris/coolant mass ratio (5 subcooled water, low pressure and jet velocity, larger scale than in CCM-1
(6 representative simulant test, representative water subcooling, jet velocity and debris
density.
Based on the selected data the average particle size distribution in Table 8 and Fig. 20 is obtained and recommended for use in the future dryout heat flux experiments. The test CCM-1 results for finer particles have been omitted due to the large discrepancy between CCM-1 and CCM-5 results (similar conditions) and due to the fact that the shape of the particle size distribution at the small particle end was different from that of all other CCM-tests.
Table 8. Recommended base particle size distribution for Olkiluoto applications based on
available experimental data.
Particle size [mm] Mass fraction [w-%]
0.25-0.5 6 0.5 –1.0 8 1.0 – 2.0 20 2.0 – 4.0 35 4.0 – 6.0 15 6.0 – 10.0 16
Figure 20. Particle size distributions in selected tests and the distribution recommeded for further studies.
The uncertainties related to the fraction of fine particles can be addressed by looking into KROTOS test data. The tests with an external trigger and explosive behaviour resulted in mean particle sizes 0.6 mm (K-53), 0.2 mm (K-58) and 0.4 mm (K-63). Thus the particle sizes were about an order of magnitude smaller than in the ‘base particle distribution’. However, it was reported [Huhtiniemi & Magallon, 1999] that in one test K-56 without external trigger, the mass mean particle size was 1.7 mm. This is rather close to the mean particle size of the test CCM-1 (2.3 mm). The investigation of test CCM-1 suggests that the fraction of fine particles could be 40 % of the total mass with a rough distribution of 12 % less than 0.25 mm, 12 % between 0.25 and 0.5 mm and 16 % between 0.5 and 1 mm.
If 50 % of the zirconium inventory of the core is oxidised, the core melt at the bottom head contains about 25 % metals (Zr + steel) and 75 % oxides (UO2+ ZrO2). If one
assumes a rapid lower head failure following the corium arrival to the lower head, only the steel component is in liquid form according to MELCOR calculations. The total molten material mass from Olkiluoto lower head during the first seconds would be 153-330 kg of metal. If this amount of steel material were fragmented into fine particles and spread on the pedestal floor, the resulting layer thickness would be 0.3-0.7 mm. With average discharge rate 2721 kg/s a total of 76 200 kg of melt would be discharged during 28 s. If 25 % of this is metallic, which is assumed to fragment into fine particles, the mass of fine fragments would be 19 050 kg. By taking into account that with 50 % Zr oxidation about 36 % of the metallic melt is Zr and 64 % of steel, the average density of the metallic melt is 7332 kg/m3. Thus the total volume of the dispersed metallic melt is 2.6 m3. When spreading uniformly over the whole floor area of 64 m2, the upper bound layer thickness of the fine fragments would be 4.1 cm of solid debris. If one assumes that the porosity of the debris bed is 60 %, the fine particle bed thickness
0 2 0
0 5 1 0 1 5
S iz e (m m )
![Figure 2. Comparison of dryout heat flux predictions with data [Schrock et al., 1986].](https://thumb-eu.123doks.com/thumbv2/5dokorg/3349370.18987/18.892.194.649.287.746/figure-comparison-dryout-heat-flux-predictions-data-schrock.webp)
![Figure 9. DCC-1 dryout heat flux vs. pressure [Reed et al, 1986].](https://thumb-eu.123doks.com/thumbv2/5dokorg/3349370.18987/23.892.223.547.155.534/figure-dcc-dryout-heat-flux-vs-pressure-reed.webp)
![Figure 11. Dryout heat fluxes measured in the SILFIDE tests [Décossin, 1999].](https://thumb-eu.123doks.com/thumbv2/5dokorg/3349370.18987/26.892.188.699.151.845/figure-dryout-heat-fluxes-measured-silfide-tests-décossin.webp)
![Figure 12. DCC-3 experiment overall set-up by Boldt et al [Boldt et al., 1986].](https://thumb-eu.123doks.com/thumbv2/5dokorg/3349370.18987/30.892.209.591.548.953/figure-dcc-experiment-overall-set-boldt-et-boldt.webp)
![Figure 14. Quench of extended dryout [Boldt et al., 1986].](https://thumb-eu.123doks.com/thumbv2/5dokorg/3349370.18987/32.892.131.691.151.519/figure-quench-extended-dryout-boldt-et-al.webp)
