Research
Report number: 2013:24 ISSN: 2000-0456
Modelling of nuclear fuel
cladding under loss-of-coolant
accident conditions
2013:24
Authors: Tero Manngård Ali R. Massih
Abstract
We present a unified model for calculation of zirconium alloy fuel cladding rupture during a postulated loss-of-coolant accident in light water reactors. The model treats the Zr alloy solid-to-solid phase transformation kinetics, cladding creep deformation, oxidation and rupture as a function of tem-perature and time in an integrated fashion during the transient. The fuel cladding material considered here is Zircaloy-4, for which material property data(model parameters) are taken from literature. We have modelled and simulated single-rod transient burst tests in which the rod internal pressure and the heating rate were kept constant during each test. The results are compared with experimental data on cladding rupture strain, temperature and pressure. The effects of heating rate and rod internal pressure on the rupture strain are evaluated by systematic parameter variations of these quantities. The principal uncertainty in our simulations is the treatment of creep deformation in the twophase (a + b) region of the considered alloy, for which no definite constitutive relation is yet available.
Project information
SSM:s contact is Jan In de Betou SSM reference: 2008-139
Sammanfattning
Vi presenterar en integrerad modell för beräkning av brott i zirkoniumbase-rad bränslekapsling under postulerat härdhaveri orsakad av kylmedelsförlust (LOCA, loss-of-coolant ac- cident) i lättvattenreaktorer. Modellen behandlar tidsberoendet (kinetiken) hos zirkonium- legeringars fasomvandling i fast tillstånd, kapslingskrypning, oxidering och brott som funk- tion av tid på ett enhetligt sätt under transienten. Bränslekapslingen som beaktas här är Zircaloy-4, för vilken materialegenskaper (modellparametrar) hämtas från öppen litteratur. Vi har modellerat och simulerat enstavs transienta brott-prov i vilka det inre stavtrycket och värmningshastigheten hölls konstanta under varje test. Resultaten jämförs med ex- perimentella data för brottöj-ning, brottemperatur och inre stavtryck. Inverkan av värmn- ingshastighet och inre stavtryck på brottöjning utvärderas genom systematiska variationer hos dessa parametrar. Den huvudsakliga osäkerheten i våra simuleringar är behandligen av krypdeformation i tvåfas (a + b) området hos aktuellt kaps-lingsmaterial, för vilket det inte finns något definitivt kosntitutivt samband tillgängligt.
2013:24
Authors:Date: July 2013
Report number: 2013:24 ISSN: 2000-0456
Tero Manngård and Ali R. Massih
Quantum Technologies AB, Uppsala, Sweden
Modelling of nuclear fuel
cladding under loss-of-coolant
accident conditions
This report concerns a study which has been conducted for the Swedish Radiation Safety Authority, SSM. The conclusions and view-points presented in the report are those of the author/authors and do not necessarily coincide with those of the SSM.
1 2
Contents
1 Introduction 2 Governing equations 3 Computations 53.1 Temperature history evaluations . . . 5 3.2 Comparison with experimental burst data . . . 8 3.3 Parametric study . . . 12
4 Discussion 15
5 Conclusion 20
1 Introduction
In a postulated loss-of-coolant accident (LOCA) in light-water reactors (LWRs), zirconium alloy fuel claddings are subjected to high temperatures (700 − 1500 K) and internal pres-sures. These can cause excessive deformation (ballooning) which eventually may lead to rupture of cladding following the accident. The cladding tube hoop (tangential) strain at failure determines whether rod-to-rod contact would occur in a fuel assembly. Moreover, it would decide the degree of coolant blockage in the refilling and flooding phase of LOCA (Parsons, Hindle, and Mann 1986; Pettersson 2009).
In the LOCA safety analysis (required for the licensing of reactor fuel system) a failure cri-terion model is needed to predict the temperature and time at which cladding ruptures, and also the total hoop strain at, or close to, the location of rupture. The physical be-haviour of cladding during the accident is governed by phase transformation, oxidation, creep deformation and rupture of zirconium alloy within a time scale of about 120 s. The objective of this note is to delineate a unified generic computational method to ac-count for these phenomena based on empirically attained material property data reported in the literature. We synthesise the previously described kinetics of zirconium alloy phase transformation (Massih 2009b) with the equations for cladding creep, oxidation and burst (Erbacher, Neitzel, Rosinger, Schmidt, and Wiehr 1982; Rosinger 1984) to calculate the rupture time/temperature during a transient.
In our study, we evaluate the behaviour of Zircaloy-4 fuel cladding tube with nominal chem-ical composition: Zr-base, 1.5Sn-0.2Fe-0.1Cr-0.12O by wt%. Zirconium alloys in solid state undergo a phase transformation from the low temperature hexagonal closed-packed (hcp) α-phase to body-centred cubic (bcc) β-phase (Lemaignan and Motta 1994). Solid state phase equilibria of Zircaloy-4 has been investigated experimentally by Miquet et al. (Miquet, Charquet, and Allibert 1982), who reported a prevalence of four phase domains: (α + χ) up to 1081 K, (α + β + χ) from 1081 to 1118 K, (α + β) between 1118 and 1281 K, and β-phase above 1281 K. Here, χ refers to the intermetallic hexagonal Laves phase Zr(Fe,Cr)2, see e.g. (Bangaru, Busch, and Schemel 1987). A short survey of liter-ature on zirconium alloy phase transformation behaviour was presented in our preceding paper (Massih 2009b).
Similar past modelling approaches comprise the works of (Erbacher, Neitzel, Rosinger, Schmidt, and Wiehr 1982; Rosinger 1984), which however, did not include phase trans-formation kinetics model. More recent modelling efforts are the works of Forgeron et al. (2000) and Brachet et al. (2002) and the implementation of such models in a fuel perfor-mance code (VanUffelen, Gy˝ori, Schubert, van de Laar, Hózer, and Spykman 2008). Al-though our general modelling approach is similar to that presented in (Forgeron, Brachet, Barcelo, Castaing, Hivroz, Mardon, and Bernaudat 2000; Brachet, Portier, and Forgeron 2002), our basic equations for phase transformation kinetics, combined creep and oxidation equations and mechanical equilibrium are different. In addition, we provide the numerical details of our computations, which have impact on the results, and are usually lacking in open literature.
The organisation of this report is as follows. Section 2 presents the model and the basic equations used for phase transformation, creep, oxidation and cladding burst. Sample
com-putations, simulating transient single-rod burst experiment in which the heating rate and rod pressure were kept constant in each test, are presented in section 3. Section 3 also in-cludes comparisons between model computations and experimental data, plus parametric studies using the integrated model. In section 4, we discuss the limitations and applicability of the sub-models utilised and section 5 concludes the report.
2 Governing equations
The present method considers a set of three differential equations for describing the kinetics of phase transformation, the creep deformation and oxidation of zirconium alloys. The latter two equations are numerically solved simultaneously, while the solutions of the phase transformation equations provide input to the creep rate equation and the cladding burst stress-temperature relation in the two-phase (α + β) region of the Zr alloy.
The phase transformation model has been detailed in our preceding articles (Massih and Jernkvist 2009; Massih 2009b). It expresses the rate of the transformed volume fraction (y) according to dy dt = ys(T ) − y τc(T ) , (1)
where ys(T ) is the equilibrium value y at temperature T and τc(T ) is the characteristic time
of phase transformation. The expressions for ys is given as (Massih 2009b) ys = 1 2 h 1 + tanh³T − Tcent Tspan ´i , (2)
where Tcentand Tspanare material specific parameters related to the centre and the span of
the mixed-phase temperature region, respectively. For Zircaloy-4, we use Tcent = 1159 K
and Tspan= 44 K. The expression for τcis given in (Massih 2009b) for Zircaloy-4.
The steady-state creep strain rate of Zr alloy cladding in single-phase (α domain or β domain) is expressed by a Norton law (Erbacher, Neitzel, Rosinger, Schmidt, and Wiehr 1982; Rosinger 1984)
dεθ
dt = Aθf (x) exp(−Q/RT )σ
n
θ, (3)
or alternatively by a Harper-Dorn law (Kaddour, Frechinet, Gourgues, Brachet, Portier, and Pineau 2004) in the form
dεθ dt = Aθ T f (x) exp(−Q/RT )σ n θ, (4)
where εθand σθare the hoop (tangential) strain and stress of the cladding tube, respectively, Aθ the strength coefficient, Q the activation energy, R the gas constant, T the absolute
temperature, n the stress exponent, and f (x) accounts for the effect of oxygen concentration
x, written in the form (Burton, Donaldson, and Reynolds 1979)
f (x) ≡ exp[B(x)]. (5)
The creep strength coefficient Aθ, as in (Rosinger 1984), is calculated from Aθ = h1 4(F + G) + H i(n−1)/2 (H + 1 2F )(F + G) −(n+1)/2A z, (6)
where the Hill anisotropic factors F, G and H (Hill 1948) are used in the α-phase and isotropic values of F = G = H = 0.5 are used for the (α + β)- and β-phase domains. For the anisotropic α-Zr alloy, we assume F = 0.956, G = 0.304 and H = 0.240 (Erbacher, Neitzel, Rosinger, Schmidt, and Wiehr 1982). We should note that the effect of oxygen concentration x is not included in equations (1) and (2) for the phase transformation. All the parameters appearing in equations (3) and (4) are described in tables 1 and 2 for Zircaloy-4, respectively. The strength coefficient Aθ for the Zr alloy is calculated from the
corresponding uniaxial value Az through the anisotropic factors by Hill’s relation (Neitzel
and Rosinger 1980; Erbacher, Neitzel, Rosinger, Schmidt, and Wiehr 1982; Rosinger 1984). For the oxygen-dependent term, equation (5), we use Burton et al.’s empirical relation
B(x) = −342x (Burton, Donaldson, and Reynolds 1979), where x ≤ 0.015 is the
oxy-gen weight fraction in the α-phase of zirconium alloy. The effect of oxyoxy-gen on creep in
β-phase is neglected (Burton, Donaldson, and Reynolds 1979; Sagat, Sills, and Walsworth
1984).
For symmetrical deformations, the hoop stress (σθ) in a slender tube (cladding) under a
differential pressure ∆p can be related to the hoop strain as (Matthews 1984; Shewfelt 1988)
σθ = σ0exp(2βεθ), (7)
where σ0 = ∆p r0/w0, and r0and w0are the initial cladding mid radius and wall thickness, respectively. In addition, β = 1 + λ/2, λ = (G − F )/(F + 2H). When there are end restraints on the tube, β = 1. Thus, using equation (7), we write equation (3) as
dεθ
dt = Aθf (x) exp(−Q/RT )σ
n
0 exp(2nβεθ), (8)
Assuming that oxygen will uniformly get distributed in the cladding, the oxidation rate of Zr alloy follows a parabolic law
dx dt = 1 2xη 2, (9) η = 0.724 exp(−10481/T )1 + εθ w0ρ , (10)
where ρ is the Zr alloy density ρ = 6.56 g cm−3; and equation (10) was found from
exper-iments made under the assumption of isothermal steam oxidation of Zircaloy-4 cladding material within a temperature range of 973 to 1573 K and an exposure time of ≤ 15 min-utes (Erbacher, Neitzel, Rosinger, Schmidt, and Wiehr 1982).
Finally, we use the relation for the rupture (burst) stress vs. temperature T and oxygen concentration x in the form (Erbacher, Neitzel, Rosinger, Schmidt, and Wiehr 1982)
σB = a exp(−bT )g(x), (11)
where a and b are material dependent constants (table 3) obtained experimentally and
g(x) = exph−³ x − x0
0.00095 ´2i
. (12)
Here, x0 = 0.0012 is the as-fabricated oxygen weight fraction of the Zr alloy (Erbacher, Neitzel, Rosinger, Schmidt, and Wiehr 1982; Rosinger 1984). Cladding rupture occurs when σθ = σB.
The strain rate in the mixed (α + β)-phase region follows a separate mechanism than in the single phase region (Nuttall 1976; Rosinger, Bera, and Clendening 1979). For compu-tational convenience some authors have suggested ad-hoc correlations in the mixed-phase region for Zircaloy-4 (Erbacher, Neitzel, Rosinger, Schmidt, and Wiehr 1982; Rosinger 1984) or have considered homogenisation according to (Pirogov, Alymov, and Artyukhina 1989; VanUffelen, Gy˝ori, Schubert, van de Laar, Hózer, and Spykman 2008)
˙εαβ = ˙εα(1 − y) + ˙εβy , (13)
or alternatively
˙εαβ = ˙ε1−yα · ˙εyβ, (14)
where over-dot denotes time derivative, subscripts α and β the respective phases, and y the volume fraction of the β-phase calculated from equation (1). Similarly, the rupture stress in the (α + β)-phase region is calculated using an ad-hoc correlation (Erbacher, Neitzel, Rosinger, Schmidt, and Wiehr 1982) or employing a mixing rule of the form (Forgeron, Brachet, Barcelo, Castaing, Hivroz, Mardon, and Bernaudat 2000)
σαβ = σα1−y· σyβ. (15)
Table 1: Creep law parameters for Zircaloy-4 (Rosinger 1984), cf. Eq. (3).
Parameter Unit α-phase β-phase (α + β)∗
Az MPa−ns−1 19400 7.9 0.24
n - 5.89 3.78 2.33
Aθ MPa−ns−1 1489 3.97 0.15
Q/R K 38487 17079 12316
* Valid for strain rates ≤ 0.003 s−1, otherwise linear interpolation of parameters between α and β phases are used.
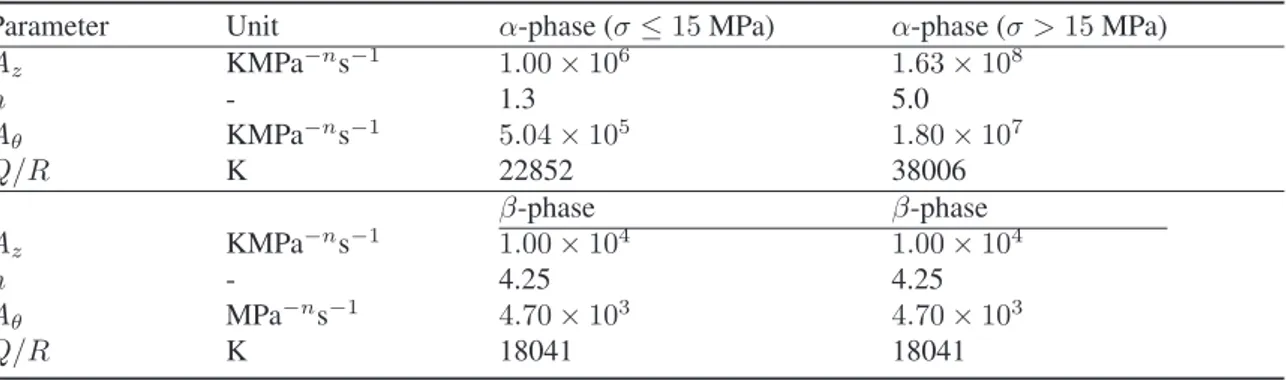
Table 2: Creep law parameters for Zircaloy-4 alloy (Kaddour, Frechinet, Gourgues,
Bra-chet, Portier, and Pineau 2004), cf. Eq. (4).
Parameter Unit α-phase (σ ≤ 15 MPa) α-phase (σ > 15 MPa)
Az KMPa−ns−1 1.00 × 10⁶ 1.63 × 10⁸ n - 1.3 5.0 Aθ KMPa−ns−1 5.04 × 10⁵ 1.80 × 10⁷ Q/R K 22852 38006 β-phase β-phase Az KMPa−ns−1 1.00 × 10⁴ 1.00 × 10⁴ n - 4.25 4.25 Aθ MPa−ns−1 4.70 × 10³ 4.70 × 10³ Q/R K 18041 18041
Table 3: Material dependent parameters in the burst stress vs. temperature, Eq. (11) for
Zircaloy-4 cladding tube (Erbacher, Neitzel, Rosinger, Schmidt, and Wiehr 1982).
Parameter Unit α-phase β-phase (α + β)
a MPa 830 2300 3000 at Tαβ
b K−1 0.001 0.003 0.003 at T
αβ
For Zircaloy-4 according to (Erbacher, Neitzel, Rosinger, Schmidt, and Wiehr 1982) the boundary tempera-tures are: Tα= 1085.15 + 14.28(q)0.28(K) with q heating rate (Ks−1); Tβ= 1248.15 (K); mid temperature of the (α + β)-phase Tαβ = (Tα+ Tβ)/2. Linear interpolation of ln a and b in the (α + β)-phase between the temperatures Tα, Tαβand Tβ.
3 Computations
3.1 Temperature history evaluations
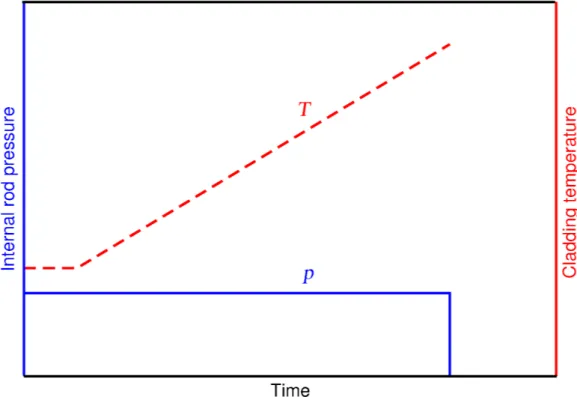
Let us now, using the integrated model outlined in section 2, calculate a sample case from single-rod transient burst tests, which were conducted within the REBEKA program using fuel rod simulators with indirect electric heating (Erbacher, Neitzel, Rosinger, Schmidt, and Wiehr 1982). In these tests to achieve well-defined experimental boundary conditions, the internal over-pressure and the heating rate were kept constant during the deformation process. Figure 1 illustrates schematically the test procedure. The test parameters, rod over-pressure and heating rate, were in the range of 1 to 14 MPa and 1 to 30 Ks−1, respectively.
The cladding tubes used were made of Zircaloy-4 with inner and outer diameters of 9.30 mm and 10.75 mm, respectively (Erbacher, Neitzel, Rosinger, Schmidt, and Wiehr 1982).
Figure 1: Schematic of the conditions of transient single-rod burst tests performed by
In our sample computations, we use a heating rate of 10 Ks−1 and assume a rod internal
over-pressures of ∆p = 1 MPa and ∆p = 8 MPa with restrained ends (β = 1). Zircaloy-4 cladding with the property data presented in table 1 and in ref. (Massih 2009b). The initial cladding mid radius and wall thickness used in equation (7) are r0 = 5.0125 mm and
w0 = 0.725 mm, respectively.
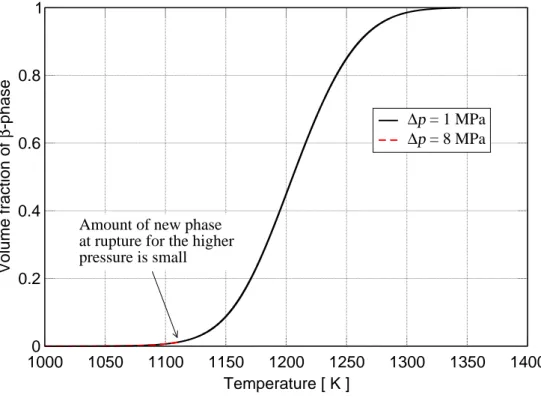
We have implemented the aforementioned governing equations and material property data in a computer program for calculating Zircaloy-4 phase transformation, cladding creep, oxidation and burst as a function of time and temperature in tandem. We solve equation (1) for a given temperature time-history using the Runge-Kutta algorithm of order 4 and 5 (Press, Teukolsky, Vetterling, and Flannery 1992) with the initial condition y(0) = 0 and
T (0) = 900 K. The results, the fraction of β-phase transformed as a function of temperature
for the alloy, are presented in figure 2.
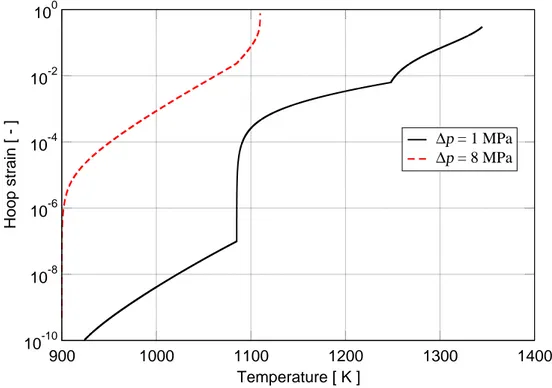
The cladding creep and oxidation equations (8) and (9) are solved simultaneously by the same kind of Runge-Kutta algorithm (extended to a system of differential equations) with the initial conditions εθ(0) = 0 and x(0) = 0.0012. In the computations presented here,
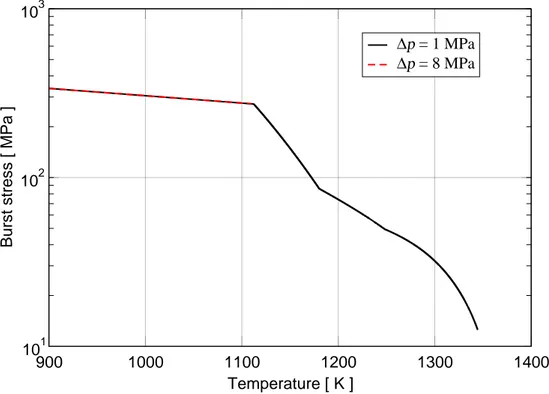
we have employed equation (3) and table 1 for the creep rate. For the burst stress, equation (11) and table 3 were used. That is, the mixing rules given by relations (13)-(15) in the two-phase (α+β) domain for the creep rate and burst, respectively, were not utilised. The results are depicted in figures 3 and 4 as a function of temperature up to the cladding failure time. The cladding burst stress versus temperature is plotted in figure 5. The calculated time, temperature and hoop strain at the onset of cladding rupture are 44.5 s, 1345 K and 29.8% for ∆p = 1 MPa; and 21 s, 1110 K and 77.3% for ∆p = 8 MPa, respectively. The time step in computations was ∆t = 0.1 ms.
1000 1050 1100 1150 1200 1250 1300 1350 1400 Temperature [ K ] 0 0.2 0.4 0.6 0.8 1 Volume fraction of β -phase ∆p = 1 MPa ∆p = 8 MPa
Amount of new phase at rupture for the higher pressure is small
Figure 2: Volume fraction of β-phase as a function of temperature at a heating rate of 10
900 1000 1100 1200 1300 1400 Temperature [ K ] 10-10 10-8 10-6 10-4 10-2 100 Hoop strain [ - ] ∆p = 1 MPa ∆p = 8 MPa
Figure 3: Cladding hoop strain due to creep deformations versus temperature during the
transient at a heating rate of 10 Ks−1for rod internal over-pressures of 1 and 8 MPa.
900 1000 1100 1200 1300 1400 Temperature [ K ] 0.1 0.12 0.14 0.16 0.18 0.2 0.22 0.24 Oxygen content [ wt% ] ∆p = 1 MPa ∆p = 8 MPa
Figure 4: Cladding oxygen weight concentration versus temperature during the transient
900 1000 1100 1200 1300 1400 Temperature [ K ]
101 102 103
Burst stress [ MPa ]
∆p = 1 MPa ∆p = 8 MPa
Figure 5: Variation of burst stress with temperature during the transient at a heating rate
of 10 Ks−1for rod internal over-pressures of 1 and 8 MPa.
3.2 Comparison with experimental burst data
In this section, we compare the results of computations with a number of cladding tube rupture experiments performed under pressurised water reactor LOCA conditions. The ex-periments considered are reported in (Erbacher, Neitzel, and Wiehr 1979; Erbacher, Neitzel, Rosinger, Schmidt, and Wiehr 1982; Karb, Sepold, Hofmann, Petersen, Schanz, and Zim-mermann 1982; Erbacher and Leistikow 1987).
As mentioned in the previous subsection, single-rod burst tests in steam were performed within the REBEKA program using fuel rod simulators with indirect electric heating and 325-mm heated length. The rod simulator comprised Al2O3 pellets (instead of UO2 fuel pellets) clad with Zircaloy-4 tubing (Erbacher, Neitzel, and Wiehr 1979; Erbacher, Neitzel, Rosinger, Schmidt, and Wiehr 1982). The temperature history of the cladding during the test was measured by thermocouples spot-welded on the outer surface of the cladding. The deformation of cladding as a function of time was recorded by X-ray cinematography by using a high-speed camera, which allowed the observation of cladding ballooning process during the test. Data on burst temperature, burst pressure and burst strain are presented in (Erbacher, Neitzel, Rosinger, Schmidt, and Wiehr 1982). The heating rate in these tests ranged from 0.8 to 35 Ks−1.
In the Karb et al. (1982) experiments, the main objective was to investigate the possi-ble influence of nuclear environment on fuel cladding failure mechanisms, see also (Karb, Prüßmann, Sepold, Hofmann, and Schanz 1983). In these experiments both unirradiated and pre-irradiated PWR-type tests fuel rods (with Zircaloy-4 cladding tube with inner and outer diameters of 9.30 mm and 10.75 mm, respectively) were subjected to temperature
transients simulating the second heat up phase of a LOCA. Nuclear environment was pri-marily characterised by the heat generated in UO2 fuel and the heat transfer from the fuel to the cladding outer surface in the FR2 reactor at Karlsruhe, Germany. In addition, 8 refer-ence samples with electrically rod simulators with Al2O3 pellets were tested in the in-pile loop under conditions identical with those of the nuclear tests (Karb, Sepold, Hofmann, Petersen, Schanz, and Zimmermann 1982).
In these tests, the burst data (temperature at rupture, rupture pressure and rupture strain) of the nuclear fuel rods did not indicate differences from the results obtained from electrically heated fuel rod simulators, and nor did they show the effect of irradiation exposure (up to 35 MWd/kgU). In our study, we only consider the unirradiated rods and the electrically heated fuel rod simulators by prescribing temperature histories to the cladding and evaluate the burst behaviour with the aforementioned model (section 2). The heating rate of the unirradiated rods varied between 7 to 19 Ks−1, whereas that of the electrically heated rod
simulators had heating rates of 12-13 Ks−1.
Erbacher & Leistikow (1987) have presented Zircaloy-4 burst data obtained from multi-rod burst tests performed within the REBEKA program. The data represent tests that had the potential for maximum ballooning, i.e. burst taking place in the α-phase of Zircaloy around 800◦C. The heating rate during heat-up in the tests was 7 Ks−1. The burst pressures in the
test were between 5 and 7 MPa and the measured hoop strains ranged from 0.28 to 0.55. Moreover, the circumferential temperature variation in the tests varied between 20 and 70 K. For further details on the burst data, see (Erbacher and Leistikow 1987).
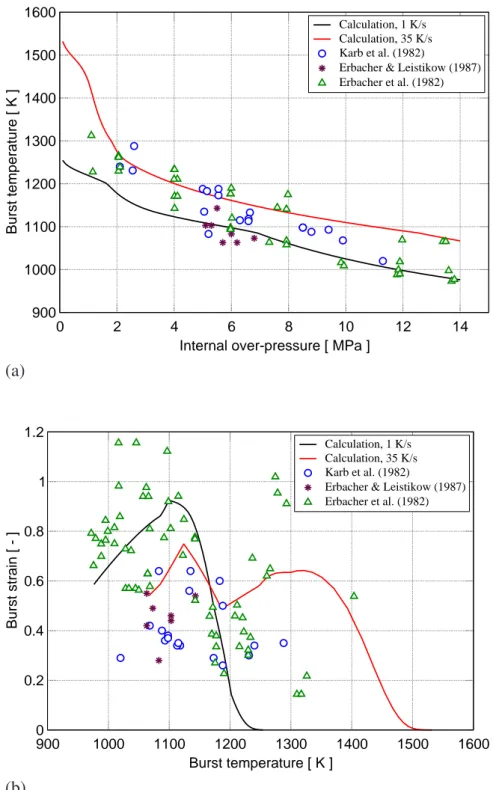
Cladding burst computations, for comparison with experimental results, are carried out by varying the constant internal over-pressure in the range from 0.1 to 14 MPa (in steps of 0.1 MPa) at two different constant heating rates, 1 and 35 Ks−1. The same model assumptions
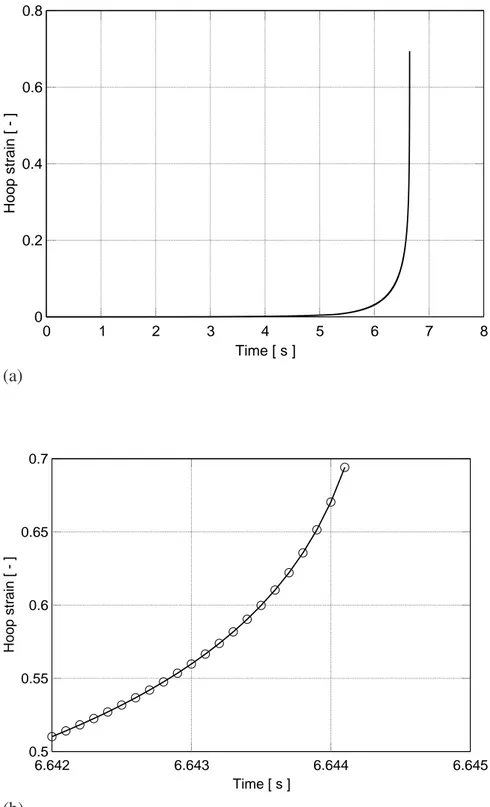
as in the foregoing subsection are made. The resulting cladding burst curves, calculated in this way, i.e. (i) burst temperature versus internal over-pressure and (ii) cladding hoop burst strain versus burst temperature, together with burst test data (Erbacher, Neitzel, Rosinger, Schmidt, and Wiehr 1982; Karb, Sepold, Hofmann, Petersen, Schanz, and Zimmermann 1982; Erbacher and Leistikow 1987) are plotted in figures 6a and 6b, respectively. Figure 7a depicts the calculated hoop strain versus time for a load combination of internal over-pressure/heating rate of 8 MPa/35 Ks−1. This calculation represents one point on the burst
curves for 35 Ks−1 shown in figures 6a-6b. The final (maximum) calculated hoop strain
value is calculated at ≈ 6.6 s amounts to ≈ 0.694. The burst hoop strain, calculated from the burst correlation, at this instant in time is ≈ 0.718. Figure 7b shows that the strain increases by about 2.5% in the last 0.1 ms time step.
It has been noted by Erbacher & Leistikow (1987) that in single-rod experiments in the α-phase and (α + β) domain of Zircaloy-4 tube there is a direct relationship between the hoop burst strain and the azimuthal temperature difference around the circumference of cladding tube. Small azimuthal temperature gradients (few degrees) cause a relatively homogeneous decrease of cladding wall thickness around its circumference, therefore leading to relatively large burst strains. On the other hand, large azimuthal temperature gradients, which may occur during the course of deformation lead to a localised reduction in wall thickness on the hotter part of the cladding tube circumference, thus resulting in small burst strains. As such, the magnitude of the azimuthal temperature gradient around tube’s circumference is an important factor affecting cladding burst strain.
0 2 4 6 8 10 12 14 Internal over-pressure [ MPa ]
900 1000 1100 1200 1300 1400 1500 1600 Burst temperature [ K ] Calculation, 1 K/s Calculation, 35 K/s Karb et al. (1982)
Erbacher & Leistikow (1987) Erbacher et al. (1982) (a) 900 1000 1100 1200 1300 1400 1500 1600 Burst temperature [ K ] 0 0.2 0.4 0.6 0.8 1 1.2 Burst strain [ - ] Calculation, 1 K/s Calculation, 35 K/s Karb et al. (1982)
Erbacher & Leistikow (1987) Erbacher et al. (1982)
(b)
Figure 6: Calculated burst curves for Zircaloy-4 cladding generated by varying constant
internal over-pressure in the range from 0.1 to 14 MPa at two different constant heating
rates, 1 and 35 Ks−1. Creep rate is calculated according to Rosinger (1984) and burst
stress criterion according to Erbacher et al. (1982). The cladding outside diameter and wall thickness used in the calculations are 10.75 and 0.725 mm, respectively. Three sets of measured burst data (Erbacher, Neitzel, Rosinger, Schmidt, and Wiehr 1982; Karb, Sepold, Hofmann, Petersen, Schanz, and Zimmermann 1982; Erbacher and Leistikow 1987) are included for comparison.
0 1 2 3 4 5 6 7 8 Time [ s ] 0 0.2 0.4 0.6 0.8 Hoop strain [ - ] (a) 6.642 6.643 6.644 6.645 Time [ s ] 0.5 0.55 0.6 0.65 0.7 Hoop strain [ - ] (b)
Figure 7: (a) Hoop strain as a function of time, calculated for a heating rate of 35 Ks−1 and internal over-pressure of 8 MPa, until the instant of cladding burst. (b) A closeup of the hoop strain for the last 2 ms before cladding burst. The ring symbols mark calculated time intervals.
3.3 Parametric study
In the computations presented in the foregoing subsections, the creep rate and burst stress of cladding were calculated according to correlations of Rosinger (1984) and Erbacher et al. (1982), tables 1 and 3, respectively. Since in these correlations, the behaviour in the mixed-phase (α + β) are constructed in an ad-hoc fashion, i.e. using parameter fitting on a limited set of data and conditions, their wider applicability is questionable, see section 4. Hence, it is worthwhile to utilise the output of the phase transition model, i.e. the fraction of
β-phase as a function of time (temperature), to calculate the creep rate and the burst stress
in the (α + β) domain through equations (14) and (15), respectively.
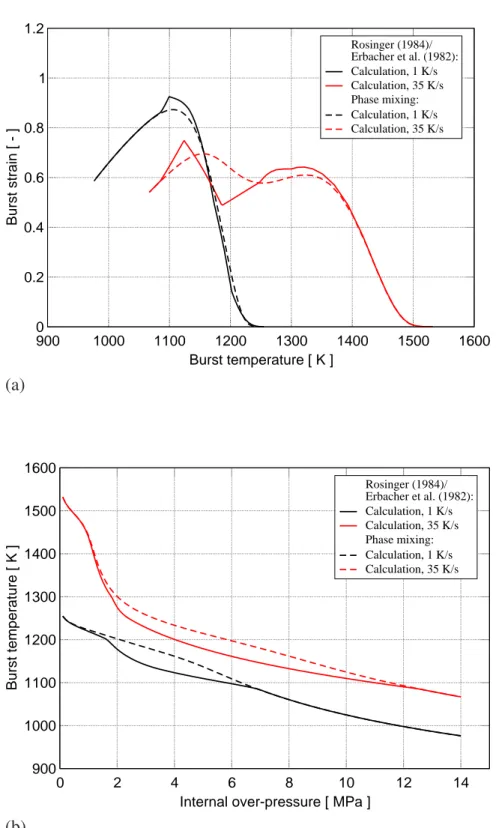
Figure 8a illustrates the difference between the two ways of computations regarding the prediction of burst strain-temperature behaviour for heating rates of 1 and 35 Ks−1. The
assumptions for the computations are the same as those used to calculate the lines in fig-ure 6. It is seen that in the case of 1 Ks−1, the difference between the two procedures is
negligible, while at 35 Ks−1, the two methods differ in the (α + β) domain, 1100-1250 K.
Nevertheless, the difference between the results is within the experimental scatter of the data (cf. figure 6). The corresponding calculations for cladding burst temperature versus internal rod over-pressure is shown in figure 8b.
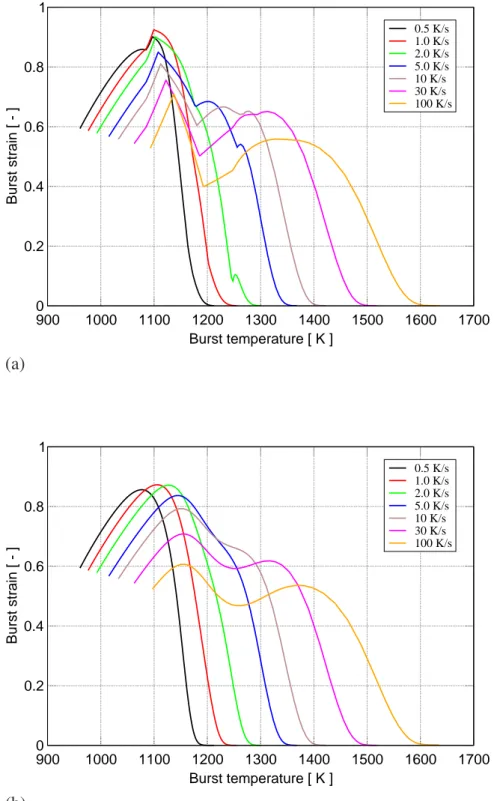
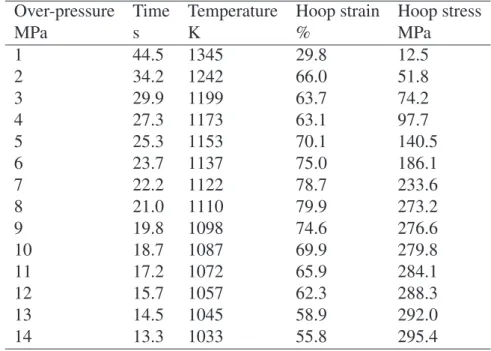
Finally, figures 9a-b depict computations of burst strain versus burst temperature as a func-tion of heating rate for the two aforemenfunc-tioned procedures. It is seen that phase mixing method smoothens the anomalies seen in figure 9a, which are artifacts of the discontinu-ities in the creep rate equation of Rosinger (1984) and burst criterion of Erbacher et al. (1982), tables 1 and 3, while keeping the trends correctly. Table 4 lists the burst data as a function of pressure for the heating rate of 10 Ks−1 corresponding to figure 9a. The
di-agrams show the prominent role of heating rate on burst strain. In the α-phase the burst strain decreases with increasing the heating rate, whereas in the mixed (α + β) domain and
β-phase the situation is more complex. For example, at 1300 K (β-phase), the burst strain
increases with increasing rate up to a heating rate of 10 Ks−1, then declines consecutively
at 30 and 100 Ks−1. Also, the higher heating rates shift the burst temperatures to higher
900 1000 1100 1200 1300 1400 1500 1600 Burst temperature [ K ] 0 0.2 0.4 0.6 0.8 1 1.2 Burst strain [ - ] Rosinger (1984)/ Erbacher et al. (1982): Calculation, 1 K/s Calculation, 35 K/s Phase mixing: Calculation, 1 K/s Calculation, 35 K/s (a) 0 2 4 6 8 10 12 14 Internal over-pressure [ MPa ]
900 1000 1100 1200 1300 1400 1500 1600 Burst temperature [ K ] Rosinger (1984)/ Erbacher et al. (1982): Calculation, 1 K/s Calculation, 35 K/s Phase mixing: Calculation, 1 K/s Calculation, 35 K/s (b)
Figure 8: Calculated (a) burst strain versus burst temperature and (b) burst temperature
versus rod internal over-pressure at two different heating rates, 1 and 35 Ks−1. Solid lines:
Creep rate and burst stress are calculated according to correlations of Rosinger (1984) and Erbacher et al. (1982), tables 1 and 3, respectively. Broken lines: Creep rate and burst stress in the two-phase (α + β) region are calculated by combining the single-phase creep rates of Rosinger (1984) and burst stress of Erbacher et al. (1982) according to equations (14) and (15), respectively.
900 1000 1100 1200 1300 1400 1500 1600 1700 Burst temperature [ K ] 0 0.2 0.4 0.6 0.8 1 Burst strain [ - ] 0.5 K/s 1.0 K/s 2.0 K/s 5.0 K/s 10 K/s 30 K/s 100 K/s (a) 900 1000 1100 1200 1300 1400 1500 1600 1700 Burst temperature [ K ] 0 0.2 0.4 0.6 0.8 1 Burst strain [ - ] 0.5 K/s 1.0 K/s 2.0 K/s 5.0 K/s 10 K/s 30 K/s 100 K/s (b)
Figure 9: Calculated burst strain versus burst temperature for various heating rates. Each
curve covers Zircaloy-4 tube internal over-pressures in the range of 0.1 to 14 MPa in steps of 0.1 MPa. (a) Creep rate and burst stress are calculated according to correlations of Rosinger (1984) and Erbacher et al. (1982), tables 1 and 3, respectively. (b) Creep rate and burst stress in the two-phase (α + β) region are calculated by combining the single-phase creep rates of Rosinger (1984) and burst stress of Erbacher et al. (1982) according to equations (14) and (15), respectively.
Table 4: Calculated burst data at a heating rate of 10 Ks−1vs. Zircaloy-4 tube internal over-pressure. Creep rate is calculated according to Rosinger (1984) and burst stress criterion according to Erbacher et al. (1982).
Over-pressure Time Temperature Hoop strain Hoop stress
MPa s K % MPa 1 44.5 1345 29.8 12.5 2 34.2 1242 66.0 51.8 3 29.9 1199 63.7 74.2 4 27.3 1173 63.1 97.7 5 25.3 1153 70.1 140.5 6 23.7 1137 75.0 186.1 7 22.2 1122 78.7 233.6 8 21.0 1110 79.9 273.2 9 19.8 1098 74.6 276.6 10 18.7 1087 69.9 279.8 11 17.2 1072 65.9 284.1 12 15.7 1057 62.3 288.3 13 14.5 1045 58.9 292.0 14 13.3 1033 55.8 295.4
4 Discussion
We have presented an integrated model for the rupture of zirconium alloy fuel claddings in a postulated loss-of-coolant accident in nuclear power reactors. We have solved the kinetic equations for phase transformation, creep and oxidation of cladding in a unified fashion, where the latter two coupled equations were solved simultaneously, but separately from the phase transformation kinetics.
In the calculations presented in section 3, we have used material parameters from litera-ture for oxidation, creep rate and burst stress of Zircaloy-4 cladding applicable to LOCA conditions. For the latter two quantities, we have used correlations in α-Zr and β-Zr sep-arately, while for the mixed (α + β)-Zr, we have either utilised explicit correlations for the region or employed mixing rules according to relations (14) and (15). The latter was done by combining the correlations in the single phase regions with the output of the phase transformation model described by equation (1) and the mixing rules. Using such recipes to obtain the creep rate and the burst stress in the two-phase region must be supported by experimental data. For the burst stress parameters the data presented and evaluated in (Forg-eron, Brachet, Barcelo, Castaing, Hivroz, Mardon, and Bernaudat 2000; Brachet, Portier, and Forgeron 2002) endorse the use of relation (15). On the other hand, the situation for creep rate is quite different. Rosinger (1984) offered an empirical correlation for the creep rate of Zircaloy-4 in (α + β) domain which is presented in table 1. The values for Az, Q
and n, listed in table 1, were derived from measurements of the uniaxial steady-state creep rate of Zircaloy-4 fuel cladding (Rosinger, Bera, and Clendening 1979). More specifically, these values are for α-Zr, from 823 to 1085 K, for (α + β)-Zr, from 1085 to 1248, K and for β-Zr, from 1248 to 1873 K.
We believe, at the fundamental level, the main uncertainty in our computations stem from the lack of appropriate creep law in the (α + β) domain of zirconium alloys. It had been noted by Kaddour et al. (2004) that Zircaloy-4 in the α domain (T < 1023 K) experimental data exhibit two creep regimes: At low stresses (σ < 15 MPa) the creep stress exponent is
n ≈ 1, cf. equations (3)-(4), suggesting that deformation mechanism could be “diffusional
creep”; while at higher stresses (σ > 15 MPa) the deformation mechanism is most likely “dislocation climb induced creep”, with n in the range of 4-5 ; see (Kassner 2009) for a review of creep mechanisms. In the β domain, Kaddour et al. (2004) observed only one regime, i.e. “dislocation climb induced creep”, cf. table 2. In the mixed phase (α + β) domain, however, the creep behaviour is more complex and as such no simple creep law has been established. Kaddour et al. (2004) have observed that for very low applied stresses (1-2 MPa), strain rates in the (α + β) domain are substantially higher than those measured in the single-phase domains including the high-temperature region of the β-phase. The estimated stress exponent n ≈ 1.5 by Kaddour et al. (2004) suggests that in the (α + β) domain the deformation mechanism could be controlled by “interphase interface sliding”, which is the hallmark of superplasticity. Superplasticity is the tendency of a polycrystalline to deform extensively at elevated temperatures (T > 0.5Tm), prior to rupture, where Tmis
the melting point of the solid (Kassner 2009; Mukherjee 1993). One of us (Massih 2009a) has recently evaluated the creep rate data of Kaddour et al. (2004) on Zr-1wt%Nb alloy by using the mixing rule given by equation (14), but the outcome in the (α + β) domain was unsatisfactory.
As has been pointed out by Mukherjee (1993), the three main requirements for superplastic behaviour are (i) fine (less than roughly 10 µm) and equiaxed grain size that is fairly stable during deformation, (ii) a temperature which is higher than about half of the melting point of the solid, and (iii) a strain rate that is typically not too high (less than 0.001 s−1) or not
too low (more than 10−6 s−1). These requirements are satisfied by nuclear grade Zircaloy
materials in the (α + β) domain. For example, Kaddour et al. (2004)’s Zircaloy-4 samples had equiaxed grains with a mean size of 5 µm.
Simple constitutive relations of the form defined by equations (3)-(4) with parameters based on fitting a limited set of data seem to be inadequate for describing the superplastic be-haviour in the (α + β) domain of zirconium-base alloys. A more general relation for the steady-state creep rate is given by (Mukherjee 1993)
dεθ dt = ADGb kBT ³b d ´p³σ G ´n . (16)
Here A is a material-dependent (dimensionless) constant, D is the appropriate diffusion coefficient, D = D0exp (−Q/kBT ), D0 is the frequency factor, Q the activation energy of diffusion, kBthe Boltzmann constant, G the shear modulus, b the magnitude of the Burgers
vector, d the grain size, and p the inverse grain size exponent. In this setting, Spingarn & Nix (1979) note that at small stresses (and strains) the exponents in relation (16) are given by p = 3 and n = 1, which describe the diffusional creep. At large stresses, however, p = 1 and n = 5, which characterise creep that is controlled by edge dislocations. Spingarn & Nix (1979) suggest that the transition from n = 1 to n = 5 behaviour corresponds to the superplastic domain. But no specific constitutive relation in the form of equation (16) is provided for this domain.
Garde et al. (1978) have investigated the uniaxial stress-strain behaviour of Zircaloy-4 at temperatures 973 to 1673 K. They observed a superplastic peak at 1123 K. At 1123 to 1173 K, they found that at low strain rates (< 10−4 s−1) the predominant mechanism of
superplasticity was grain boundary sliding, whereas at higher strain rates (> 10−4 s−1)
dislocation creep was prevailing. In particular, they found that for equiaxed Zircaloy-4, the value of the exponent n very much depended on the strain rate in the (α + β)-Zr. For example, at 1123 K, n ≈ 1.25 for a low strain rate of ˙ε ≈ 3 × 10⁻⁶ s−1, then increasing
continuously to n ≈ 5 as the strain rate was increased to ˙ε ≈ 2 × 10⁻³ s−1. For
Zircaloy-4 with a basketweave (acicular) grain structure, the variation in the exponent was from
n ≈ 3.3 to n ≈ 5 in the same span of strain rate.
Rosinger et al. (1979) by curve fitting various experimental data on the creep of Zircaloy-4 in the mixed phase (α+β) domain to equation (3) deduced an average value of n ≈ 1.88 for ˙ε < 3×10⁻³s−1. Later, Rosinger (1984) changed this value to n ≈ 2.33, as listed in table 1
(at the same time he changed the values for Azand Q, so the overall output were similar). To
deduce the parameters for the creep law in the superplasticity region in this manner is very simplistic. So is the phase mixing method described by relation (14) to combine the creep mechanisms in single-phase domains. Rosinger et al. (1979) note that due to “the dramatic change in stress exponent (of the creep rate) it is not possible, unambiguously, to identify the mechanism operating in the mixed (α + β)-phase. Additional experimental effort is required to determine the exact nature of creep equations with their limits of applicability and to identify the mechanisms controlling the creep in the mixed (α + β)-phase.” In other word a constitutive relation for creep in this region is missing.
To find out the difference between the phase mixing method and that recommended by Rosinger (1984), we have have compared computations of creep strain as a function of temperature (time) for a heating rate of 10 Ks−1 using the choice of parameters given in
table 1 for (α + β)-Zr and the phase mixing method given by relation (14). The results are presented in figure 10. A significant difference in strain behaviour between the two methods of calculation is seen in the (α + β) region. To elucidate further, we have plotted the corresponding creep rates obtained from the two methods in figure 11. Despite the marked difference, the overall impact on the rupture strain versus rupture temperature is not as dramatic, cf. figure 9.
900 1000 1100 1200 1300 1400 Temperature [ K ] 10-10 10-8 10-6 10-4 10-2 100 Hoop strain [ - ] Phase mixing Rosinger (1984)
Figure 10: Hoop strain of Zircaloy-4 cladding due to creep versus temperature during the
transient at a rod internal over-pressure of 1 MPa. Phase mixing (dashed line) refers to the rule per equation (14) as in figure 3, while the solid line is the outcome of the parameter designations in table 1 for (α + β)-Zr (Rosinger 1984).
900 1000 1100 1200 1300 1400 Temperature [ K ] 10-10 10-8 10-6 10-4 10-2 100 Creep rate [ 1/s ] Phase mixing Rosinger (1984)
Figure 11: Creep rate ˙εθ of Zircaloy-4 versus temperature during the transient at a rod internal over-pressure of 1 MPa. Phase mixing (dashed line) refers to the rule per equation (14), while the solid line is the outcome of the parameter designations in table 1 for (α+β)-Zr (Rosinger 1984).
In the present note, we did not make an in-depth analysis of creep behaviour in the mixed-phase (α + β) domain. This is a topic for a separate study. But comparing the works of Rosinger et al. (1979) with Kaddour et al. (2004), it is ironic that not much progress in un-derstanding of the phenomenon has been gained in the span of 25 years. The identification of the mechanism of creep in (α + β) domain still remains speculative. Our limited anal-ysis indicates that the present models for creep laws cannot be applied without extensive parameter fitting in the mixed-phase regime and the resulting correlations would probably have a restricted applicability.
As discussed in our preceding paper (Massih 2009b), oxygen concentration affects the phase transition temperature in Zr alloys and it is expected to have an impact on the kinetics of phase transition. Thus, strictly speaking, equation (1) should also depend on oxygen concentration. Experimental data, however, are required for a quantitative modelling of this phenomenon. When such data become available an extension of our model to account for this effect is straightforward. Then the three coupled differential equations will be solved simultaneously.
The impact of rod internal pressure on cladding rupture limit was evaluated briefly here (table 4). Increasing rod internal pressure shortens the time to rupture and lowers the rup-ture temperarup-ture. If the differential pressure is varying during the transient, equation (7) can be scaled linearly with pressure by a factor p/p0, where p0 is the initial pressure and
imple-mented in a transient fuel rod modelling code for assessing the cladding rupture under LOCA (Manngård 2009).
The effect of azimuthal temperature distribution in the cladding on its deformation is ac-counted in the fuel rod simulator code FRAPTRAN-1.3, see (Cunningham, Beyer, Medvedev, and Berna 2001; Manngård 2007) and references therein. In FRAPTRAN-1.3 the cladding tube can be divided into a number of circumferential elements each with a uniform temper-ature distribution. During each time-step, cladding strain computations are performed for each element individually, and at the end of each time-step, the strains for each element is summed. Computations are carried on in this way until the element with the highest stress reaches the burst stress equation (11), upon which failure is assumed to have occurred. Then the final results comprising rupture time, temperature and strain are determined.
5 Conclusion
A unified computer model for the rupture of fuel cladding during loss-of-coolant condi-tions has been presented. The model consists of interconnected modules for Zircaloy phase transformation, creep, oxidation and rupture under LOCA conditions. The main part of the model uncertainty at the fundamental level is the treatment of creep deformation in the two-phase (α + β) domain of the alloy, for which neither the existing correlations nor the phase mixing rules seem to be appropriate. The modelling of creep rate in the two-phase domain of zirconium alloys requires further investigation.
Acknowledgements The work was supported by the Swedish Radiation Safety Authority (SSM) under the contract number SSM 2008/139.
References
Bangaru, N. V., R. A. Busch, and J. H. Schemel (1987). Effects of beta quenching on the microstructure and corrosion of Zircaloys. In R. Adamson and L. van Swam (Eds.), Zirconium in the Nuclear Industry: Seventh International Symposium, Vol-ume ASTM STP 939, Philadelphia, USA, pp. 341–363. American Society for Test-ing and Materials.
Brachet, J. C., L. Portier, and T. Forgeron (2002). Influence of hydrogen content on the α/β phase transformation temperatures and on the thermal-mechanical behav-ior of Zy-4, M4 (ZrSnFeV), and M5TM (ZrNbO) alloys during the first phase of LOCA transient. In G. D. Moan and P. Rudling (Eds.), Zirconium in the Nuclear
In-dustry: Thirteenth International Symposium, Volume ASTM STP 1423, West
Con-shohocken, PA, USA, pp. 673–701. American Society for Testing and Materials. Burton, B., A. T. Donaldson, and G. L. Reynolds (1979). Interaction of oxidation and
creep in Zircaloy-2. In J. Schemel and T. Papazoglou (Eds.), Zirconium in the
Nu-clear Industry: Fourth Conference, Volume ASTM STP 681, Philadelphia, USA, pp.
561–585. American Society for Testing and Materials.
Cunningham, M., C. E. Beyer, P. G. Medvedev, and G. A. Berna (2001). FRAPTRAN: A computer code for the transient analysis of oxide fuel rods. Technical Report NUREG/CR-6739, Volume 1, US Nuclear Regulatory Commission, Washington, DC. Also as Pacific Northwest National Laboratory report: PNNL-13576.
Erbacher, F. J. and S. Leistikow (1987). Zircaloy fuel cladding behavior in a loss-of-coolant accident: A review. In R. B. Adamson and L. F. P. van Swam (Eds.),
Zir-conium in the Nuclear Industry: Seventh International Symposium, Volume ASTM
STP 939, Philadelphia, USA, pp. 451–488. American Society for Testing and Mate-rials.
Erbacher, F. J., H. J. Neitzel, H. Rosinger, H. Schmidt, and K. Wiehr (1982). Burst criterion of Zircaloy fuel claddings in a loss-of-coolant accident. In D. G. Franklin (Ed.), Zirconium in the Nuclear Industry: Fifth Conference, Volume ASTM STP 754, Philadelphia, USA, pp. 271–283. American Society for Testing and Materials. Erbacher, F. J., H. J. Neitzel, and K. Wiehr (1979). Studies on Zircaloy fuel clad
bal-looning in a loss-of-coolant accident - results of burst tests with indirectly heated fuel simulators. In Zirconium in the Nuclear Industry: Fourth Conference, Volume ASTM STP 681, Philadelphia, USA, pp. 429–446. American Society for Testing and Materials.
Forgeron, T., J. C. Brachet, F. Barcelo, A. Castaing, J. Hivroz, J. P. Mardon, and C. Bernaudat (2000). Experiment and modeling of advanced fuel rod cladding behavior under LOCA conditions: alpha-beta phase transformation kinetics and EDGAR methodology. In G. P. Sabol and G. D. Moan (Eds.), Zirconium in the
Nu-clear Industry: Twelfth International Symposium, Volume ASTM STP 1354, West
Conshohocken, PA, USA, pp. 256–278. American Society for Testing and Materi-als.
Garde, A. M., H. M. Chung, and T. F. Kassner (1978). Micrograin superplasticity in Zircaloy at 850◦c. Acta Metall. 26, 153–166.
Hill, R. (1948). A theory of yielding and plastic flow of anisotropic materials. Proc. Roy.
Soc. A 193, 281–297.
Kaddour, D., S. Frechinet, A. F. Gourgues, J. C. Brachet, L. Portier, and A. Pineau (2004). Experimental determination of creep properties of zirconium alloys together with phase transformation. Scripta Mater. 51, 515–519.
Karb, E. H., M. Prüßmann, L. Sepold, P. Hofmann, and G. Schanz (1983, March). LWR fuel rod behavior in the FR2 in-pile tests simulating the heatup phase of a LOCA. Technical Report KfK 3346, Kernforschungszentrum Karlsruhe, Germany.
Karb, E. H., L. Sepold, P. Hofmann, C. Petersen, G. Schanz, and H. Zimmermann (1982). LWR fuel rod behavior during reactor tests under loss-of-coolant conditions: Results of the FR2 in-pile tests. J. Nucl. Mater. 107, 55–77.
Kassner, M. E. (2009). Fundamentals of Creep in Metals and Alloys. Amsterdam, The Netherlands: Elsevier. Chapter 6.
Lemaignan, C. and A. T. Motta (1994). Zirconium alloys in nuclear applications. In R. W. Cahn, P. Haasen, and E. J. Kramer (Eds.), Nuclear Materials, Volume 10B of
Materials Science and Technology, Chapter 7, pp. 1–51. Weinheim, Germany: VCH.
Volume editor B.R.T. Frost.
Manngård, T. (2007). Evaluation of the FRAPTRAN-1.3 computer code. Technical Re-port 2007:15, Swedish Nuclear Power Inspectorate, Stockholm, Sweden. Available from www.ssm.se.
Manngård, T. (2009). Implementation of cladding material models in FRAPTRAN-1.3 for LOCA application. Technical Report TR09-002v1, Quantum Technologies AB, Uppsala, Sweden. To be issued by Swedish Radiation Safety Authority.
Massih, A. R. (2009a). A model for analysis of Zr alloy fuel cladding behaviour un-der LOCA conditions. Technical Report TR08-007v1, Quantum Technologies AB, Uppsala, Sweden. To be issued by Swedish Radiation Safety Authority.
Massih, A. R. (2009b). Transformation kinetics of zirconium alloys under non-isothermal conditions. J. Nucl. Mater. 384, 330–335.
Massih, A. R. and L. O. Jernkvist (2009). Transformation kinetics of alloys under non-isothermal conditions. Modelling Simul. Mater. Sci. Eng. 17, 055002.
Matthews, J. R. (1984). The effect of anisotropy on the ballooning of Zircaloy cladding.
Nucl. Eng. Des. 77, 87–95.
Miquet, A., D. Charquet, and C. H. Allibert (1982). Solid state phase equilibria of Zircaloy-4 in the temperature range 750-1050◦C. J. Nucl. Mater. 105, 132–141.
Mukherjee, A. K. (1993). Superplasticity in metals, ceramics and intermetallics. In R. W. Cahn, P. Haasen, and E. J. Kramer (Eds.), Plastic Deformation and Fracture of
Mate-rials, Volume 6 of Material Science and Technology, Chapter 9, pp. 407–460.
Wein-heim, Germany: VCH. Volume editor H. Mughrabi.
Neitzel, H. J. and H. E. Rosinger (1980). The development of a burst criterion for Zircaloy fuel cladding under LOCA conditions. Technical Report AECL-6420, Atomic Energy of Canada Limited.
Parsons, P. D., E. D. Hindle, and C. A. Mann (1986). The deformation, oxidation and embrittlement of PWR fuel cladding in a loss-of-coolant accident. Technical Report CSNI 129, OECD Nuclear Energy Agency, Paris, France.
Pettersson, K. (2009). Nuclear fuel behaviour in loss-of-coolant (LOCA) condi-tions. Technical Report NEA No. 6846, OECD Nuclear Energy Agency, Issy-les-Moulineaux, France.
Pirogov, E. N., M. I. Alymov, and L. L. Artyukhina (1989). Creep of N1 alloy within the region of polymorphic transformation. Atomic Energy 65, 864–866. Translated from Atomnaya Energiya, Vol. 65, pp. 293-294, October 1988.
Press, W. H., S. A. Teukolsky, W. T. Vetterling, and B. P. Flannery (1992). Numerical
Recipes in FORTRAN (Second ed.). Cambridge, UK: Cambridge University Press.
Chap. 16.
Rosinger, H. E. (1984). A model to predict the failure of Zircaloy-4 fuel sheathing during postulated LOCA conditions. J. Nucl. Mater. 120, 41–54.
Rosinger, H. E., P. C. Bera, and W. R. Clendening (1979). Steady-state creep of Zircaloy-4 fuel cladding from 9Zircaloy-40 to 1873 K. J. Nucl. Mater. 82, 286–297.
Sagat, S., H. E. Sills, and J. A. Walsworth (1984). Deformation and failure of Zircaloy fuel sheets under LOCA conditions. In D. G. Franklin and R. Adamson (Eds.),
Zir-conium in the Nuclear Industry: Sixth International Symposium, Volume ASTM STP
824, Philadelphia, USA, pp. 709–733. American Society for Testing and Materials. Shewfelt, R. S. W. (1988). The ballooning of fuel cladding tubes: theory and experiment.
Res Mechanica 25, 261–294.
Spingarn, J. R. and W. D. Nix (1979). A model for creep based on the climb at grain boundaries. Acta Metall. 27, 171–177.
VanUffelen, P., C. Gy˝ori, A. Schubert, J. van de Laar, Z. Hózer, and G. Spykman (2008). Extending the application range of a fuel performance code from normal operating to design basis accident conditions. J. Nucl. Mater. 383, 137–143.
Strålsäkerhetsmyndigheten Swedish Radiation Safety Authority
SE-171 16 Stockholm Tel: +46 8 799 40 00 E-mail: registrator@ssm.se
2013:24 The Swedish Radiation Safety Authority has a comprehensive responsibility to ensure that society is safe from the effects of radiation. The Authority works to achieve radiation safety in a number of areas: nuclear power, medical care as well as commercial products and services. The Authority also works to achieve protection from natural radiation and to increase the level of radiation safety internationally.
The Swedish Radiation Safety Authority works proactively and preventively to protect people and the environment from the harmful effects of radiation, now and in the future. The Authority issues regulations and supervises compliance, while also supporting research, providing training and information, and issuing advice. Often, activities involving radiation require licences issued by the Authority. The Swedish Radiation Safety Authority maintains emergency preparedness around the clock with the aim of limiting the aftermath of radiation accidents and the unintentional spreading of radioactive substances. The Authority participates in international co-operation in order to promote radiation safety and fi nances projects aiming to raise the level of radiation safety in certain Eastern European countries.
The Authority reports to the Ministry of the Environment and has around 270 employees with competencies in the fi elds of engineering, natural and behavioural sciences, law, economics and communications. We have received quality, environmental and working environment certifi cation.