SKI Report 00:57
Research
Application of the Pin-Loading Tension Test
to Measurements of Delayed Hydride
Cracking Velocity in Zircaloy Cladding
V. Grigoriev
R. Jakobsson
November 2000
ISSN 1104–1374 ISRN SKI-R-00/57-SE
SKI perspective
Beginning in 1998 the IAEA runs a Co-ordinated Research Programme entitled "Hydrogen and hydride induced degradation of the mechanica properties of zirconium based alloys". Swedish participation in the programme by KTH and Studsvik is supported economically by SKI. The Programme was initially limited to the delayed hydride cracking (DHC) problem. In the first part of the programme the participants performed a standardised measurement of crack growth in specimens made from pressure tubes of Zr2.5Nb alloy, an alloy in which DHC failures have occurred in the field. This round robin was a great success since all participants got very similar values of the crack growth rate.
Currently DHC is also of great interest as a possible mechanism for the degradation of zirconium alloy fuel cladding after an initial penetration of the cladding by another mechanism. In order to learn more about the DHC phenomenon as a secondary fuel failure mechanism SKI has already supported a doctoral student project on DHC at KTH and an extensive theoretical review on DHC by the consultancy ANT. It is clear that this aspect of DHC also has to be included in the IAEA programme. However there is no standardised test method for fuel cladding material as there is for pressure tube material. The IAEA group noted that the Pin Loading Test (PLT) developed in Studsvik for measurement of the fracture toughness of fuel cladding might also be used for measuring crack growth during DHC. Therefore, with support from SKI, Studsvik has performed the present study of the PLT test applied to the measurement of crack growth under DHC conditions. The tests have been performed on statically loaded specimens of stress relieved Zircaloy-2 with 200 ppm hydrogen concentration. The growth of cracks has been monitored by the potential drop method. The result is that DHC growth did occur in the specimens and that the potential drop signals were good enough to permit a quantitative evaluation of crack growth rate. It has thus been demonstrated that the PLT method can be used as a standardised test method for DHC in fuel cladding in the continued IAEA programme on hydrogen induced degradation of zirconium alloys. Responsible for the project at SKI has been Jan in de Betou.
SKI Report 00:57
Research
Application of the Pin-Loading Tension Test
to Measurements of Delayed Hydride
Cracking Velocity in Zircaloy Cladding
V. Grigoriev
R. Jakobsson
Studsvik Nuclear AB
SE-611 82 Nyköping
Sweden
November 2000
SKI Project Number 99159
This report concerns a study which has been conducted for the Swedish Nuclear Power Inspectorate (SKI). The conclusions and viewpoints presented in the report are those of the author/authors and do not necessarily coincide with those of the SKI.
rapp\ski\00-57\vg
List of contents
Abstract / Huvudinnehåll
1 Introduction 1
2 Material and equipment 2
2.1 Material for testing 2
2.2 Equipment 2
2.3 Specimen and fixture configuration 2
3 Test procedures 4
3.1 Specimen preparation 4
3.2 Specimen set-up 4
3.3 Fatigue pre-cracking 4
3.4 Heating / Cooling temperature - Time schedule 5
3.5 DHC cracking 5
3.6 Fracture surface examination 5
3.7 DHC-velocity calculations 6
3.8 KI-calculations 6
4 Results and discussions 7
4.1 DHC testing 7
4.2 Hydrogen extraction 7
4.3 Crack extension measurements 7
5 Conclusions 8
Acknowledgements References
Figures 1 through 15
Appendix A: Cladding tube material properties (Sandvik lot 83080) Appendix B: Instrument calibration record sheet
Appendix C: Correction factor f(a/W) for PLT-specimens Appendix D: Summary of DHC test results
Appendix E: Raw data for PLT-DHC specimens
Specimen 9-4 E1-E3 Specimen 9-5 E4-E6 Specimen 9-6 E7-E9 Specimen 13-4 E10-E12 Specimen 13-5 E13-E15 Specimen 13-6 E16-E18
rapp\ski\00-57\vg
ABSTRACT
The International Atomic Agency (IAEA) has recently initiated a Co-ordinated Research Programme (CRP) on ”Hydrogen and hydride induced degradation of the mechanical and physical properties of Zirconium-based alloys”. In the first phase of this CRP the
methodology for measuring the velocity of Delayed Hydride Cracking (DHC) in pressure tube materials was established. Studsvik Nuclear AB among the other participating laboratories from nine countries around the world carried out identical tests in ”round robin” on hydrided material of CANDU pressure tube. As an extension of the work the measurements of DHC in hydrided cladding materials were suggested.
The objective of the present work is to develop at Studsvik Nuclear the procedure of a constant load cracking test on unirradiated Zircaloy cladding. The procedure is based on the Pin-Loading Tension test recently developed at Studsvik for fracture toughness testing of the thin-walled tubing. The DHC tests are performed on specimens cut from unirradiated PWR cladding (SRA Zircaloy-4) hydrided for approximately 200 ppm and the rate of an axial crack propagation is determined in each test.
Six PLT-specimens have been tested for DHC at test parameters similar to the parameters used in the previous work for the pressure tube material. The axial crack growth velocities measured are within the interval of (2.6÷3.0)·10–8 m/s showing very good reproducibility and being slightly below the data for pressure tube material. The procedure developed for
measuring the axial crack velocity in the thin-walled tubing is adapted for the testing of irradiated cladding.
HUVUDINNEHÅLL
Internationella Atomenergikommissionen (IAEA) har nyligen initierat ett samordnat forskningsprogram (“Co-ordinated Research Programme”, CRP) angående väte- och hydridinducerad degradering av mekaniska och fysikaliska egenskaper hos
zirkoniumbaserade legeringar (”Hydrogen and hydride induced degradation of the mechanical and physical properties of zirconium-based alloys”). I den första delen av detta
forskningsprogram etablerades metoder för att mäta propageringshastigheter vid fördröjd hydridsprickning (Delayed Hydride Cracking, DHC) i trycktubsmaterial. Studsvik Nuclear AB deltog tillsammans med andra laboratorier från sammanlagt nio olika länder i en ”round robin” provning av hydrerat material från trycktuber i CANDU-reaktorer. Som en utökning av detta arbete föreslogs mätning av DHC i hydrerat kapslingsmaterial.
Målsättningen med föreliggande arbete har varit att hos Studsvik Nuclear ta fram en metod för mätning av sprickpropageringshastighet i konstant belastat, icke-bestrålat kapslings-material av Zircaloy. Metoden har baserats på den ”Pin-Loading Tension Test” som nyligen utvecklats vid Studsvik för brottseghetsprovning av tunnväggiga rör. DHC-provningen utförs på prover på icke-bestrålade kapslingsrör för tryckvattenreaktorer (SRA Zircaloy-4) som hydrerats till ca. 200 ppm. Vid provningen mäts propageringshastigheten för en axiell spricka. Sex PLT-prover har undersökts med avseende på DHC under liknande provningsbetingelser som vid tidigare provning av trycktubsmaterial. De uppmätta axiella sprickpropagerings-hastigheterna ligger inom intervallet (2.6 – 3.0).10-8 m/s. Data uppvisar mycket god reproducerbarhet och ligger något under data för trycktubsmaterialet. Den metod som
utvecklats för mätning av axiell sprickpropageringshastighet hos tunnväggiga rör kommer att anpassas för provning av bestrålat kapslingsmaterial.
1 rapp\ski\00-57\vg
1. INTRODUCTION
The International Atomic Agency (IAEA) has recently initiated a Co-ordinated Research Programme (CRP) on ”Hydrogen and hydride induced degradation of the mechanical and physical properties of Zirconium-based alloys”. In the first phase of this CRP the
methodology for measuring the velocity of Delayed Hydride Cracking (DHC) was established and participating laboratories from nine countries around the world carried out identical tests in ”round robin” on hydrided material of CANDU pressure tube. The results obtained at Studsvik Nuclear (Grigoriev and Jakobsson, 1999) agree well with the data from other laboratories.
As an extension of the work performed with pressure tube material the measurements of DHC in hydrided cladding materials were suggested. The Swedish Nuclear Power Inspectorate sponsors the development of a constant load cracking test procedure and supports the participation of Studsvik Nuclear in the IAEA CRP. The objective of the present work is to develop the procedure for measuring the axial crack velocity in hydrided Zircaloy cladding. The procedure is based on the Pin-Loading Tension test recently developed at Studsvik for fracture toughness testing of thin-walled tubing (Grigoriev et. al., 1996, 1997, 2000). Constant load tests in the present work are performed at 250°C on the specimens cut from unirradiated hydrided PWR cladding (SRA Zircaloy-4, 200 wtppm of hydrogen) and the velocity of crack propagation is determined in each test.
Six PLT-specimens of different length (9 and 13 mm) have been tested for DHC at test parameters similar to the parameters earlier used for pressure tube material. The axial crack growth velocities measured on the PLT-specimens are within the interval of (2.6÷3.0)·10–8 m/s showing very good reproducibility and being slightly below the data for pressure tube material. The procedure developed for measuring the axial crack velocity in the thin-walled tubing is adapted for the testing of irradiated cladding.
2 rapp\ski\00-57\vg
2. MATERIAL AND EQUIPMENT
2.1. Material for testing
The PWR SRA Zircaloy-4 cladding tube manufactured by Sandvik Steel AB is used in the present work. Detailed information about the tube properties (Sandvik lot 86080) is collected in Appendix A.
The pieces of cladding were electrolytically hydrided to hydrogen concentration of about 200 ppm. Hydrided pieces were heat treated at 410°C during 10 hours to obtain homogeneous hydride distribution. Fig. 1 show hydride morphology in the cladding wall thickness after 3 h, 7 h, and 16 h of electrolytic hydriding followed by heat treatment. The uniform distribution of hydrides is observed. To get a nominal concentration of 200 wtppm the hydriding has been performed during 14 hours. Hydriding and heat treatment of cladding pieces are performed at the Royal Institute of Technology in Stockholm.
2.2. Equipment
The testing is performed in a servo-hydraulic Instron 1362 machine with a 50 kN capacity (specimens PLT-13) and in a servo-hydraulic Instron 8872 machine with a 10 kN capacity (specimens PLT-9). The testing machines are calibrated for machine class 0.5 (accuracy within 0.5 %) according to the Swedish National Standard SS-EN10002-2 by an accredited body. The experimental set up for the measurements is the same for both machines and is similar to that used in the Round Robin tests on CANDU pressure tubes (Grigoriev and Jakobsson, 1999). The calibration record sheet for the instruments used in the present work is shown in Appendix B. Main units of measuring equipment are shown in Fig. 2.
2.3. Specimen and fixture configuration
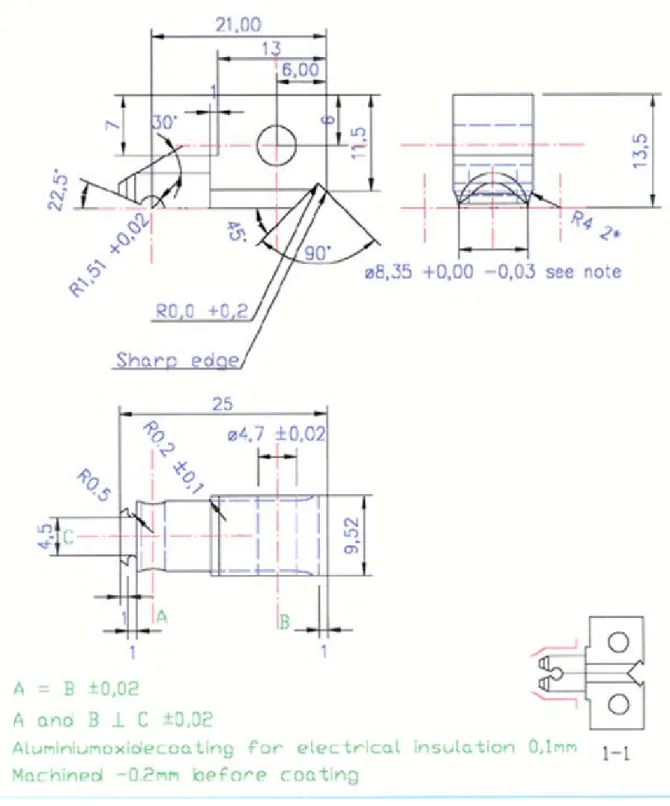
Sharply notched PLT-specimen is manufactured from the cladding tube (Fig. 3). The
specimen is axially notched at both edges. The notch width at the front edge of the specimen is 0.15 mm and the notch width of 0.5 mm is used for the back edge. The axial notches at the front edge are sharpened with fatigue cracks. In the present work the PLT-specimens with two different lengths, 9 and 13 mm, have been used (see Fig. 3).
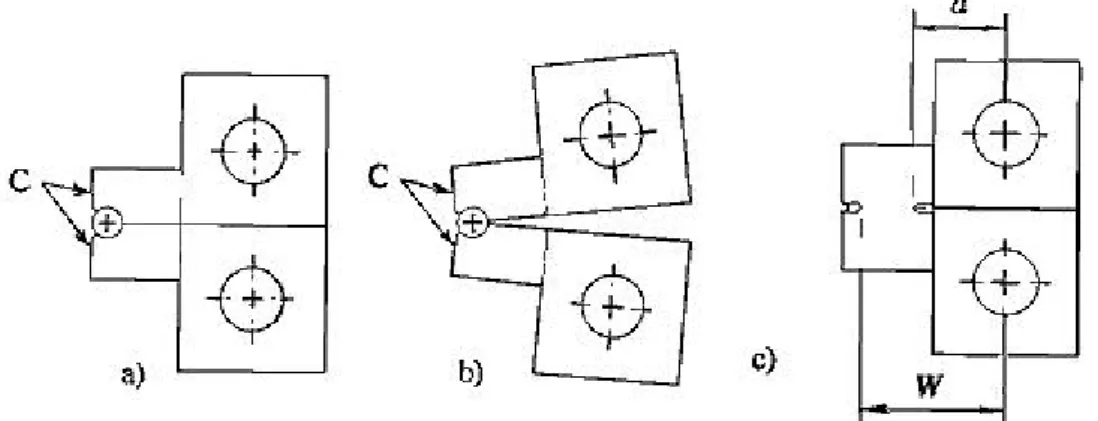
The PLT-fixture consists of two halves, which when placed together form the cylindrical holder (Fig.4a). This cylindrical holder has a diameter, which allows it to be inserted into the tubular PLT-specimen, while maintaining a minimal interfacial gap. The fixture halves, being loaded in tension through the pins, have the capability of mutual rotation around the axis determined by a small pin placed between the fixture halves at the end of the cylindrical holder (Fig.4b). The rotation of the fixture halves is similar to the rotation of compact specimen halves under tension, with only one difference: in the PLT-fixture the rotation axis does not change its position when the crack propagates in the specimen.
Specimen and fixture have closely interrelated configurations and when combined, create an assembly (Fig.4c) characterised by the ratio W/a , where W is the distance between the load-line and the rotation axis of the fixture halves, and a is the distance between the load-load-line and the notch tip in the specimen. In the assembly, all four notches of the specimen should be positioned at the contact plane of the fixture halves. The rotation axis passes through the notch tips at the back, non-loaded, specimens edge.
3 rapp\ski\00-57\vg
To perform the potential drop measurements of the crack extension the fixture should be insulated from the specimen. In the present work the cylindrical holder was insulated by means of a ceramic layer (Al2O3) precipitated at the fixture surface due to plasma injection.
Finally, the ceramic layer was polished down to the final diameter 8.35 (+0.00 -0.03) mm shown in Figs. 5, 6. The PLT fixtures for the specimen lengths of 9 mm and 13 mm are shown in Fig.7a. The fixture for specimens PLT-13 is shown without ceramic coating. Though no indications of specimen slippage from cylindrical holder have been noticed, a catch made of stainless steel wire (see Fig.7a) is used at the backside of cylindrical holder during fatigue pre-cracking. The catch is taken away before the DHC loading. The specimen-fixture assembly with attached electrical connections for potential drop measurements is shown in Fig. 7b.
The loading of the fixture is performed through the pins of 4.0 mm in diameter, while a pin of 3.0 mm in diameter determines the rotation axis for the fixture halves (Fig. 7a, b). The fixture is manufactured from Nimonic 90 and pins are made from hardened steel. The schematic view of the pull rod assembly is shown in Fig. 7d. Displacement transducer (LVDT) is attached to the mouth of the PLT-fixture to measure fixture opening during the test.
4 rapp\ski\00-57\vg
3. TEST PROCEDURES
3.1. Specimen preparation
The PLT-specimens with the nominal length of 9 mm and 13 mm have been manufactured from hydrided pieces of the cladding (see Fig. 3). The notches at the specimens are made by means of diamond wheels of different thickness: 0.15 mm at the front (loaded) edge of the specimen and 0.5 mm at the back edge. The mark "M" made at the specimen surface indicated the desired crack length during fatigue pre-cracking.
3.2. Specimen set-up
The specimen assembled with the fixture is set up in the testing machine. The notches of the specimen are aligned with a contact plane of the fixture halves. To keep the specimen secured tightly in position, a small load of about 50 N is applied.
For the Direct Current Potential Drop (DCPD) measurements to be performed, Zircaloy pins (Ø2 mm × length ˜ 10 mm) are attached by spot welding to the top and to the bottom of the PLT-specimen (see Fig. 7b). Pt-wires are used for both the DCPD-probe leads (Ø0.3 mm) and for current leads (2×Ø0.5 mm) which are welded to the same pins. A voltage drops of about 15 mV indicates an acceptable contact resistance.
3.3. Fatigue pre-cracking
The PLT-specimen is fatigue pre-cracked to produce a sharp crack of about 1 mm length at the notches of 0.16 mm width. Fatigue pre-cracking is performed at room temperature in the load-controlled regime at the frequency of 5-10 Hz. The crack monitoring is performed by means of DCPD measurements and visually (Fig.7c). The fatigue is initiated at the maximum and minimum loads, Pmax/Pmin = 200 N / 50 N. After certain amount of cycles the fatigue is
terminated and then the fatigue is continued at lower loads. The sequence of the Pmax/Pmin
values for PLT-9 and PLT-13 specimens and amount of cycles for each step used in the present work are shown below:
Specimen PLT-9 Specimen PLT-13
Pmax(N) / Pmin (N) Cycles Pmax(N) / Pmin (N) Cycles
200 / 50 1500 200 / 50 2000
150 / 50 4000 150 / 50 3000
90 / 40 4500 120 / 50 3000
100 / 50 10000
The last step of pre-cracking appears to be most important. This step practically does not affect the DCPD reading, but it is believed to decrease or even to eliminate the incubation period in the DHC tests.
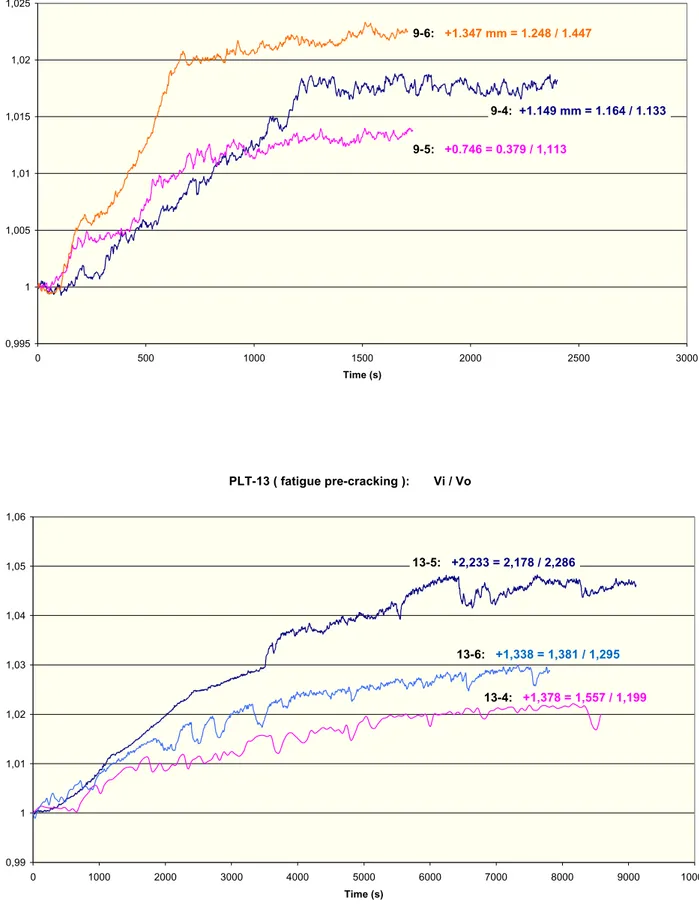
The specimens of the same type, PLT-9 or PLT-13, are pre-cracked under identical
5 rapp\ski\00-57\vg
of the PLT-9 specimen. The data on a fractional increase in DCPD, V/Vo, during the fatigue
pre-cracking are shown in Fig. 9 for each specimen tested in the present work. Different duration of the procedure is mainly caused by different frequency used for pre-cracking. It should be mentioned here that the indicated sequences of Pmax/Pmin and amount of cycles are
only applicable to the material used in the present work. 3.4. Heating / Cooling temperature - Time schedule
Though hydrogen concentration in the PLT specimens is ˜ 200 ppm, i.e. significantly higher than in pressure tube material, the thermal cycle “20°C-315°C-250°C” used in the present work is identical to the thermal cycle used in the IAEA Round Robin tests. The thermal cycle is calibrated in several heats to establish the time of loading, which is selected to be 6.5 hours after the start of the heating. This interval of 6.5 hours includes:
- the time of heating up,
- the hold time at peak temperature (~1 h at 315-317°C), - the time of cooling to the test temperature (250°C), and - the hold time at the test temperature (~1 h) before loading.
A typical temperature-time record is shown in Fig. 10 as an example of data record for the entire DHC experiment on the PLT-9 specimen. All requirements, which are determined for the DHC test procedure in the IAEA Round Robin Program (Choubey, 1998) concerning the heating and cooling rates, the specimen overcooling, etc., are mandatory for the
PLT-specimens. An example of temperature variation during the DHC experiment is shown in Fig. 11, which is enlarged view of the data from Fig. 10.
3.5. DHC cracking
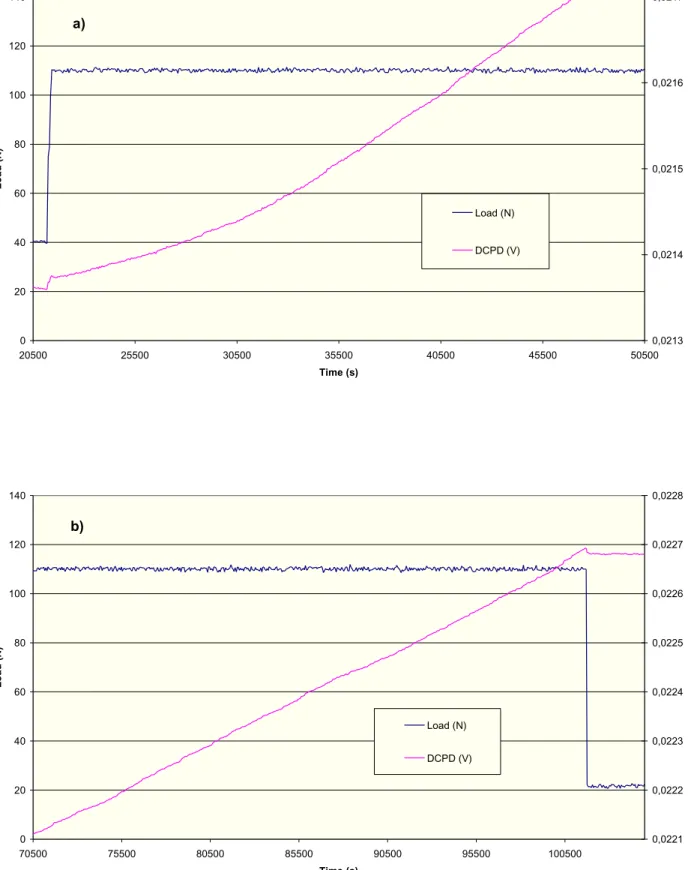
The pre-cracked specimen is heated in air and loaded after specified thermal cycle. To achieve an initial stress-intensity needed for DHC, the load of 110 N is applied to the PLT-9 specimen and the load of 160 N is applied to the PLT-13 specimen.
The DCPD technique is used for detecting and monitoring crack growth. The loading of the specimen is usually accompanied by the step-wise increment of the DCPD reading followed by the gradual increase of the DCPD values (Fig. 12a). Cracking is allowed to continue until the crack has grown about 2 mm. The load is then removed, the furnace is open and the specimen cooled down to room temperature. The unloading of the specimen is usually accompanied by the step-wise decrease of the DCPD reading (Fig. 12b).
The end of the crack is marked by means of a short-term fatigue. Usually, the cycling at the maximum and minimum loads, Pmax/Pmin = 100 N / 50 N, during 3000-5000 cycles is enough
for clear marking of the DHC crack tip.
After post-test fatigue cracking, the two halves of the cracked PLT-specimen are pulled apart to open the cracks for visual examination. The crack lengths are measured at the fracture surfaces and the crack velocity is then evaluated.
3.6. Fracture surface examination
Two fracture surfaces are obtained for each PLT-specimen tested, Side A and Side B (see Fig. 3). Thus, two crack lengths are measured for each specimen (Fig. 13a). The length of DHC crack is calculated for each side of the specimen as a difference between the average final crack length
6 rapp\ski\00-57\vg
after DHC test and the average crack length after fatigue pre-cracking. The average values for each specimen side are obtained by means of a 9-point averaging method (Fig. 13b, c).
The distance between the specimen edge and the point of maximal DHC-length, referred to as reference length, RL, is measured at each side of the specimen in the microscope. The ratio "RL-specimen” / “RL-photo" is used for calculation of the actual crack lengths from the photo
measurements, lA and lB:
aA = lA (RL-specimen/RL-photo) and aB = lB (RL-specimen/RL-photo).
The DHC in the PLT-specimen is characterised by means of an effective length, a, which is the average of the corresponding values measured at both sides of the specimen. Thus, an effective length of the notch, aN, an effective crack length after fatigue pre-cracking or initial
crack, a0, and an effective crack after DHC test or final crack, af, are calculated for each
specimen as 0.5·( aA + aB ). 3.7. DHC-velocity calculations
The average crack velocity, VDHC, is determined by dividing the effective DHC length, aDHC
(mm), by the DHC time, tDHC (min), as follows
VDHC (m/s) = aDHC·10-3 / ( 60·tDHC ).
The DHC time is calculated as difference, tL - tinc , between time on load, tL, and incubation
time, tinc , where incubation time is time on load before the initiation of crack growth. 3.8. KI-calculations
The KI-values are calculated using the following equation:
KI = [ P / ( 2t·vW )·]·f(a/W) (1)
where P = load applied (N);
t = wall thickness of the cladding (m);
W = width of the specimen-fixture assembly (m); a = effective crack length (m).
The following equations for dimensionless geometry correction factor, f(a/W), have been used: for specimen PLT-9:
f(a/W) = 3281,444(a/W)5 - 9918,190(a/W)4 + 12626,875(a/W)3 –
- 8217,676(a/W)2 + 2722,718(a/W) - 364,772 (2) for specimen PLT-13:
f(a/W) = 46,6243(a/W)5 - 117,9033(a/W)4 + 275,2862(a/W)3 –
- 137,2754(a/W)2 + 40,6353(a/W) - 4,9534 (3) The equations (2, 3) are obtained in the present work experimentally from compliance measurements performed for the PLT-specimens. More details about the KI and f(a/W)
7 rapp\ski\00-57\vg
4. RESULTS AND DISCUSSIONS
4.1. DHC testing
The summary of the DHC tests on hydrided Zircaloy cladding performed by means of the PLT-technique is shown in Appendix D. Independently of the specimen length, 9 or 13 mm, good reproducibility of the axial crack velocity, VDHC, is observed. The VDHC-values for all
specimens tested are within the interval from 2.6·10–8 m/s to 3.0·10–8 m/s. This is slightly below the axial crack velocities earlier obtained for Zr-2.5Nb CANDU pressure tube material tested at the same temperature (315°C / 250°C) and stress intensities (15-25 MPavm).
Detailed information about each specimen tested is collected in Appendix E. 4.2. Crack extension measurements
The use of the DCPD technique for crack extension measurements in the PLT-specimens might be difficult because of the problems with an insulating layer at the fixture surface. In such a case, the use of the LVDT for measuring of the fixture mouth opening can be an alternative solution. The LVDT readings plotted versus the corresponding DCPD-values are shown in Fig.14 for all specimens tested. In all cases, the LVDT readings clearly indicate the loading/unloading moments and, in general, are proportional to the DCPD values. The LVDT measurements appear to be an acceptable alternative for DCPD measurements to detect an initiation of an axial crack extension (Fig.15).
4.3. Crack surface topography
The DHC-crack surface topography obtained in the present work for unirradiated specimens appears to reproduce the main topographical features observed for axial splits in failed fuel rods:
- crack surface is macroscopically flat and oriented along the radial plane of the cladding; - clear "shevron" pattern is observed along the entire DHC-crack length;
- despite the notch length and fatigue crack length are longest at the inner surface of the specimen, the DHC-crack propagates faster in the outer layers of the specimen; - visual examination of the specimen outer surface shows that the fatigue crack
propagates without any signs of the specimen thinning. However, clear indications of the localised thinning of the specimen wall are observed along the DHC-crack.
8 rapp\ski\00-57\vg
CONCLUSIONS
The procedure for measuring the axial crack velocity in hydrided Zircaloy cladding has been developed. The procedure is based on the Pin-Loading Tension test recently developed at Studsvik for fracture toughness testing of thin-walled tubing.
Six specimens of hydrided Zircaloy cladding (SRA Zircaloy-4, 200 wtppm) have been tested for delayed hydride cracking at 250°C. The axial crack growth velocities measured in the tests are within the interval of (2.6÷3.0)·10–8 m/s. The experimental set-up shows very good reproducibility of the test results and is adapted for the testing of irradiated cladding
materials.
ACKNOWLEDGMENTS
The Swedish Nuclear Power Inspectorate, whose support is gratefully acknowledged, has sponsored this work.
The authors would like to thank:
Mr. T. Andersson - Sandvik Steel AB, for delivery of Zircaloy cladding;
Mr. K. Pettersson - Royal Institute of Technology, for arranging of Zircaloy cladding hydriding and valuable discussions;
Mr. H. Ericsson - Studsvik Nuclear AB, for making photographs;
Mr. M. Nykvist - Studsvik Nuclear AB, for help in performing DHC tests;
Mr. J. In de Betou - the Swedish Nuclear Power Inspectorate, for interest in this work. Mr. K. Coleman - Chalk River Laboratory, for all encouragement and help;
Mr. I. Ritchie - International Atomic Energy Agency, as well as all members of the IAEA CRP group, for stimulating support and interest in this work.
9 rapp\ski\00-57\vg
References
Grigoriev, V. and Jakobsson, R., IAEA Co-ordinated Research Program: "Round Robin" on Measuring the Velocity of Delayed Hydride Cracking (DHC), SKI Report 99:39 (September, 1999).
Grigoriev, V., Josefsson, B., and Rosborg, B., Fracture Toughness of Zircaloy Cladding Tubes, 11th Int Symp on Zirconium in the Nuclear Industry, 1996, ASTM STP 1295, p 431-447.
Grigoriev, V., Josefsson, B., Rosborg, B., and Bai, J., A novel fracture toughness testing method for irradiated tubing - Experimental results and 3D numerical evaluation. Proc. 14th Int. Conf. on Structural Mechanics in Reactor Technology, Div. C, paper C20/1, p 57-64, (August, 1997).
Grigoriev, V., Pettersson, K., and Andersson, S., Influence of Texture on Fracture Toughness of Unirradiated Zircaloy Cladding, 12thInt Symp on Zirconium in the Nuclear Industry, 2000, ASTM STP 1354, p 303-315.
Choubey, R., DHC Axial Velocity Test Procedure for IAEA Round-Robin Test Programme, Report FC-IAEA-002, T1.20.13-CAN-273.63-02 (November, 1998).
FIG. 1. Hydride morphology in Zircaloy-4 cladding (lot 86080) after different duration of electrolytic hydriding followed by homogenisation at 410°C / 10 h. Hydrogen concentration wa s obtained by means of hot extraction. The entire thickness of the cladding at the photos is 0.565 mm.
3 hours ( 14 ppm ) 6 hours ( 25 ppm ) 16 hours ( 270 ppm )
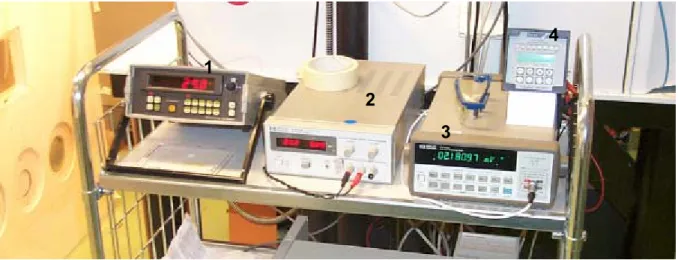
FIG. 2. Experimental set of measuring equipment for the DHC testing: 1 Thermometer Comark 6200
2 DC Power Supply HP E3614A 3 Nano-voltmeter HP 34420
4 LVDT Readout Lucas Schaevitz MP2000 1
2
3
Nominal dimensions (mm) Side A or B ( i = A or B ) Specimen type
c
ia
ia
Mc
i- b
it
cA bA PLT-9 PLT-13 9.0 13.0 1.2 2.0 2.0 3.0 2.0 2.0 0.57 0.57FIG. 3. Nominal dimensions of the PLT-specimens used in the present work. Specimen is characterised by an effective notch length aN = 0.5( aA + aB ), where aA and aB are the
notch lengths at Sides A and B, respectively. The mark "M" at the specimen surface indicates the desired crack length for fatigue pre-cracking.
FIG. 4. Pin-Loading fixture design for an axially notched PLT-specimen (a); mutual rotation of fixture halves (b); and specimen-fixture assembly before the loading (c); where C = cylindrical part of the holder to be inserted into tubular specimen, a = the distance between the load-line and notch-tip in the specimen, and W = the distance between the load-line and rotation axis of the fixture halves.
"M"
0.16 mm
FIG. 7. The PLT-fixtures for specimen length of 9 mm and 13 mm (a); electrical connections for potential drop measurements on the PLT-specimen (b); visual control of crack extension during fatigue pre-cracking (c); and schematic view of the pull rod assembly placed into the furnace together with the displacement transducer (LVDT) attached to the fixture mouth (d). The fixture for specimens PLT-13 is shown without ceramic coating (see Fig.7a).
d a
c b
0,0143 0,01435 0,0144 0,01445 0,0145 0,01455 0,0146 0,01465 0 500 1000 1500 2000 2500 3000 Time (s) DCPD (V) 0 50 100 150 200 250 Load (N) DCPD (V) Load (N)
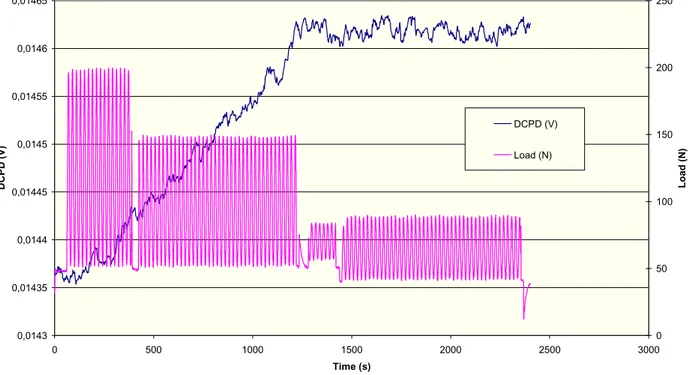
FIG. 8. An example of the DCPD measurements during fatigue pre-cracking of the specimen PLT-9.
PLT-9 ( fatigue pre-cracking ): Vi / Vo 0,995 1 1,005 1,01 1,015 1,02 1,025 0 500 1000 1500 2000 2500 3000 Time (s) Vi / Vo 9-4: +1.149 mm = 1.164 / 1.133 9-5: +0.746 = 0.379 / 1,113 9-6: +1.347 mm = 1.248 / 1.447 PLT-13 ( fatigue pre-cracking ): Vi / Vo 0,99 1 1,01 1,02 1,03 1,04 1,05 1,06 0 1000 2000 3000 4000 5000 6000 7000 8000 9000 10000 Time (s) Vi / Vo 13-5: +2,233 = 2,178 / 2,286 13-4: +1,378 = 1,557 / 1,199 13-6: +1,338 = 1,381 / 1,295
FIG. 9. A fractional increase in DCPD, V/Vo, during the fatigue pre-cracking of the
specimens PLT-9 and PLT-13. For each specimen the measured fatigue crack length is indicated: + Average = Side A / Side B (see Fig. 3).
0 50 100 150 200 250 300 350 0 20000 40000 60000 80000 100000 Time (s)
Load (N), Specimen temperature (°C)
0,019 0,0195 0,02 0,0205 0,021 0,0215 0,022 0,0225 0,023 0,0235 DCPD (V) Load (N) Specimen (°C) DCPD (V)
FIG. 10. An example of the data record for entire DHC-testing of the PLT-9 specimen.
246 247 248 249 0 20000 40000 60000 80000 100000 120000 Time (s) Specimen temperature (°C) 25 26 27 28 Room temperature (°C) Specimen (°C) Room (°C)
0 20 40 60 80 100 120 140 20500 25500 30500 35500 40500 45500 50500 Time (s) Load (N) 0,0213 0,0214 0,0215 0,0216 0,0217 DCPD (V) Load (N) DCPD (V) a) 0 20 40 60 80 100 120 140 70500 75500 80500 85500 90500 95500 100500 Time (s) Load (N) 0,0221 0,0222 0,0223 0,0224 0,0225 0,0226 0,0227 0,0228 DCPD (V) Load (N) DCPD (V) b)
FIG. 12. Step-wise change of the DCPD readings at the loading (a) and unloading (b) of the PLT-9 specimen under the DHC experiment (enlarged view of the data from Fig. 10).
FIG. 13. An example of two fracture surfaces (Side A and Side B) obtained for PLT-specimen tested for DHC. The measurement grid for nine-point average crack length is shown for each side of the specimen. The reference length (RL) measured at fracture surface in the
microscope and at the photo is indicated.
Reference Length (RL) Side A Side B Side A Side B a) b) c)
-5,8 -5,6 -5,4 -5,2 -5 -4,8 -4,6 -4,4 0,02 0,0205 0,021 0,0215 0,022 0,0225 0,023 0,0235 DCPD (V) LVDT (V) 9-4 9-5 9-6 Specimens PLT-9 a) -5,60 -5,40 -5,20 -5,00 -4,80 -4,60 -4,40 -4,20 -4,00 0,0195 0,02 0,0205 0,021 0,0215 0,022 DCPD (V) LVDT (V) 13-4 13-6 13-5 Specimens PLT-13 b)
FIG. 14. The LVDT-reading plotted versus the corresponding DCPD-values from the DHC tests of the specimens PLT-9 (a) and PLT-13 (b).
0,0213 0,0214 0,0215 0,0216 0,0217 0,0218 0,0219 0,022 0,0221 0,0222 0,0223 0,0224 0,0225 0,0226 0,0227 20000 30000 40000 50000 60000 70000 80000 90000 100000 110000 Time (s) DCPD (V) -5,8 -5,6 -5,4 -5,2 -5 -4,8 -4,6 -4,4 LVDT (V) DCPD (V) Series2 a) Specimen 9-5 LVDT DCPD 0,021 0,0211 0,0212 0,0213 0,0214 0,0215 0,0216 0,0217 0,0218 0,0219 0,022 0,00 10000,00 20000,00 30000,00 40000,00 50000,00 60000,00 70000,00 80000,00 Time (s) DCPD (V) -5,0 -4,9 -4,8 -4,7 -4,6 -4,5 -4,4 -4,3 -4,2 -4,1 -4,0 LVDT (V) DCPD (V) LVDT (V) b) Specimen 13-5
FIG. 15. An example of the DCPD and the LVDT measurements under the DHC test of the specimens PLT-9 (a) and PLT-13 (b).
APPENDIX A.1 (1)
Properties of SANDVIK Zr-4 lot 86080 Nominal dimensions OD = 9,50 mm; WT = 0,57 mm Chemical composition Sn: 1,24-1,26% Fe: 0,22% Cr: 0,09-0,10% O: 1140-1220ppm Si: 100ppm C: 120ppm Final anneal
480°C/3,5hrs implying a Stress Relief Annealed Condition (SRA).
TEM studies performed on other lots annealed at the same temperature show that the degree of recrystallisation falls in the range 5-10%.
Tensile RT Yield Strength, N/mm²: 558 548 Tensile Strength, N/mm² 759 757 Elongation, %: 18 20 Tensile 385°C Yield Strength, N/mm²: 356 355 Tensile Strength, N/mm² 439 458 Elongation, %: 21 19 Corrosion 400°C/3 days Weight gain, mg/dm²: 17 18
Samples tested in as-delivered condition (belt polished) Surface roughness Outside, µm: 0,35 0,33 Inside, µm: 0,42 0,40 Hydride orientation Fn value: <0,05 Grain size Longitudinal, ASTM: 11 Transversal, ASTM: 11
Above values refer to the grain size of the recrystallised hollows prior to the final pilgering.
APPENDIX B.1 (1)
Instrument calibration record sheet
INSTRUMENT SERIAL / ID NUMBER CALIBRATION DATE CALIBRATION DUE CALIBRATED BY Nanovoltmeter (DCPD) HP 34420
US34000503 21 April 1999 20 April 2001 Hewlett Packard
DC power supply HP E3614A
KR 31500667 19 April 1999 18 April 2001 Hewlett Packard
LVDT Readout Lucas Schaevitz MP 2000
(LVDT)
1763 04 May 2000 03 May 2001 Studsvik
Nuclear AB
Thermometer Comark 6200
11573 06 April 2000 05 April 2001 Studsvik
Nuclear AB Testing machine Instron 1362 H 2063 23 September 1999 15 September 2000 22 September 2000 14 September 2001 MTS Testing machine Instron 8872 H 2073 15 September 2000 14 September 2001 MTS Thermoelements 21255 67926
07 April 1999 06 April 2000 Studsvik Nuclear AB Data acquisition /
/ switch unit HP 34970A
US 37007073 04 May 2000 03 May 2001 Studsvik
Nuclear AB
Data acquisition / / switch unit HP 34901A
US 37007321 04 May 2000 03 May 2001 Studsvik
APPENDIX C1(3) Correction factor f(a/W) for PLT specimens
A dimensionless geometry correction factor f(a/W) for PLT-specimens is inferred from
compliance measurements. According to an energy approach for fracture proposed by Irwin, an energy release rate, G, is a measure of the energy available for an increment of crack extension, dA, and for the specimen with edge crack, a, can be expressed as
G = P2( dC / 2dA) = P2dC / 2Bda (1)
where P = load applied to the specimen, B = specimen thickness,
C = compliance which is inverse of the specimen stiffness, and A = crack area.
An energy release rate can be also expressed as
G = KI2 / E' = [ P2 / B2WE' ] f 2(a/W) (2)
where KI = stress intensity factor,
W = distance between the load-line and the crack tip
E = Young's modulus ( E' = E for plane stress and E' = E/( 1-v2) for plane strain). Combining Eq (1) and Eq (2) and solving for f(a/W) gives
f(a/W) = [ BE'·dC/2d(a/W) ]1/2 (3)
The PLT-specimen manufactured from the thin-walled tubing contains two edge notches at the loaded edge of the specimen (Fig. 1a). Thus, E' = E due to small thickness of the specimen and B = 2t and dA = 2tda, where t is tubing wall thickness and da is the crack extension. This yields the following equations for the PLT-specimen:
f(a/W) = [ tE·dC/d(a/W) ]1/2 (4)
KI= [ P / ( 2t·√W ) ] f(a/W) (5)
The schematic view of the PLT-specimen (Fig. 1a) and the specimen-fixture assembly (Fig. 1b) shows all dimensional characteristics involved in Eq (4), (5). The dimensions W and b are the characteristics of the fixture while the length a results from the fixture dimension b and the crack length measured at the specimen. The PLT-specimen is characterised by means of an effective crack length, which is an average of two cracks measured at Sides A and B (Fig. 1a), thus a = 0.5·(aA + aB) + b. (6) cA bA P P
a
W
b
For PLT-fixtures used in the present work the following values are applicable:
Fixture b (mm) W (mm)
PLT-9 8 15
PLT-13 8 19
Fig. 1b Fig. 1a
APPENDIX C2(3) Compliance measurements
Three PLT-13 specimens were prepared for fracture toughness testing. The specimens had different notch lengths:
PLT-13 Notch (mm) ai 13-1 13-2 13-3 2,00 4,03 6,18
The specimens are tested at room temperature and the load-displacement curves are corrected for the loading rig deflection (Figure 1).
Load-displacement curves corrected for loading train deflection
-200 0 200 400 600 800 1000 1200 1400 -1 0 1 2 3 4 5 6 Load-Line Displacement (mm) Load (N) ao = 2,00 mm ao = 4,03 mm ao = 6,18 mm 13-1 13-2 13-3 Specimens PLT-13 Figure 1
Load-Displacement Curves corrected for the loading rig deflection (room temperature test).
The elastic compliance is determined for each specimen and the data are plotted as a function of crack length (Figure 2).
Compliance versus crack length
Eq 1: y = 24,276x7,831 C(x) = 244,01x6 - 603,47x5 + 707,67x4 - 473,04x3 + 185,06x2 - 39,621x + 3,597 0,0 0,5 1,0 1,5 2,0 2,5 3,0 3,5 4,0 0,45 0,5 0,55 0,6 0,65 0,7 0,75 0,8
Crack Length, (a+8)/W
Compliance, C(PLT-13) mm/kN C13(W=19) 13-1 13-2 13-3 Figure 2
APPENDIX C3(3) The trend for the experimental points, which are shown in Figure 2, is characterised by Equation 1 in the exponential form and then expressed as Polynom Ci(x):
Ci = 244,01(a/W)6 - 603,47(a/W)5 + 707,67(a/W)4 - 473,04(a/W)3 +
+ 185,06(a/W)2 - 39,621(a/W) + 3,597 . (7) Based on Eq.7 the function dC/d(a/W) is determined (Figure 3):
dCi/d(a/W) = 1464,1(a/W)5- 3017,4(a/W)4 + 2830,7(a/W)3 –
- 1419,1(a/W)2 + 370,12(a/W) - 39,621 (8) dC/d(a/W) = 1464,1x5 - 3017,4x4 + 2830,7x3 - 1419,1x2 + 370,12x - 39,621 0 5 10 15 20 25 30 0,45 0,50 0,55 0,60 0,65 0,70 0,75 0,80 a/W dC/d(a/W) Figure 3
dCi/d(a/W) as a function of crack length a/W.
Substituting Eq.8 and E = 97 000 MPa in Eq.4 the geometry correction factor is obtained for the specimens PLT-13 :
f13(a/W) = 46,6243(a/W)5 - 117,9033(a/W)4 + 275,2862(a/W)3
-- 137,2754(a/W)2 + 40,6353(a/W) - 4,9534. (9) The same procedure of the compliance measurements performed for specimens PLT-9 gives
f9(a/W) = 3281,444(a/W)5 - 9918,190(a/W)4 + 12626,875(a/W)3
-- 8217,676(a/W)2 + 2722,718(a/W) - 364,772. (10) Geometry correction factor f(ai/W)
y = 46,6243x5 - 117,9033x4 + 275,2862x3 - 137,2754x2 + 40,6353x - 4,9534 10 15 20 25 30 35 40 0,50 0,55 0,60 0,65 0,70 0,75 0,80
Crack length, a/W
Geometry factor f(a/W)
f13(a/W)
Figure 4
A dimensionless geometry correction factor f(a/W) for specimen PLT-13 (length = 13 mm) and OD = 9.50 mm.
APPENDIX D.1 (1)
PLT-DHC Summary
Specimen Test temp Test temp DHC-crack Incubation time Cracking time DHC veloc
(°C) 1000x(K–1) (mm) (min) (min) (m/s) 13-4 247,9 1,919643714 2,36 24 1398,00 2,8E-08 13-5 249,5 1,913875598 1,606 119 1032,50 2,6E-08 13-6 249,9 1,912411551 2,357 30 1294,00 3,0E-08 9-4 250,2 1,911314985 1,709 21 962,00 3,0E-08 9-5 248,1 1,919017463 2,123 14 1324,00 2,7E-08 9-6 251,1 1,908032818 1,584 19 875,00 3,0E-08
after incubation (af-ao)/(Vf -Vo)
Specimen K initial K final ∆K DHC veloc Vo Vf DCPD-factor
(MPa·m1/2) (MPa·m1/2) (MPa·m1/2) (m/s) (V) (V) (mm/mV)
13-4 16,1 31,3 15,2 2,8E-08 0,01994 0,02068 3,190 13-5 24,5 37,1 12,6 2,6E-08 0,02119 0,02192 2,192 13-6 18,4 35,0 16,6 3,0E-08 0,02027 0,02101 3,183 9-4 11,7 25,9 14,2 3,0E-08 0,02056 0,02156 1,704 9-5 12,3 33,6 21,3 2,7E-08 0,02138 0,0226925 1,613 9-6 11,3 23,9 12,6 3,0E-08 0,02235 0,02333144 1,608 Specimens 13 mm Ki =Pi/(20*t*(10*W)^0,5)*f(a/W) f(a/W) = 46,6243x5 - 117,9033x4 + 275,2862x3 - 137,2754x2 + 40,6353x - 4,9534
13-4 Specimen Crack Length : Effective f(a/W) Ki (Mpam-1/2)
t (mm) 0,565 Notch (mm) 1,604 9,91 10,2
W (mm) 19 Fatigue crack (mm) 2,982 15,68 16,1
PDHC(N) 160 DHC-crack (mm) 2,360 -
-Final crack (mm) 5,342 30,50 31,3
13-5 Specimen Crack Length : Effective f(a/W) Ki (Mpam-1/2)
t (mm) 0,565 Notch (mm) 2,182 12,10 12,4
W (mm) 19 Fatigue crack (mm) 4,415 23,85 24,5
PDHC(N) 160 DHC-crack (mm) 1,606 -
-Final crack (mm) 6,021 36,15 37,1
13-6 Specimen Crack Length : Effective f(a/W) Ki (Mpam-1/2)
t (mm) 0,565 Notch (mm) 2,086 11,72 12,0 W (mm) 19 Fatigue crack (mm) 3,424 17,94 18,4 PDHC(N) 160 DHC-crack (mm) 2,357 - -Final crack (mm) 5,781 34,07 35,0 Specimens 9 mm Ki =Pi/(20*t*(10*W)^0,5)*f(a/W) f(a/W) = 3281,444x5 - 9918,190x4 + 12626,875x3 - 8217,676x2 + 2722,718x - 364,772
9-4 Specimen Crack Length : Effective f(a/W) Ki (Mpam-1/2)
t (mm) 0,565 Notch (mm) 1,222 8,53 6,8
W (mm) 15 Fatigue crack (mm) 2,370 14,71 11,7
PDHC(N) 110 DHC-crack (mm) 1,679 -
-Final crack (mm) 4,049 32,57 25,9
9-5 Specimen Crack Length : Effective f(a/W) Ki (Mpam-1/2)
t (mm) 0,565 Notch (mm) 1,216 8,51 6,0
W (mm) 15 Fatigue crack (mm) 1,990 12,29 8,7
PDHC(N) 110 DHC-crack (mm) 2,123 -
-Final crack (mm) 4,112 33,56 23,7
9-6 Specimen Crack Length : Effective f(a/W) Ki (Mpam-1/2)
t (mm) 0,565 Notch (mm) 1,165 8,30 5,9
W (mm) 15 Fatigue crack (mm) 2,548 16,00 11,3
PDHC(N) 110 DHC-crack (mm) 1,584 -
APPENDIX E.1 (18)
Specimen 9-4
9-4 Specimen Crack Length : Effective f(a/W) Ki (Mpam-1/2)
t (mm) 0,565 Notch (mm) 1,222 8,53 6,8
W (mm) 15 Fatigue crack (mm) 2,370 14,71 11,7
PDHC(N) 110 DHC-crack (mm) 1,679 -
APPENDIX E.2 (18) Specimen 9-4
PLT-specimen 9-4 Date: October 2000
Crack Length Surface Measurements (Side 1):
PHOTO 1 Notch Fatigue Crack DHC crack aN(1) ao(1) adhc(1) Position (mm) (mm) (%) (mm) (%) 1 80,5 148,5 -3,6 259 0,0 Length at photo 1 (mm) 268 2 81 150 -2,6 264 1,9 Length at specimen (mm) 4,260 3 81 152 -1,3 267 3,0 4 81,5 153,5 -0,3 268 3,4 Side 1: 5 81,5 154,5 0,3 267 3,0 Notch (mm) aN(1) 1,2964 6 82 155,5 1,0 264 1,9 Fatigue crack (mm) ao(1) 2,4479 7 82 156,5 1,6 257 -0,8 DHC crack (mm) adhc(1) 1,6708 8 82 157,5 2,3 247 -4,7 Final crack (mm) af(1) 4,1187 9 82,5 158 2,6 239 -7,8 Average 81,56 154 259,11
Crack Length Surface Measurements (Side 2):
PHOTO 2 Notch Fatigue Crack DHC crack aN(2) ao(2) adhc(2)
Position (mm) (mm) (%) (mm) (%) Reference length (RL):
1 75 149 2,6 235 -6,8 RL at photo 2 (mm) 259 2 74 148 1,9 246 -2,4 RL at specimen (mm) 4,087 3 74 147,5 1,5 253 0,3 4 73 146,5 0,8 257 1,9 Side 2: 5 73 146 0,5 259 2,7 Notch (mm) aN(2) 1,147 6 72 145 -0,2 258,5 2,5 Fatigue crack (mm) ao(2) 2,2925 7 71,5 143,5 -1,2 257,5 2,1 DHC crack (mm) adhc(2) 1,6867 8 71 142 -2,3 254,5 0,9 Final crack (mm) af(2) 3,9792 9 70,5 140 -3,6 249 -1,3 Average 72,67 145,278 252,17
Specimen Crack Length : Side 1 Side 2 Effective
Notch (mm) 1,296 1,147 1,222
Fatigue crack (mm) 2,448 2,292 2,370
DHC-crack (mm) 1,671 1,687 1,679
APPENDIX E.3 (18) Specimen 9-4
Specimen 9-4: Temperature during DHC-test
26 26,1 26,2 26,3 26,4 26,5 26,6 26,7 26,8 26,9 27 0 10000 20000 30000 40000 50000 60000 70000 Time (s) Room temperature (°C) 245 246 247 248 249 250 251 252 253 254 255 Specimen temperature (°C) Room (°C) Specimen (°C)
Specimen 9-4: DCPD and Load during DHC-test
-10 10 30 50 70 90 110 130 150 -5000 5000 15000 25000 35000 45000 55000 65000 Time (s) Load (N) 0,0205 0,0206 0,0207 0,0208 0,0209 0,021 0,0211 0,0212 0,0213 0,0214 0,0215 0,0216 DCPD (V) Load (N) DCPD (V)
APPENDIX E.4 (18)
Specimen 9-5
9-5 Specimen Crack Length : Effective f(a/W) Ki (Mpam-1/2)
t (mm) 0,565 Notch (mm) 1,216 8,51 6,0
W (mm) 15 Fatigue crack (mm) 1,990 12,29 8,7
PDHC(N) 110 DHC-crack (mm) 2,123 -
APPENDIX E.5 (18) Specimen 9-5
PLT-specimen 9-5 Date: October 2000
Crack Length Surface Measurements (Side 1):
PHOTO 1 Notch Fatigue Crack DHC crack aN(1) ao(1) adhc(1)
Position (mm) (mm) (%) (mm) (%) Reference length (RL):
1 83 88 -22,2 247 -2,0 RL at photo 1 (mm) 261,5 2 84 97 -14,2 255 1,1 RL at specimen (mm) 3,944 3 84,5 107 -5,4 261 3,5 4 85 113 -0,1 261,5 3,7 Side 1: 5 85,5 117 3,4 260,5 3,3 Notch (mm) aN(1) 1,287 6 86 120 6,1 258 2,3 Fatigue crack (mm) ao(1) 1,706 7 86,5 123 8,7 252 0,0 DHC crack (mm) adhc(1) 2,0964 8 86,5 126 11,4 241 -4,4 Final crack (mm) af(1) 3,8024 9 87 127 12,3 233 -7,6 Average 85,33 113,111 252,11
Crack Length Surface Measurements (Side 2):
PHOTO 2 Notch Fatigue Crack DHC crack aN(2) ao(2) adhc(2)
Position (mm) (mm) (%) (mm) (%) Reference length (RL):
1 71,5 142 4,7 239 -9,4 RL at photo 2 (mm) 276 2 71 141 3,9 252 -4,5 RL at specimen (mm) 4,625 3 70 140 3,2 264 0,0 4 69 138 1,7 272 3,1 Side 2: 5 68 136 0,2 275 4,2 Notch (mm) aN(2) 1,144 6 67,5 134 -1,2 276 4,6 Fatigue crack (mm) ao(2) 2,2734 7 66,5 132 -2,7 274 3,8 DHC crack (mm) adhc(2) 2,1487 8 66 130 -4,2 267 1,2 Final crack (mm) af(2) 4,4221 9 65 128 -5,7 256 -3,0 Average 68,28 135,667 263,89
Specimen Crack Length : Side 1 Side 2 Effective
Notch (mm) 1,287 1,144 1,216
Fatigue crack (mm) 1,706 2,273 1,990
DHC-crack (mm) 2,096 2,149 2,123
APPENDIX E.6 (18) Specimen 9-5
Specimen 9-5: Temperature during DHC-test
246 247 248 249 0 50000 100000 150000 200000 250000 Time (s) Specimen temperature (°C) 25 26 27 28 Room temperature (°C) Specimen (°C) Room (°C)
Specimen 9-5: DCPD and Load during DHC-test
0 20 40 60 80 100 120 140 20500 30500 40500 50500 60500 70500 80500 90500 100500 Time (s) Load (N) 0,0213 0,0218 0,0223 0,0228 DCPD (V) Load (N) DCPD (V)
APPENDIX E.7 (18)
Specimen 9-6
9-6 Specimen Crack Length : Effective f(a/W) Ki (Mpam-1/2)
t (mm) 0,565 Notch (mm) 1,165 8,30 5,9
W (mm) 15 Fatigue crack (mm) 2,548 16,00 11,3
PDHC(N) 110 DHC-crack (mm) 1,584 -
APPENDIX E.8 (18) Specimen 9-6
PLT-specimen 9-6 Date: October 2000
Crack Length Surface Measurements (Side 1):
PHOTO 1 Notch Fatigue Crack DHC crack
aN(1) ao(1) adhc(1)
Position (mm) (mm) (%) (mm) (%) Reference length (RL):
1 73 154 -3,3 259 -0,1 RL at photo 1 (mm) 265 2 74 156 -2,1 262,5 1,3 RL at specimen (mm) 4,186 3 74 158 -0,8 264,5 2,1 4 74,5 159 -0,2 265 2,3 Side 1: 5 75 160 0,5 264,5 2,1 Notch (mm) aN(1) 1,1768 6 75 161 1,1 262 1,1 Fatigue crack (mm) ao(1) 2,516 7 75 161,5 1,4 258 -0,5 DHC crack (mm) adhc(1) 1,5779 8 75 162 1,7 252 -2,8 Final crack (mm) af(1) 4,0939 9 75 162 1,7 245 -5,5 Average 74,50 159,278 259,17
Crack Length Surface Measurements (Side 2):
PHOTO 2 Notch Fatigue Crack DHC crack
aN(2) ao(2) adhc(2)
Position (mm) (mm) (%) (mm) (%) Reference length (RL):
1 71 157 2,4 230 -7,2 RL at photo 2 (mm) 255,5 2 70,5 156,5 2,0 236 -4,8 RL at specimen (mm) 4,298 3 70 155,5 1,4 243 -2,0 4 69,5 154,5 0,7 256 3,2 Side 2: 5 68,5 153,5 0,1 254,5 2,6 Notch (mm) aN(2) 1,153 6 68 152,5 -0,6 255,5 3,0 Fatigue crack (mm) ao(2) 2,5803 7 67,5 151,5 -1,2 255,5 3,0 DHC crack (mm) adhc(2) 1,5906 8 66,5 150,5 -1,9 253 2,0 Final crack (mm) af(2) 4,1709 9 65,5 149 -2,9 248 0,0 Average 68,56 153,389 247,94
Specimen Crack Length : Side 1 Side 2 Effective
Notch (mm) 1,177 1,153 1,165
Fatigue crack (mm) 2,516 2,580 2,548
DHC-crack (mm) 1,578 1,591 1,584
APPENDIX E.9 (18) Specimen 9-6
Specimen 9-6: Temperature during DHC-test
245 246 247 248 249 250 251 252 253 254 255 0 10000 20000 30000 40000 50000 60000 70000 80000 Time (s) Specimen temperature (°C) 23 24 25 26 27 28 29 30 31 32 33 Room temperature (°C) Specimen (°C) Room (°C)
Specimen 9-6: Load and DCPD during DHC-test
0 10 20 30 40 50 60 70 80 90 100 110 120 130 140 150 20000 30000 40000 50000 60000 70000 80000 Time (s) Load (N) 0,0222 0,0223 0,0224 0,0225 0,0226 0,0227 0,0228 0,0229 0,023 0,0231 0,0232 0,0233 0,0234 DCPD (V) Load (N) DCPD (V)
APPENDIX E.10 (18)
Specimen 13-4
13-4 Specimen Crack Length : Effective f(a/W) Ki (Mpam-1/2)
t (mm) 0,565 Notch (mm) 1,604 9,91 10,2
W (mm) 19 Fatigue crack (mm) 2,982 15,68 16,1
PDHC(N) 160 DHC-crack (mm) 2,360 -
APPENDIX E.11 (18) Specimen 13-4
PLT-specimen 13-4 Date: October 2000
Crack Length Surface Measurements (Side 1):
PHOTO 1 Notch Fatigue Crack DHC crack aN(1) ao(1) adhc(1)
Position (mm) (mm) (%) (mm) (%) Reference length (RL):
1 81,5 152 -3,0 258 -4,3 RL at photo 1 (mm) 278 2 82 153 -2,4 272 0,9 RL at specimen (mm) 5,895 3 82,5 154,5 -1,5 276 2,3 4 83 156,5 -0,2 278 3,1 Side 1: 5 83,5 157,5 0,5 278 3,1 Notch (mm) aN(1) 1,7671 6 84 158,5 1,1 277 2,7 Fatigue crack (mm) ao(1) 3,3245 7 84 159,5 1,7 273 1,2 DHC crack (mm) adhc(1) 2,3938 8 84,5 159,5 1,7 264 -2,1 Final crack (mm) af(1) 5,7183 9 85 160 2,1 251 -6,9 Average 83,33 156,778 269,67
Crack Length Surface Measurements (Side 2):
PHOTO 2 Notch Fatigue Crack DHC crack aN(2) ao(2) adhc(2)
Position (mm) (mm) (%) (mm) (%) Reference length (RL):
1 77 141 2,1 236 -9,1 RL at photo 2 (mm) 269,5 2 77 141 2,1 249 -4,1 RL at specimen (mm) 5,153 3 76,5 140,5 1,8 258 -0,7 4 76 140 1,4 266 2,4 Side 2: 5 75,5 139 0,7 269 3,6 Notch (mm) aN(2) 1,441 6 75 137,5 -0,4 269,5 3,8 Fatigue crack (mm) ao(2) 2,6397 7 74,5 136 -1,5 269 3,6 DHC crack (mm) adhc(2) 2,3263 8 74 134,5 -2,6 266 2,4 Final crack (mm) af(2) 4,966 9 73 133 -3,7 255 -1,8 Average 75,39 138,056 259,72
Specimen Crack Length : Side 1 Side 2 Effective
Notch (mm) 1,767 1,441 1,604
Fatigue crack (mm) 3,324 2,640 2,982
DHC-crack (mm) 2,394 2,326 2,360
APPENDIX E.12 (18) Specimen 13-4
Specimen 13-4: Temperature during DHC-test
240 241 242 243 244 245 246 247 248 249 250 0 10000 20000 30000 40000 50000 60000 70000 80000 90000 Time (s) Specimen temperature (°C) 22 23 24 25 26 27 28 29 30 31 32 Room temperature (°C) Specimen (T°C) Room (°C)
Specimen 13-4: Load and DCPD during DHC-test
0 20 40 60 80 100 120 140 160 180 200 -10000 0 10000 20000 30000 40000 50000 60000 70000 80000 90000 Time (s) Load (N) 0,0199 0,0200 0,0201 0,0202 0,0203 0,0204 0,0205 0,0206 0,0207 DCPD (V) Load (N) DCPD (V)
APPENDIX E.13 (18)
Specimen 13-5
13-5 Specimen Crack Length : Effective f(a/W) Ki (Mpam-1/2)
t (mm) 0,565 Notch (mm) 2,182 12,10 12,4
W (mm) 19 Fatigue crack (mm) 4,415 23,85 24,5
PDHC(N) 160 DHC-crack (mm) 1,606 -
APPENDIX E.14 (18) Specimen 13-5
PLT-specimen 13-5 Date: October 2000
Crack Length Surface Measurements (Side 1):
PHOTO 1 Notch Fatigue Crack DHC crack aN(1) ao(1) adhc(1)
Position (mm) (mm) (%) (mm) (%) Reference length (RL):
1 94 186 -2,1 255 -2,3 RL at photo 1 (mm) 266,5 2 94 187 -1,6 261 0,0 RL at specimen (mm) 6,122 3 94,5 188 -1,0 264,5 1,3 4 95 189 -0,5 266 1,9 Side 1: 5 95 190,5 0,3 266,5 2,1 Notch (mm) aN(1) 2,1849 6 95,5 191,5 0,8 266 1,9 Fatigue crack (mm) ao(1) 4,3634 7 96 192 1,1 263 0,7 DHC crack (mm) adhc(1) 1,6348 8 96 192,5 1,3 257 -1,6 Final crack (mm) af(1) 5,9982 9 96 193 1,6 251 -3,9 Average 95,11 189,944 261,11
Crack Length Surface Measurements (Side 2):
PHOTO 2 Notch Fatigue Crack DHC crack aN(2) ao(2) adhc(2)
Position (mm) (mm) (%) (mm) (%) Reference length (RL):
1 92,5 189,5 1,5 242 -4,3 RL at photo 2 (mm) 258,5 2 92,5 189 1,2 247 -2,3 RL at specimen (mm) 6,181 3 92 188,5 0,9 254 0,5 4 91,5 188 0,7 257 1,7 Side 2: 5 91 187 0,1 258,5 2,3 Notch (mm) aN(2) 2,180 6 91 186,5 -0,1 258 2,1 Fatigue crack (mm) ao(2) 4,466 7 90,5 185,5 -0,7 256,5 1,5 DHC crack (mm) adhc(2) 1,5781 8 90 184 -1,5 254 0,5 Final crack (mm) af(2) 6,0442 9 89,5 183 -2,0 248 -1,9 Average 91,17 186,778 252,78
Specimen Crack Length : Side 1 Side 2 Effective
Notch (mm) 2,185 2,180 2,182
Fatigue crack (mm) 4,363 4,466 4,415
DHC-crack (mm) 1,635 1,578 1,606
APPENDIX E.15 (18) Specimen 13-5
Specimen 13-5: Temperature during DHC-test
242 243 244 245 246 247 248 249 250 251 252 0 10000 20000 30000 40000 50000 60000 70000 Time (s) Specimen temperature (°C) 20 21 22 23 24 25 26 27 28 29 30 Specimen (°C) Room (°C)
Specimen 13-5: Load and DCPD during DHC-test
0 20 40 60 80 100 120 140 160 180 200 0 18000 36000 54000 72000 Time (s) Load (N) 0,0210 0,0211 0,0212 0,0213 0,0214 0,0215 0,0216 0,0217 0,0218 0,0219 0,0220 DCPD (V) Load (N) DCPD (V)
APPENDIX E.16 (18)
Specimen 13-6
13-6 Specimen Crack Length : Effective f(a/W) Ki (Mpam-1/2)
t (mm) 0,565 Notch (mm) 2,086 11,72 12,0
W (mm) 19 Fatigue crack (mm) 3,424 17,94 18,4
PDHC(N) 160 DHC-crack (mm) 2,357 -
APPENDIX E.17 (18) Specimen 13-6
PLT-specimen 13-6 Date: October 2000
Crack Length Surface Measurements (Side 1):
PHOTO 1 Notch Fatigue Crack DHC crack aN(1) ao(1) adhc(1)
Position (mm) (mm) (%) (mm) (%) Reference length (RL):
1 87,5 143 -3,2 253 -1,5 RL at photo 1 (mm) 262 2 88 144,5 -2,2 257 0,0 RL at specimen (mm) 6,159 3 88,5 146 -1,2 261 1,6 4 89 147,5 -0,2 262 2,0 Side 1: 5 89 148,5 0,5 262 2,0 Notch (mm) aN(1) 2,0935 6 89,5 149,5 1,2 261 1,6 Fatigue crack (mm) ao(1) 3,4739 7 90 150 1,5 258 0,4 DHC crack (mm) adhc(1) 2,5649 8 90 150,5 1,8 253 -1,5 Final crack (mm) af(1) 6,0388 9 90 150,5 1,8 245 -4,6 Average 89,06 147,778 256,89
Crack Length Surface Measurements (Side 2):
PHOTO 2 Notch Fatigue Crack DHC crack aN(2) ao(2) adhc(2)
Position (mm) (mm) (%) (mm) (%) Reference length (RL):
1 95 155 2,5 236 -4,6 RL at photo 2 (mm) 253 2 94,5 154,5 2,2 243 -1,8 RL at specimen (mm) 5,647 3 94 154 1,9 249 0,6 4 93,5 153 1,2 252 1,8 Side 2: 5 93 151,5 0,2 253 2,2 Notch (mm) aN(2) 2,079 6 92,5 150 -0,8 253 2,2 Fatigue crack (mm) ao(2) 3,3741 7 92,5 149 -1,4 251 1,4 DHC crack (mm) adhc(2) 2,1489 8 92 147,5 -2,4 248 0,2 Final crack (mm) af(2) 5,523 9 91,5 146 -3,4 242 -2,2 Average 93,17 151,167 247,44
Specimen Crack Length : Side 1 Side 2 Effective
Notch (mm) 2,093 2,079 2,086
Fatigue crack (mm) 3,474 3,374 3,424
DHC-crack (mm) 2,565 2,149 2,357
APPENDIX E.18 (18) Specimen 13-6
Specimen 13-6: Temperature during DHC-test
243 244 245 246 247 248 249 250 251 252 253 0 10000 20000 30000 40000 50000 60000 70000 80000 90000 Time (s) Specimen Temperature (°C) 22 23 24 25 26 27 28 29 30 31 32 Room temperature (°C) Specimen (°C) Room (°C)
Specimen 13-6: Load and DCPD during DHC-test
0 20 40 60 80 100 120 140 160 180 200 0 10000 20000 30000 40000 50000 60000 70000 80000 90000 Time (s) Load (N) 0,0202 0,0203 0,0204 0,0205 0,0206 0,0207 0,0208 0,0209 0,0210 0,0211 DCPD (V) Load (N) DCPD (V)