Preface
This dissertation is the final part of the Master of Science programme in Industrial Engineering and Management at Lund University, Faculty of Engineering. The dissertation corresponds to 30 ECT Credits during a period of 20 weeks. The original idea and project specification for the dissertations topic came from Tetra Pak, Capital Equipment, Total Quality and the main part of the work has been conducted in their Facilities in Lund.
First we would like to thank our instructors at Tetra Pak, Adam Smith, Director Total Quality and Clara Carlsson, Manager Total Quality Supplier Management. They have helped us to regain focus when the road has been winding and supported us with both time and resources. We would also like to thank the rest of the Total Quality department that took care of us with open arms. A thought is also sent to all the helpful people at Tetra Pak who have spent their valuable time to answer our questions in interviews and build and validate models. Another person that we want to express our gratitude to is Niclas Hanzon, Claims Engineer at Market Area Nordics, who have made huge contributions to this dissertation. We are very glad that we got the opportunity to conduct this dissertation at a world leading company in its field.
We would also like to thank our tutor at the Department of Industrial Management and Logistics and the Division of Production Management, Lund University, Bertil I Nilsson for the help with the academic part of this Dissertation and support and smoothness of all administrative matters. Few people are more helpful and supporting, no matter what day or hour it is.
Lund, January 2009 Magnus Fransson Klas Turesson
Abstract
Contemporary business trends are more and more shifting focus to the requirements of the customers. One of the most important factors for the customer is quality, both in the interface with the selling company and in the products sold. Tetra Pak is a pioneer within the packaging of diaries and food. The company has been profitable in most situations which have created a state of mind where quality in the supply chain has not been a top priority. As competition has become more intense, Tetra Pak has realised the importance of quality and put it high on the agenda. In order to make good decisions that can improve quality the company needs an understanding of the current situation.
The purpose of this dissertation is to find the cost of poor quality and increase the transparency of quality in Tetra Pak Capital Equipment (CE) supply chain. With this as base, recommendations for improvements are given. Tetra Pak CE is responsible for the production, supply and installation of Filling Machines and Distribution Equipment. The cost calculation has been done with a supply chain perspective and focus has been set in the area that was considered to create most costs. The areas chosen were products that failed to conform with specification, both internally and externally. In Tetra Pak the internal of these are called Non Conformities and the external are called Claims. The main sources of data in this dissertation has been, nearly 50 interviewed employees and internal data regarding the area investigated. From this the most important processes has been mapped and cost calculations conducted with a triangulation of Activity Based Costing (ABC) analysis, Top Down analysis and estimations from the persons interviewed. The outcome of the cost calculations can unfortunately not be published in this academic report due to company restrictions, but it can be reviled that it is more that twelve times more expensive to find failures outside the company than internally. It became apparent during the investigation that it is only a minor part of the current supply chain costs of poor quality that can be seen within the company, and little costs are transferred to the suppliers, unless they are obliged by Tetra Pak to conduct special investigations. When the findings above were investigated it was concluded that the supply chain currently has a very low transparency. Information about poor quality is scattered in several systems and the impact of low quality on customer does not reach those who decides what corrective actions to take. The main instrument to prioritise is currently the number of incoming claims. To improve this area a customer claims related cost model has been developed with the intention to bring a better understanding of the customer impact into the organisation and aid prioritisation of corrective actions.
To further increase the customer perspective in the company it is suggested that a new measurement that capture the impact of claims at the customers is formed. The current quality measurements is considered to have several flaws in order to truly align with the corporate strategy and in some instance the formulation might even prevent registrations of claims and therefore limit the information to the central organisation. A divergence in the purpose of the claims process has been seen. This leads to the recommendation that the process should be separated into one part that is concerned with handling and compensating the customer and one part that is concerned with solving the technical issue. To further improve the information, a centralisation of the claim handling near the customer is recommended.
Sammanfattning
I dagens affärsvärld blir kundens önskemål och krav allt viktigare. Ett av de viktigaste kundkraven är vanligtvis kvalitet, både gällande mötet med det säljande bolaget och i kvaliteten på dess produkter. Tetra Pak är en pionjär inom förpackningsindustrin. Företaget har ständigt haft sunda finanser och goda vinster vilket har resulterat i en företagskultur där kvalitet i försörjningskedjan inte varit högprioriterat. Tack vare en hårdare konkurrens har Tetra Pak insett vikten av hög kvalitet och därför numer satt det högt på agendan. För att kunna ta goda beslut som kan förbättra kvalitén behövs en god grundförståelse av hur situationen egentligen ser ut för närvarande.
Syftet med detta examensarbete är att hitta kostnaden för kvalitetsbrister samt att kartlägga hur kvalitetsarbetet utförs och mäts idag på Tetra Pak Capital Equipment. Med detta som grund kommer sedan rekommendationer ges för förbättringar inom dessa områden. Tetra Pak CE är ansvariga för att fyllmaskiner och distributionsutrustning produceras och installeras hos kunderna. Beräkningarna är gjorda utifrån ett försörjningskedjeperspektiv och i det som undersöks har fokus lagts på de områden som anses skapa de största kvalitetsbristkostnaderna och där mest data kunde hittas. De valda områdena är då produkter inte överensstämt med specifikationerna, internt och externt. På Tetra Pak kallas dessa Non Conformities (produktionsfel funna internt) samt claims (reklamationer från kunder).
Huvudkällan till information i detta arbete är närmare 50 intervjuade personer samt intern data från Tetra Pak. Ur detta material har de viktigaste processerna kartlagts och utifrån dessa har kostnadsberäkningar gjorts med en triangulering av Aktivitetsbaserade kostnadskalkyler (ABC), ”Top Down”-kalkyler samt uppskattningar från de intervjuade. Tyvärr kan inte några exakta resultat publiceras i denna akademiska rapport på grund av sekretesskäl. Vad som kan sägas är dock att beräkningarna visar att det är över tolv gånger dyrare för Tetra Pak om ett fel upptäcks externt än internt. De blev även tydligt under undersökningen att det endast är en mindre del av kvalitetsbristkostnaderna som är synliga internt i företaget och en väldigt liten del av kostnaderna som uppstår överförs till leverantörerna. Åtminstone så länge Tetra Pak CE inte tvingar dem att vidta speciella åtgärder.
Tetra Pak CEs försörjningskedja har för närvarande väldigt låg transparens. Information om kvalitetsbrister är utspritt över ett flertal system och vetskapen om hur kvalitetsbrister påverkar kunden når inte in till de personer som beslutar om vilka åtgärder som ska vidtas för att komma tillrätta med problemen. Huvudinstrumentet för att prioritera åtgärder är idag antalet claim som har inkommit om ett visst problem. För att förbättra prioriteringen har en claimsrelaterad kundkostnadsmodell skapats med intentionen att skapa en bättre förståelse i företaget om vilka kostnader kunden påverkas av vid olika kvalitetsbrister.
För att fördjupa kundperspektivet i företagskulturen föreslås även ett nytt mätetal som mäter kundpåverkan vid claims. De nuvarande kvalitetsmätetalen anses ha flera brister, vilka gör att de inte stämmer överens med företagsstrategin. De kan till och med i vissa avseenden påverka antalet registrerade claims negativt och därför begränsa mängden information in i företaget.
Vidare har en divergens i uppfattningen om claims setts. Därför rekommenderas claimsprocessen att delas i en del som hanterar kunden och kundklagan och en som hanterar lösningen av problemet. För
Table of Contents
Preface... i
Abstract ...ii
Sammanfattning ...iii
Table of Contents ...iv
1 Exordium ... 1
1.1 Background ... 1
1.2 Problem description... 2
1.3 Target group... 3
1.4 Limitations/Delimitations ... 3
1.5 Purpose & Objectives... 4
1.6 Report outline ... 4
2 Methodology ... 7
2.1 Case study ... 7
2.2 The abductive approach ... 7
2.3 Qualitative and quantitative methodology... 8
2.4 Primary and secondary sources ... 8
2.5 Validity and reliability ... 9
2.6 Criticism of sources ... 10
2.7 Tetra Pak restricted material ... 11
3 Frame of Reference ... 12
3.1 What is quality? ... 12
3.2 Quality work... 15
3.3 Quality Costing ... 17
3.4 Overview of Quality costing models ... 19
3.5 PAF model ... 19
3.6 Process cost model ... 27
3.7 Activity-based costing (ABC) model ... 29
3.8 Incentives and design of measurement systems... 31
4.1 Tetra Pak, background and organisation ... 38
4.2 Total Quality in Tetra Pak... 44
4.3 The Claim Process ... 44
4.4 The Non Conformance (NC) Process... 56
4.5 Prioritisation and corrective actions ... 59
4.6 Case descriptions ... 61
4.7 Key Performance Index in Tetra Pak ... 65
5 Analysis... 68
5.1 Quality in Tetra Pak... 68
5.2 Quality Costing ... 70
5.3 Claims ... 74
5.4 Non Conformities ... 88
5.5 Corrective actions ... 91
5.6 Cost of failure of control compared to cost of control ... 92
5.7 Supply chain transparency ... 94
5.8 KPI ... 95
6 Discussion & Conclusions ... 98
7 References... 101
7.1 Literature ... 101
7.2 Articles ... 102
7.3 Interviewees... 104
7.4 Abbreviations and definitions... 106
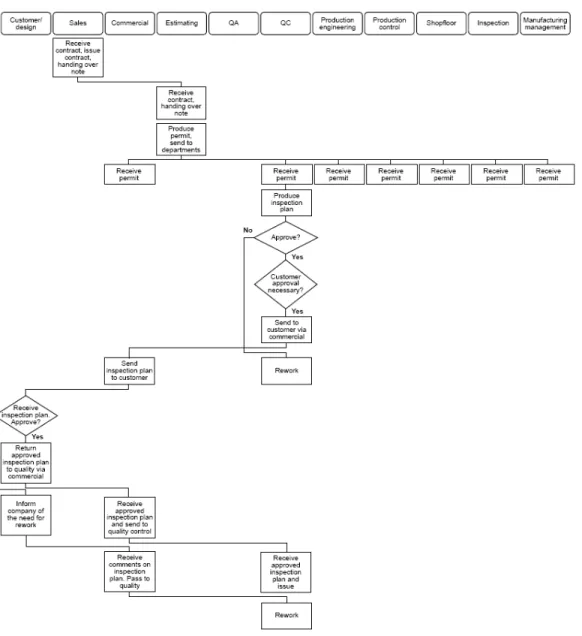
Appendix 1: Process charts over the claims process... 1
Appendix 2: Process charts over the NC process ... 5
Appendix 3: Customer claim-related cost model (CCRCM)... 7
Appendix 4: Activity Based Cost Model for CE Claims ... 8
Appendix 5: Activity Based Cost Model for NCs... 9
1
Exordium
In this chapter the dissertation is presented with its background and the authors’ goals and purposes. Also the delimitations and outline of the report is presented.
1.1
Background
Contemporary business trends concerning customer focus, work in processes and the realisation that the supply chain is not stronger than its weakest link, has stressed the need of quality. The globalised business context has led to massive outsourcing, resulting in more organisational boundaries where quality control and management becomes a challenging task. Much of the influences in the quality field origins from Japanese work methods like Kaizen, Kanban and Just-in-Time, which during the 1960-70 developed into an organisational quality management system. This system was based on how the individual can help to increase quality and in the same time decrease cost. In Japan this was called “Company Wide Quality Control” but in the West it was given the name “Total Quality Management (TQM)”.
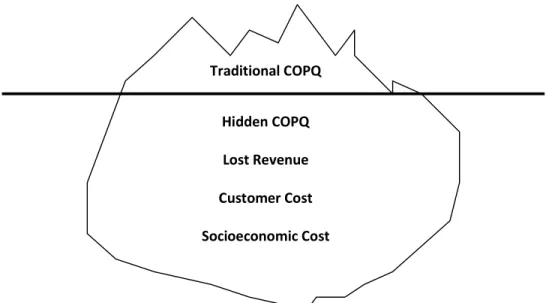
To get an impact and to make organisational members understand the value of quality it is sometimes better to present information in hard, cold monetary terms. When investigations about what poor quality actually cost an organisation are conducted they most often make a big impression. It might be convenient for most senior executives to believe that their organisation does not have a big problem with quality cost, since their quality issues is not bigger than any other in the industry. The truth is though that the Cost of Poor Quality (COPQ) most often has an enormous impact on an organisations turnover. In case studies conducted in the field, researchers have found that 5-30% of company turnover is spent on COPQ (Sörqvist 2001 p.43; Srivastava 2008 p.194; Giakatis 2001 p.182). Sörqvist (2001 p.43) though claim that the true cost are by far, much higher since hidden costs like lost sales, lost goodwill or customer cost seldom or never are included in these calculations. Therefore it can bring comparative advantages to minimise the COPQ.
The purpose of developing the types of cost calculations mentioned above is normally an action that is based in the corporate strategy in order to give the employees incentives to act in a specific way, simply because “what get measured gets done” (Anthony & Govindarajan 2003 p.494). To get employees to act in a certain way demands that their manager’s act as role models (Crosby 1979 p.18). To help management realise what impact the quality makes on the bottom line, COPQ naturally is a good way.
To illustrate this, the following story, adopted from Juran (1993), can be told. In the 1950s the Xerox Corporation revolutionised the copying industry. With patents they managed to get their own spot in the market and by leasing their copiers the company grew and made astonishing profits. Senior executives knew that the copiers broke down regularly but instead of addressing the quality issue they built up a very good service department. The service department earned Xerox even more profit so everyone at Xerox were happy. This was the case until patents expired and the competitors came in on the field. The Japanese build copiers that did the same things as Xerox did. They did not have a great service department. Their copier simply broke down less, so the customers preferred theirs instead. Since Xerox executive only used short term economic measures they simply did not realise that their customers were dissatisfied and ready to change to something else as soon as the
opportunity came. Many contemporary authors, as Robert Kaplan and David Norton, claim that in order to get good long term results and to reach corporate goals there has to be other measurements besides the financial. These measurements should be concluded out of the corporate strategy and provide adequate guidance for actions to create future financial value (Kaplan & Norton 1996).
1.2
Problem description
In the situation that Xerox were in, there are parallels to the current state at Tetra Pak. The food & beverage processing and packaging company have a dominant position on the market and control of almost 80% of the ambient white milk segment for example. They have had patents and almost monopoly positions in certain markets. Tetra Pak have been dedicated to produce innovative, system solutions. Well organised Service Departments have been set up, and the spare parts organisation can send articles within 24 hours with over 95% availability. Unfortunately there has not been any strong emphasis on quality. During the last few years senior management has started to realise that, in order to remain competitive in a growing market with new threats, they had to increase their customer focus. As a direct result of this, quality became more important and placed on the agenda. The business unit that construct and make sure that the filling machines are delivered is called Tetra Pak Capital Equipment (CE). Within this unit a department called Total Quality was formed and during 2007 this group was given a more central role and department Director Adam Smith started to report direct to Vice President Giovanni de Filippo. This centralisation was created since many issues that needed to be addressed concerning the filling machines quality were found. One problem for the Total Quality department was that in a profitable company the mindset and culture of the organisation results in that no one feels that they have to change their behaviour, work methods and processes in order to improve quality. If the gains can be shown in monetary terms or at least quantitatively they are much easier to understand. Therefore continuous improvement, that is one of the pillars in TQM, can be more compliant with cost measurements.
One problem for Tetra Pak has been that their suppliers have not had any real good incentives to improve quality. Naturally they have been contacted and sometimes audited when quality has not reached precipitated performance but they have low risks to get abolished from the Tetra Pak supplier base. Once they are in a relationship with Tetra Pak it most often become deep and problems that arise are regularly handled internally instead of turning to another supplier. Today the company is not able to share the understanding to their suppliers on what effects arise further downstream in the supply chain.
The company currently has two methods to collect costs regarding poor quality. The first is claims from customers. When Tetra Pak equipment breaks down at a customer site and still is under warrant, the customer has the possibility to get some direct losses covered from Tetra Pak. What is refunded depends on what is stated in the contract and what local regulations urge. Most often though this is much less than the true cost incurred. The second method to track down quality costs is Non Conformities (NC). In Tetra Pak vocabulary NC is a quality flaw that is found before the product has reached the customer. An NC can be either internal or supplier related. Until today, only the number of them has been used as a management tool, but now Tetra Pak CE want to know the cost of claims and NCs so that the cost can be used in a better way as a management tool, both
Another problem is if the strategic setup, the organisations infrastructure and the current way of working truly supports a quality mindset. One example of this is the way measurements concerning quality are carried out in the company. Tetra Pak is a leader of their field but as with the Xerox case this does not directly imply that they truly are the customer’s first choice.
The initial task to the authors was to study the cost of claims and especially the supplier-related claims. However early during the dissertation it was obvious that the cost of claims could not be handled separately. It had to be put in a broader context. This, together with the problem discussion led to two issues that needed to be clarified:
What is the cost of poor quality at Tetra Pak CE?
How are issues concerning poor quality handled and measured, and is this done in the best possible way to decrease the cost of poor quality?
1.3
Target group
The primary target group for this dissertation is managers and employees at Tetra Pak Capital Equipment and the dissertation is based on a task description from the managers of the Total Quality department at Tetra Pak CE. The secondary target group is scholars and students within the quality and economical management area.
1.4
Limitations/Delimitations
In this dissertation only the Tetra Pak Capital Equipment supply chain will be in focus and the part of the supply chain that will be given the most attention is Tetra Pak CE, their customers and suppliers. This is done due to the fact that the authors together with the supervisors has identified that the main part of the resulting cost of poor quality at Tetra Pak CE can be found there. Supplier internal transactions can be found in NC pictures in the dissertation for understanding purpose, but will not be analysed since it would be a dissertation in itself.
Currently Tetra Pak uses the main part of their efforts in the quality field in reactive action when products have failed to conform to specifications. Of the quality cost in Tetra Pak, the authors and the company instructors have made the assumption that the largest cost are created within the areas of failure of control. Therefore claims and NCs are in the main focus of this dissertation.
1.5
Purpose & Objectives
The purpose of this dissertation is to find the cost of poor quality at Tetra Pak Capital Equipment. With this information current Key Performance Indicators and the handling of quality flaws will be investigated and recommendations for improvements, that are in line with the corporate strategy and that gives the right incentives to those who are affected by it, will be made.
To clarify the purpose and make it more operational, it is broken down into five objectives:
• Explore where cost of poor quality can be found and suggest a framework for how to find quality cost
• Find an average cost of a claim
• Find an average cost of a NC
• Find an average cost of a corrective action
• Explore if the quality failure processes and the quality performance measurements support and drive good quality. If not, suggest improvements
1.6
Report outline
This report will have a fairly traditional outline with a theoretical review and a following empiric chapter that then is analysed and discussed in the end. See chapter 2.2 to get a deeper understanding on why this structure is chosen.
Methodology
This chapter explains the methodological considerations that made the base of this dissertation. It starts with a discussion regarding case studies and the abductive methodology. From this starting point an explanation of the research methods that are considered suitable from the authors’ point of view is conducted. The chapter ends with a discussion regarding validity, reliability and criticism of sources.
Theoretical framework
The theoretical framework is based on two blocks of theory. First come the quality block. This begins with descriptions of basic concepts of quality and well known models. Then the review goes deeper into concepts of quality costs, or more accurately the costs of poor quality, and how these costs should be measured. The second block concerns performance measurement and how such should be constructed. The theoretical review especially take up one specific concept called the balanced Scorecard (BSC) since this is the model currently used by Tetra Pak.
Empirics
In order to make it easier for the reader, the empirics and analysis are built with the same foundation and the authors has, as much as possible, tried to structure the material in the same order in the two chapters. The chapter will consist of five main parts.
The chapter will take off with a company presentation. Tetra Pak is a very large and complex organisation and though that the result of this dissertation, in large part, only will concern the business unit Capital Equipment the conclusions and recommendations will affect larger part of the company. In order to understand why, the company presentation is somewhat extensive.
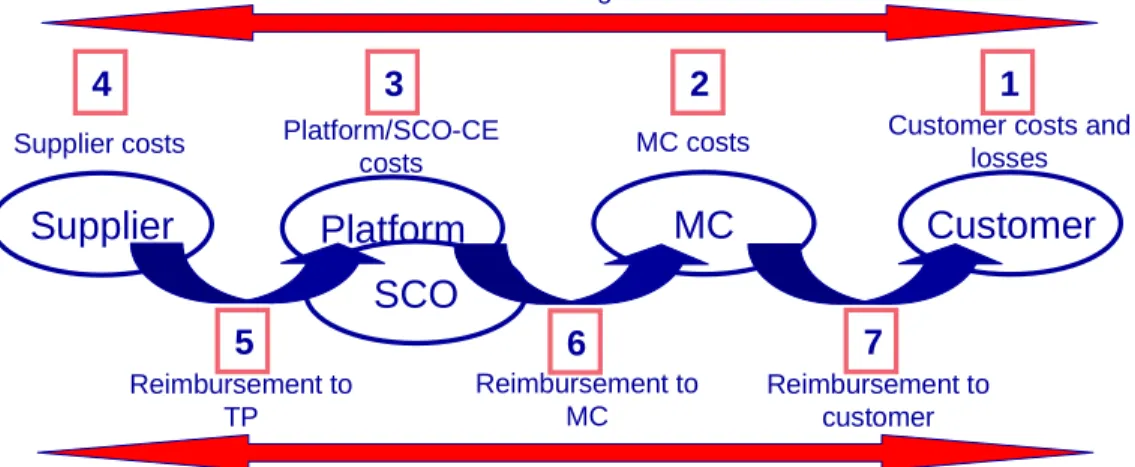
The second part is intended to unravel the paths and activities a claim goes through. The cost of claims is viewed from a supply chain perspective and the authors have acknowledged two dimensions that should be investigated in order to find how the supply chain is affected by the cost arising from claims. These are the actual costs that arise in the different organisations and the financial transactions that are made to reimburse organisations downstream. The specified costs can be seen in Figure 1 below.
MC
Customer
Platform
Supplier
SCO
Customer costs and losses Reimbursement to customer MC costs Reimbursement to MC Platform/SCO-CE costs Reimbursement to TP Supplier costs
7
6
5
1
2
3
4
Financial transactions Actual cost at organisationsFigure 1: Costs for claims along the supply chain
The third part concern NCs. The costs that are associated to NCs are presented in the same way as claims above. The only difference is that the quality flaw is found before the product has reached the customer which result in that fewer organisations need to be included. In Figure 2 below the costs that are associated to NCs are displayed.
Platform
Mod sup
SCO
Platform/SCO-CE costs Reimbursement to TP Supplier costs4
1
2
Financial transactions Actual cost at organisationsComp sup
3
Supplier internaltransactions
Corrective actions that are made in order to eradicate claims or NCs, is not done for all issues and can therefore not be integrated in the claim or NC chapters. This is why the corrective actions have got their own part in the empirics.
In the last empirical part Tetra Pak's current BSC and measurement systems will be explained to make the reader understand what environment suggested KPIs might be included in.
Analysis
In this section the outline will be basically the same as in the empiric chapter with the difference that it will start with a general analysis of the cost of poor quality and Tetra Pak and include summarising analyses and a study of the current cost and transparency in the supply chain.
Discussion & Conclusion
Here the most important findings in the analysis are brought together and a discussion of the most interesting results will lead to recommendations for how Tetra Pak can decrease their costs of poor quality and improve the way quality work is conducted from the authors’ point of view.
2
Methodology
In this chapter considerations concerning the research methods that was used during this master dissertation will be discussed. With the case study as foundation the authors explain why abductive and qualitative methods have been used and continues with an explanation of what sources have been used and why. The section ends with a discussion of validity, reliability and how criticism of the source has been handled.
2.1
Case study
This dissertation is a result of a request from Tetra Pak to investigate the matters that was described in the purpose above. Therefore it is natural to form this investigation as a case study. In case studies it is normal to form investigation entities in different levels in order to make analysis in lower levels and generalise the result for higher levels (Jacobsen 2002 p.96). For this project it could for example be one single claim or corrective action that is generalised to a special group of the type, which in turn is transferred and made as an example for the organisation. Brayman and Bell (2005 p.79) though warn that one has to be careful in this type of investigations since a result that is valid at one level might not be valid at another. The case study is a good method for describing a current situation and how that reflects the context the situation was generated from (Jacobsen 2002 p.95). The aim of the authors is therefore to conduct the first part of this dissertation as a descriptive investigation in order to move into an exploratory second part, in which performance measurements will be discussed and elaborated. Halvorsen (1992 p.84) describes the exploratory approach as good to use when broad insights and covering view is wanted. In the forming of performance measurements the authors sincerely believe that the exploratory approach is needed in order to elaborate all angles and consequences of suggested KPIs and recommendations. The generalisation of the cases studied at Tetra Pak might not be applicable globally but will hopefully have similarities with nearby industries.
2.2
The abductive approach
The aim of this case study is to investigate a chain of events in order to find a cost of poor quality and use this information in evaluating future and current KPIs. The search of a pattern that can be generalised is a characteristic of the inductive approach (Chalmers 1995; Johansson 2003). At the same time the goal of the authors is to use an existing frame of theories that is applied to the studied case. The use of theories as a base to analyse empiric facts is described as the deductive approach (Jacobsen 2002 p.34). According to Alvesson and Skjöldberg (1994 p.42) a mixture of these two approaches mentioned above is what most often is used in case studies. This mixture is called abduction. With this methodology the investigator can move back and forth through theory and empirics in a free way during the research. With this methodological aspect of the case study the authors can first investigate different empirical aspects in order to find appropriate theories that can be used to analyse the situation in an adequate manner. By this it will be easier to dig down and see beyond the first appearance of the case. To make it easier for the reader to follow the work this dissertation layout will though take the form of the deductive approach since it is more structured and easy to follow.
2.3
Qualitative and quantitative methodology
The purpose of this dissertation demanded that the authors had a thorough understanding of all processes and what could affect them. In the first phase of this dissertation this argument led to a use of qualitative methodology which creates a deeper understanding of a situation and the involved participants (Andersen 1998 p.31). With the qualitative approach, data handling and analysis can start already after the first interview in contrast to the quantitative approach were analysis can not start until all the data is gathered (Svenning 2003 p.74). For the dissertation’s short timeframe and the selected abductive methodology, instant handling of the material is essential and with the qualitative methodology the grindstones can start immediately.
To get a more reliable number for what a poor quality truly cost a quantitative approach is needed in the second phase, after the chain of events have been mapped, in order to find the costs in each step. Since Tetra Pak has thousands of machines with different contractual modes and physical settings, the variety that has to be considered in a statistical investigation would be enormous. To get more accurate estimations a triangulation methodology has been used were both statistics from the finance system, activity based calculations and personal estimations from the people involved are used.
2.4
Primary and secondary sources
The main sources of information for the empirics in this dissertation will be internal documents from Tetra Pak and interviews from its employees. During the entire period the authors have been stationed at Tetra Pak Packaging Solutions site in Lund. With this setup internal information, presentations and statistics have been available and easy accessible. It has also been easy to set up meetings with people close to the processes studied. One trip to the Tetra Pak site in Modena, Italy has also been made since some of the people that have good knowledge of the process are stationed there. As long as the processes are held within Tetra Pak, these sources are primary sources, which implies that no one has analysed or interpreted them before the authors have been able to see them (Bell 1995 p.65). If anyone interpret the empiric and then passes it on it is called a secondary source (Andersen 1998 p.150). This is the case for the material that comes from outside Tetra Pak. When information from outside the company has been required, the employee from Tetra Pak that is closes to the primary source has been contacted, however direct contact has been established with a limited number of specific customers and suppliers.
Interviews have been a main source of information in this case study and approximately 50 persons have been interviewed at least once. In the beginning the interviews were fairly open and the respondent were free to go in the directions which pleased him or her. The intention with this procedure was to gain as much information about the situation as possible. In order to get a full picture with this procedure, similar questions were repeated in different business units. Bell (1995 p.93) calls this methodology pilot interviews and the main purpose of these are to find themes and thoughts that can build a base for further investigations. When a knowledge base was gained, the interviews got more and more focused to make sure that all important areas were covered in accordance with Andersen (1998 p.162). When the interview questions became more specific, sensitive areas was covered that include corporate confidential areas, which can cause reluctance to reveal information. This was though considered to be a minor problem in this dissertation as the
tutors were needed to get access to information. The respondents were also assured that no restricted information would reach outside the company walls. Another risk with having a more structured interview approach is the risk of bias (Bell 1995 p.94). This risk is difficult to address and in this case the main way to prevent bias was to be aware of the problem and to strive for objectivity continually. Another point that has been considered before interviews is the importance of not asking leading questions in order to not get answers that are biased (Bryman & Bell 2005 p.396). This problem has been faced with an approach to the responding person based on openness. The questions have been of a kind that lets the person to make their own judgements and give their opinions on the matter discussed.
The theoretical sources in this dissertation mostly originate from articles in well known scientific publications found through Lund University search engine ELIN, books from the predecessors in the quality field such as Deming, Crosby and Feigenbaum and course literature from adjacent areas. Within the performance measurement area well known literature from Kaplan & Cooper and contemporary management literature was used. Important information has also been found through national standardisation organisations such as Swedish Standards Institute (SIS), British Standards Institution (BSI).
When searching scientific articles at ELIN a large variation and combination of focus words has been used. Some of the key words were; Cost of Poor Quality (COPQ), Cost of Quality, PAF, Total Quality Management (TQM), Quality management, Process analysis, Performance measurement, Designing/developing performance measurements, Supply Chain Performance.
The reader might notice that some references in the report include page numbers and some do not. This is because the authors made the decision to include page numbers in book references since many of those used have a very extensive volume. Hence those references without page numbers are articles or other sources if it has not been considered vital.
2.5
Validity and reliability
Validity, that is, the degree reality is captured, is often split up in two categories. Logical (internal) validity and construct (external) validity (Svenning 2003 p.65). The logical validity describes in what way the different parts of the investigation manages to capture the true nature of the matter and its ingoing parts (Svenning 2003 p.65). This dissertation came out of a task description from Tetra Pak and the main part of the work has been accomplished within the company walls with mandate from senior management. In this way employees have not been afraid that company secrets would be given away or that unauthorised people were able to see numbers and statistics not intended for them. Free access has been given to company material and all personnel have been more than willing to freely answer all questions asked. To get a full covering representation, all departments that are involved in the matter were permitted to give their picture. Also by starting the case study with open, unstructured interviews increase the logical validity since the respondents were allowed to give their version and explanation to the chain of events. The construct validity describes how the investigation as an entity can be generalised in an appropriate way (Svenning 2003 p.66). This type of validity has here been strengthened by having a thorough theoretical framework that is built on well known theories in its field. Furthermore the authors hope that the high number of interviews that has been conducted for this dissertation is enough to give a clear image of the situation so that good generalisations are possible. Having high validity is very important for the outcome of this report
since one of the goals is to find a KPI that is rooted in the company’s strategy and goals. If our dissertation has low validity, then the resulting calculations, KPIs and suggestions will be misguiding. Therefore continuous re-evaluations over validity have been conducted.
Reliability is normally described as how accurate the results are or how much coincidence can effect the conclusions (Andersen 1998 p.85). It must in this matter be pinpointed that this dissertation is not aimed at finding any exact numbers. One motto during the work has been:
“It’s better to measure approximately right than exactly wrong”
When measuring the cost of poor quality there are extremely many sources of errors. When a company as Tetra Pak has a wide variety of products and different ways to report these errors, it gets even worse. Because of this, focus has been on getting a deep understanding of the processes and its incentives in order to conclude good approximations and measurements that will promote appropriate behaviour. One measure that has been taken to increase reliability is a version of asking the same question on two occasions which is recommended by Bryman & Bell (2005 p.94). The version used here is that during the primary interviews the most important parts according to the authors have been revised and converted into a flowchart or a model. After this re-examinations have been done to see if the respondents were interpreted right and to investigate if the responses was the same as during the first meeting.
To conclude this discussion the authors wants to pinpoint that there might be pitfalls in claiming that a case study has a high degree of validity and reliability since it is only one case that is being studied. To get a higher validity a more rigorous benchmark study could have been conducted. It was though soon realised that the type of measurements conducted in this dissertation is not common in the local business environment. Therefore this dissertation is seen as, more or less, a pilot study for how quality costs can be measured and transferred into the daily work of the organisation.
2.6
Criticism of sources
The main part of the empirical data in this dissertation comes from within Tetra Pak. This can be a problem since commercial organisations tend to produce material that makes them look better. This is probably a more common problem for material that is intended for people outside the company. The largest part of the material used for this dissertation is material that is intended for internal use which makes it less distorted. In analysing and valuing the material for this dissertation, Scott’s criterions have been used as they are described of Bryman and Bell (2005 p.425):
• Authenticy. Is the material genuine and of unambiguous sources?
• Credibility. Is the material flawless and free from distortions?
• Representativity. Is the material representative considering its origin? If not, in what degree does it differ?
• Meaningfulness. Is the material clear and comprehensible?
In addition to the points above the usability of the material has been judged in the environment in which it was created; the roll of the creator, its purpose, whom it was intended for and the age of the
Before interviews the respondent’s role in the organisation has been clarified in order to understand in which context the person acts. This is important in order to understand how the reality looks different from someone’s perspective to another’s. It might be inappropriate to approach them in the same way if they are in very different organisational and environmental contexts. Since multiple sources that say the same thing are more reliable (Bell 1995 p.68), multiplicity has been a goal in all the empirics.
2.7
Tetra Pak restricted material
Much of the information reviewed for this dissertation is company internal material. Due to this, the information that can be viewed here, that is considered classified, has been masked. All financial numbers are for example represented of Tetra Pak dollars (₮). If a time is presented together with a masked financial number the time will also be masked with the same denominator. In charts and graphs only relative numbers or relative comparisons can be viewed. Corporate restrictions have also resulted in that only descriptions of the models created and calculations done can be given.
3
Frame of Reference
This chapter presents literature and theory models relevant for the dissertation. The content is both a more general start about quality and quality work for readers with none or little experience in the area as well as more specific models that will be used. The chapter ends with theories about performance measurement.
3.1
What is quality?
Quality, like truth, beauty and contact lenses, is in the eye of the beholder.
The word quality comes from the Latin word qualitas which would best be translated as character. (Bergman & Klefsjö 2007, p.23) Today there exist a vast number of definitions of quality. According to Crosby (1979, p.27) one common misinterpretation is that quality means kindness, wealth or importance. Quality is then used to mark the comparative value in phrases as god or bad quality. Crosby means that a definition is important to remove the subjectivity from the definition and therefore defines quality as “conformance to requirements”. This is according to Bergman & Klefsjö (2007, p.23) a narrow definition which only focus on a producers view. Both Juran (1951) and Deming (1986) states definitions with customer focus. Juran defines as “fitness for use” while Deming means that “quality should be aimed at the needs of the customer, present and future”. ISO9000:2000 defines quality as “Degree to which a set of inherent characteristic fulfil requirements”.
Bergman & Klefsjö (2007 p.25) tries to combine different viewpoints and states that “the quality of a product is its capacity to satisfy, and preferably outperform, the customer’s needs and expectations”. One problem in this definition is who the customer is. For industrial products it is important to differ between user and buyer. Customers can, according to Lehmann & Winer (2005 p. 121), be divided into five different entities within an organisation.
• Initiator – Identifies the need for the product
• Influencer – Has information or preference input to the decision
• Decider – makes the final decision through budget authorisation
• Purchaser – make the actual purchase
• User – the user of the product
Bergman & Klefsjö (2007 p.29) defines customer “those who our organisation creates value for”. According to ISO9000:2000 the customer is “the organisation or person who receives a product”. One other group involved are stakeholders which could be divided into primary and secondary stakeholder. Stakeholders are organisations or people who give support to the organisation and can withdraw the support if they are not pleased with the organisation. The classification of primary and secondary stakeholders depends on if the own organisation directly, respectively or indirectly can affect if the stakeholder’s support is withdraw.
To meet the customer’s needs and expectations is somewhat difficult to achieve since the customer is normally only aware of some of his or her needs. Some of the needs are only taken for granted or unknown until they are satisfied. (Sörqvist 2001 p.11) The fulfilment of different needs makes different impacts on the customer. This is described by the Kano model in Figure 3 below.
Figure 3: The Kano Model (Pyzdek 2003, p.119)
Another way of defining quality is to use five different viewpoints (Garvin 1984): 1. User based – Quality is measured by the customer
2. Production based – Quality is connected to satisfying production tolerances and is mainly a technical issue
3. Value based – Quality is measured in relation to costs
4. Product based – Quality is measurable and is defined by the performance of the product 5. Transcendent – Quality can not be measured but only identified when it is experienced, like
beauty
The conclusion of Garvin is that an organisation can not have just one view on quality. Instead they need different views in different departments (Bergman & Klefsjö 2007 p.28).
According to Bergman & Klefsjö (2007 p.32) can product quality be divided into different dimensions and describe eight of these. In Table 1 these are shown.
Table 1: Dimensions of product quality according to Bergman & Klefsjö (2007 p.32)
Reliability How often faults occur and how serious they are Performance Characteristics of importance for the customer Serviceability How easy it is to find, locate and eradicate faults Environmental friendliness The product’s impact on the environment
Appearance Aesthetics parameter created by design and colour
Absence of defect That the product does not have faults or shortages when it is bought
Security That the product does not cause harm to person or property Durability That the product can be used, stored and transported without
being fatigued or damaged
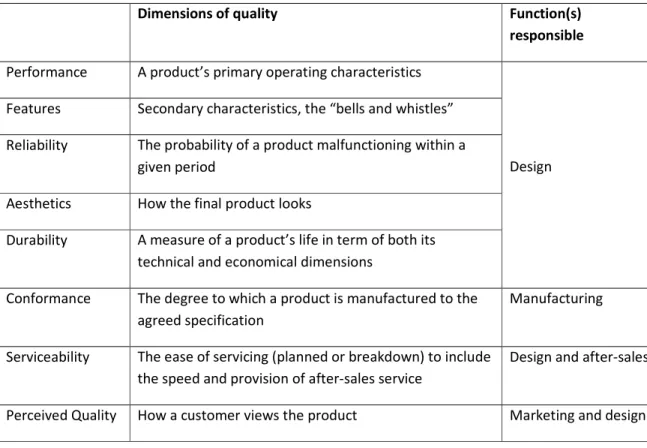
Quite similar view with product focus is the one of Garvin (1984). Here in Table 2 it is expanded with which company function responsible for each dimension that is described by Hill (2000 p.67)
Table 2: Dimensions of product quality according to Garvin (1984), with function responsibilities from Hill (2000 p.67)
Dimensions of quality Function(s)
responsible Performance A product’s primary operating characteristics
Features Secondary characteristics, the “bells and whistles” Reliability The probability of a product malfunctioning within a
given period
Aesthetics How the final product looks
Durability A measure of a product’s life in term of both its technical and economical dimensions
Design
Conformance The degree to which a product is manufactured to the agreed specification
Manufacturing
Serviceability The ease of servicing (planned or breakdown) to include the speed and provision of after-sales service
Design and after-sales
Hill especially emphasise that conformance is the only parameter of quality that can be directly influenced by manufacturing. Another important aspect of the quality dimensions is that the importance of each dimension differs a lot between different products (Bergman & Klefsjö, 2007 p.37).
3.2
Quality work
Folklore has it in America that quality and productivity are incompatible: that you can not have both – Edward W. Deming
3.2.1
History of Quality work
In the beginning of the 20th century Frederick Taylor developed Scientific Management. One of the cornerstones was special inspectors controlling that all operations were within the given tolerances (Bergman & Klefsjö 2007 p.83). The whole idea of separating control from production would remain in the western world for a long time. One of the first persons to integrate some customer focus in quality work was Walter A. Shewhart in 1931 (Bergman & Klefsjö 2007 p.86).
After World War II Japanese quality had a bad reputation, mainly depending on that many company leaders from the war were replaced by young engineers. The group JUSE (Union of Japanese Scientists and Engineers) was founded in 1946 as a campaign to improve the reputation. JUSE worked together with Joseph M. Juran and Edward W. Deming and educated many company key personnel in quality work. One message was the quality work is a much about leadership as statistic control (Bergman & Klefsjö 2007 p.91).
One of the fundamentals of Japanese quality work was what today is known as quality circles. The control and the production was reconnected when the actual operators was engaged in solving their quality problems in these quality circles. Two important issues raised by Ishikawa in 1964 was passionate leadership and that quality work should involve everyone in the company (Bergman & Klefsjö 2007 p.96). This was known as Company Wide Quality Control (CWQC). Many concepts as lean-production, just-in-time, Kanban, kaizen, 5-why and 7 improvement tools are part of this theory (Bergman & Klefsjö 2007 p.97).
In the 1980s, to meet the threat from the “Japanese wonder”, the western companies started to learn from the Japanese way. The term Total Quality Control (TQC) from Feigenbaum (1991) was used as name but the theories later on became known as Total Quality Management (TQM) (Bergman & Klefsjö 2007 p.97).
3.2.2
Total Quality Management
The expression TQM was created either by Naval Aviation Logistics Command when they in 1984 did not like the word “Control” in Total Quality Control and replaced it with “Management” or as an misinterpretation from Japanese since the difference between control and management do not exist in Japanese(Bergman & Klefsjö 2007 p.97).
The principle of the Total Quality view is that it starts with identification of customer needs and ends with the product being placed in the hands of a customer who remains satisfied (Feigenbaum 1991 p.11). Feigenbaum (1991) also describes eight stages of the industrial cycle (see Table 3) where the quality of a product is affected. This describes that total quality can not be accomplished in one
isolated stage. This could be compared to the quality dimensions of Garvin and Hill in the chapter above.
Table 3: Eight stages of the industry cycle (Feigenbaum 1991 p.11)
Marketing Engineering Purchasing
Manufacturing Engineering
Manufacturing supervision and shop operations Mechanical inspection and functional test Shipping
Installation and service
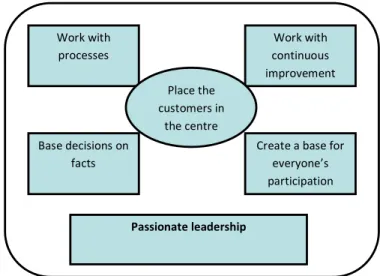
Bergman & Klefsjö (2007 p.38) translates TQM into Offensive Quality Development. Offensive should be read as “to work active with prevention, change and development and not control and repair”. Bergman & Klefsjö (2007 p.39) defines in Figure 4 five cornerstones and one fundament upon which TQM is built.
Figure 4: The fundament “Passionate leadership” is a prerequisite for the five cornerstones upon which TQM is built (Bergman & Klefsjö 2007 p.39)
Work with processes Work with continuous improvement Base decisions on facts
Create a base for everyone’s participation Place the customers in the centre Passionate leadership
Another summarisation of TQM is the 13 basic values which are the foundation to get the Award for Swedish Quality that is given by the Swedish Institute for Quality (SIQ 2008, p.8; Sörqvist 2001, p.9). The 13 basic values are:
• Customer orientation • Preventive action
• Passionate leadership • Continuous improvement
• Participation • Learn from others
• Competes development • Agility
• Long term goals • Decisions based on facts
• Social responsibility • Cooperation
• Process orientation
These principles can seem a bit vague and difficult to make operational, but they are the pillars that build the foundation to the Swedish TQM approach. And with proper measurements these principles can be a foundation for benchmarking and improvement efforts (SIQ 2008).
3.3
Quality Costing
“Money is the basic language of the upper management” – Joseph M. Juran
3.3.1
The Role of Quality Costing
Many companies recognise quality as a key area for customer value and also define quality as a part of their competitive strategy (Tsai 1998 p.719). Despite this and even though many companies are involved in quality programs, only a third of the companies in US and England actually calculate cost of quality (COQ) (Yang 2008 p.176).
Measuring and reporting cost of quality is the first thing to do in a quality program (Tsai 1998 p.719). Quality has always been difficult to measure and therefore has quality management had problem to attract top management’s attention (Crosby 1979 p.124; Juran & Gryna 1988 p.4.4). COQ is a way to measure quality and quantify it as money. Giakatis et al (2001) summaries the COQ in different companies to be between 5-30% of sales and studies often show that COQ more often are around 15-25% of sales than the 3-7% that companies often assume (Yang 2008 p. 175). However, according to Crosby (1979 p.129) is COQ primary a tool to focus management attention and only secondly as a measure of quality improvement programme.
The increased importance of COQ can be explained by the changed customer behaviour from buying whatever is offered into buying only products that matches their functional requirements and desired price, caused by the global competition. This has made the customer orientation much more important for companies and therefore also increased the importance of reduction and financial measurement of non-conformance (Yang 2008 p.176).
Yang (2008 p.176) lists critical issues for effective quality-cost technique as:
• To categorise various quality costs and make sure that all costs are captured
• To collect and analyse data and quantify all quality costs accurately
• To identify areas of poor performance on basis of the data analysis
• To allocate responsibility for the overall cost
Juran & Gryna (1988 p.4.2) describes two different objectives with quality costing:
• Estimate the Quality costs as a one-shot study and use the result from the study to start projects of improvement.
• Expand the accounting system and continuously present the cost as a scoreboard and make this drive the starting of improvement projects.
3.3.2
Definition of Quality costing
The concept quality costing was introduced by Juran in 1951 when new quality oriented staff departments evolved at companies and their managers were faced to “sell” their activities to company management (Juran & Gryna 1988 p.4.2; Schiffauerova & Thomson 2006 p.4).
The term quality costs have no agreed definition. Two examples of quality cost definitions are the cost of attaining quality or the cost of running a quality department. These two are according to Juran & Gryna (1988 p.4.3) faulty and common misinterpretations. Juran & Gryna (1988 p.4.3) means that quality specialists equate “quality costs” with “cost of poor quality”. With this Juran & Gryna means the “sum of all costs that would disappear if there were no quality problems”. Srivastava (2008 p.193) uses the definition “the sum of the costs incurred within a firm in preventing poor quality, the costs incurred to ensure and evaluate that the quality requirements are being met, and any other costs incurred as a result of poor quality”.
Yang (2008 p.177) summaries and compare different definitions of quality costs and states that most of them are similar. Mainly two different groups of terms exist:
1. Cost of Quality – either abbreviated COQ (e.g. Srivastava 2008) or CoQ (e.g. Schiffauerova & Thompson 2006).
2. Cost of Poor Quality – abbreviated COPQ (e.g. Juran & Gryna 1988). This term also include Poor-Quality Costs – PQC (e.g. Chen & Tang 1992)
The both terms Cost of Quality and Cost of Poor Quality are essentially synonymous and both can be used to describe quality costs (Juran & Gryna 1988; Yang 2008). In this subject Plunkett & Dale (1987 p.50) points out that in literature, many writers imply their own definitions of quality related costs and much of the literature on the subject is on how to interpret or define quality costs.
“The point to be made here is that the literature does not deal with a matter which is fundamental to the whole exercise of gathering and using quality-related costs. Attention to definitions may obviate
many of the obstacles to establishing quality costing as a management tool.” (Plunkett & Dale 1987 p.50)
3.4
Overview of Quality costing models
Different Cost of Quality models for handling the issues described in 3.3.1 exists today. The first quality costing analysis was performed by Armand Feigenbaum in 1943 (Schiffauerova & Thomson 2006 p.4) and in 1956 Feigenbaum presented the P-A-F cost model which is the foundation of many of today’s COQ models (Feigenbaum 1991 p.109; Schiffauerova & Thomson 2006 p.4). The P-A-F- model will be presented in section 3.5. Philip Crosby (Crosby 1979 p.123) evolved the model with his own quality definition and his work helped to popularise the COQ concept beyond the quality profession (Srivastava 2008 p.195). The P-A-F model in its original form does not contain any intangible cost and have been expanded in numerous models in a way to capture the types of hidden costs that exists in different levels (Schiffauerova & Thomson 2006; Srivastava 2008; Yang 2008). Process cost approach developed by Ross in 1977 and used for the first time for quality costing by Marsh in 1989 is the other main model for quality costs (Schiffauerova & Thomson 2006 p.5).
Reviews of COQ models can be found in Plunkett & Dale (1987), Porter & Rayner (1992) and more recently Schiffauerova & Thomson (2006).
3.5
PAF model
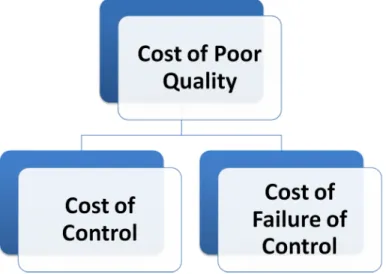
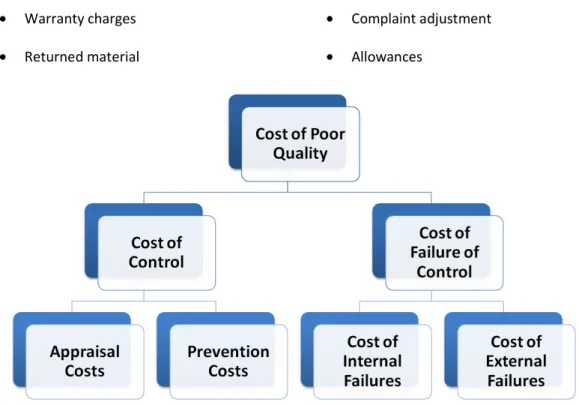
Feigenbaum’s Prevention – Appraisal – Failure (PAF) model presented in 1956 is still the cornerstone in quality costing models. The quality costs include two different areas: the cost of control and the cost of failure of control which can be seen in Figure 5 (Feigenbaum 1991 p.110).
Figure 5: Cost of Poor Quality divided into cost of control and cost of failure of control (Feigenbaum 1991 p.111)
Costs of control are measured in two segments: Preventions costs and Appraisal costs, while the costs of failure of control are divided into the segments: Internal Failure Costs and External Failure costs which can be seen in Figure 6 on page 21(Feigenbaum 1991 p.111).
3.5.1
Prevention costs
Prevention costs are costs incurred to keep failure and appraisal costs to a minimum (Juran & Gryna 1988 p.4.6). The British Standard (BS6143 1981) defines prevention cost as “the cost of any action taken to investigate, prevent or reduce the risk of non-conformity or defect”. Examples of preventions cost are (Juran & Gryna 1988 p.4.6):
• Quality planning • New product review
• Process planning • Process control
• Quality audits • Supplier quality evaluation
• Training
3.5.2
Appraisal costs
Appraisal costs are costs incurred to determine the degree of conformance to quality requirements (Juran & Gryna 1988 p.4.5). Another definition is the cost of evaluating the achievement of quality requirements including, for example, “the cost of verification and control performed at any stage of the quality loop” (BS6143 1981). Examples are (Juran & Gryna 1988 p.4.5):
• Incoming inspection and test • In-process inspection and test
• Final inspection and test • Product quality audits
• Maintaining accuracy of test equipment • Inspection and test material services
• Evaluation of stocks
3.5.3
Internal failure costs
Internal failure costs are costs associated with defects that are found prior to transfer of the product to the customer. They are costs that would disappear if no defects existed in the product prior to shipment (Juran & Gryna 1988 p.4.5). Another definition is “costs arising within an organisation owing to non-conformities or defects at any stage of the quality loop, such as costs of scrap, reworking, retesting, re-inspection or redesign” (BS6143 1981). Examples are (Juran & Gryna 1988 p.4.5):
• Scrap • Rework
• Failure analysis • Scrap and rework – supplier
• One hundred percent sorting inspection • Re-inspection, retest
3.5.4
External failure costs
External failure costs are costs associated with defects that are found after product is shipped to the customer. These costs also would disappear if there were no defects (Juran & Gryna 1988 p.4.5). The BS6143 (1981) definition is “costs arising after delivery to customer/user owing to conformities or defects, which may indicate the cost of claims against warranty, replacement and consequential losses, and evaluation of the penalties incurred”. Examples are (Juran & Gryna 1988 p.4.5):
• Warranty charges • Complaint adjustment
• Returned material • Allowances
Figure 6: Cost of Poor Quality with the PAF sub division (Feigenbaum 1991 p.111)
3.5.5
Optimal level of PAF-categories
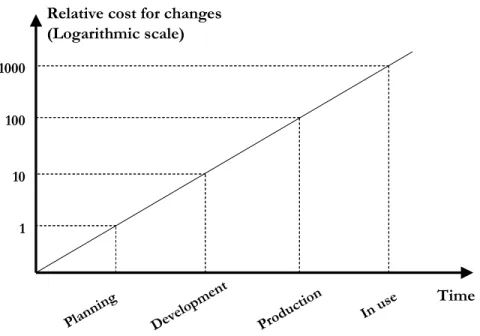
During the development of products, the cost for making changes increase rapidly for each development step that is entered which is shown in Figure 7. One of the success factors behind the Japanese industry in the mid-eighties was to make sure the quality was high and that no changes was required after the commercial launch (Bergman & Klefsjö 2007 p.64).
Deve lopme nt Plann ing Prod uctio n In us e 1 10 100 1000 Time Relative cost for changes
(Logarithmic scale)
Figure 7: Cost for changes in different steps of product generation (Bergman & Klefsjö 2007 p.64)
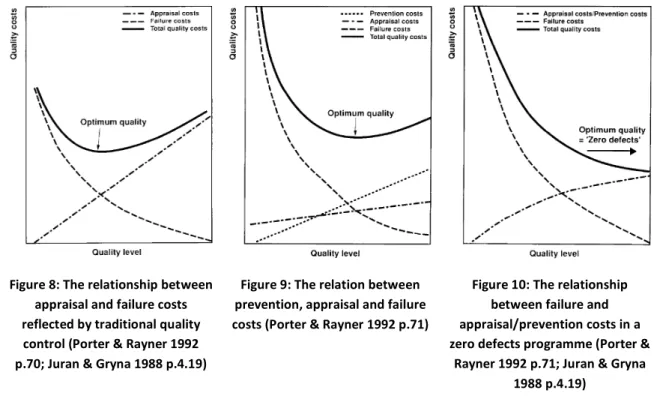
This theme is more elaborated in the PAF-model where the costs are related to each other. When the appraisal cost rise the failure cost normally fall because more failures are discovered at an earlier stage. The cost of failure increase as the faulty item proceeds down the production process. Therefore it is less costly to scrap an item at goods intake then when the product is ready for deliver. But the decreasing rate will fall when increasing the appraisal cost since appraisals activities can never be fully successful (Porter & Rayner 1992 p.70). This is shown in Figure 8 and represents the opinions during most of the twentieth century. The figure shows that there is a trade-off between quality and costs and that beyond the optimum a further investment in quality will not be paid-off (Porter & Rayner 1992 p.70).
One of the major points in Total Quality Management is prevention rather then letting the failures happen in the first place. This means that an investment in prevention would decrease the failure costs without any increase in appraisal costs. Figure 9 shows how the prevention reduces the failure costs but there is still an optimum beyond which further investments are unprofitable (Porter & Rayner 1992 p.70).
During the late twentieth century the priorities on prevention became higher. New technology has reduced errors in both production but mostly in inspection (Juran & Gryna 1988 p.4.19). Also if no defects at all were produced the appraisal cost could be eliminated or at least lowered. This leads to the zero-defects view where the optimum point means no failure costs (Porter & Rayner 1992 p.71). This means doing things right the first time (Crosby 1979 p.223).
Further point has been added that increases the view of Figure 10 as valid. Different types of hidden costs outside the PAF-model can also be reduced a with higher quality level (Yang 2008 p.178). Also the cost of losing a customer because of defects is not included in this model (Reichheld & Sasser 1990).
Figure 8: The relationship between appraisal and failure costs reflected by traditional quality control (Porter & Rayner 1992 p.70; Juran & Gryna 1988 p.4.19)
Figure 9: The relation between prevention, appraisal and failure costs (Porter & Rayner 1992 p.71)
Figure 10: The relationship between failure and appraisal/prevention costs in a zero defects programme (Porter &
Rayner 1992 p.71; Juran & Gryna 1988 p.4.19)
3.5.6
Reviews of the PAF-model
The PAF model is well accepted and has been in use since 1950s and until 1992 the model was exclusively recommended by the British Standards Institute (BS6143 1992; Goulden & Rawlins 1995 p.33). The quality cost categories definitions are well established due to the universal acceptance of the PAF-categories (Plunkett & Dale 1987 p.43). Porter & Rayner (1992 p.80) concludes that “the PAF model is the only recognised international standard for quality costs.”
Despite this, the model also has limitations and weaknesses. Plunkett & Dale (1987 p.50) concludes that “categorisation of costs in this way seems to be of greater interest to quality managers than to anyone else and perhaps a corollary of this approach is the preoccupation with in-house quality-related costs, with little specific attention being paid to supplier or subcontractor-generated quality costs or to customer-related costs.” After the appearance of business processes, Porter & Rayner (1992 p.80) points out that he PAF-model generally fails when applied to a TQM programme which requires a process approach.
Also the model is not that good to measure quality investments since quality improvement in prevention takes time to affect the failure costs. The backlog in failure cost could be many years (Porter & Rayner 1992 p.72).
Another limitation is on the categorisation of the concept corrective actions. The costs of investigating and correcting failures could either be classified as prevention or failure costs. Investigations will prevent future defects but were issued of actual failures. Juran & Gryna (1998) classify these costs as failure costs.
Other limitations is that the PAF model do not include intangible costs, that the some cost elements are hard to classify and that the model focuses on cost reduction and ignores positive contribution to price and sales volumes by increased quality (Porter & Rayner 1992 p.80; Tsai 1998 p.723).
3.5.7
Crosby’s Model
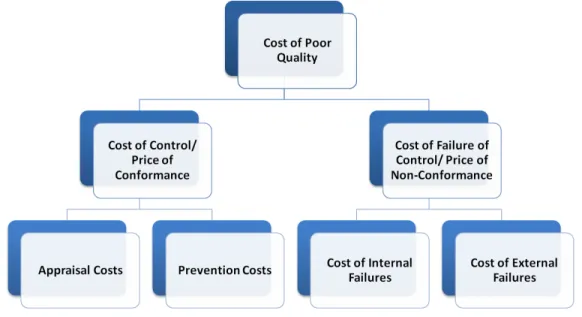
A variant of the PAF-model has been made by Crosby (1979 p.123). Because of Crosby’s definition of quality (see 3.1) the quality costs is defined as price of non-conformance (PONC) which includes the same categories as the PAF-model (Prevention, Appraisal and Failure). PONC could also be described as the cost of getting things wrong (Goulden & Rawlins 1995 p.33). Other authors have expanded Crosby’s model with the price of conformance (POC) as well where POC refers to the cost of control and PONC then refers only to the cost of failure. One problem with Crosby’s model and quality definition is the neglecting of the design quality which can create a conflict between design and conformance quality. This can either be handled with a correct prioritisation between the two dimensions or as a synergistic approach based on the view that improvement in one dimension leads to improvement in the other (Srivastava 2008 p.195).
However, as shown in Figure 11, in the end this is only a different terminology describing the PAF-model (Goulden & Rawlins 1995 p.36; Schiffauerova & Thomson 2006 p.5).
Figure 11: Cost of Poor Quality with both Crosby’s and Feigenbaum’s subdivisions (after Feigenbaum 1991)
3.5.8
Intangible or hidden costs
Even though the PAF-model is widely used many authors recon that the traditional categories do not cover all quality related costs. Additional categories have been suggested such as cost of quality design, cost of inefficient utilisation and other invisible costs (Yang 2008 p.178). These intangible or hidden costs are often used to show on failure costs that are not recorded in the company accounts. Dahlgaard et al. (1992) proposes a 2x2 matrix model (Table 4) based on PAF with internal and external costs as well as visible and invisible costs.