2008:27
T E C H N I C A L R E P O R T
Statistical Evaluation of Rapeseed Methyl Ester
as Ignition Improver in an 11 Liters Ethanol
Fuelled Diesel Engine
Kent Nord
Dan Haupt
Luleå University of Technology
Technical Report
Department of Health Sciences
Division of Medical science
Statistical Evaluation of Rapeseed Methyl Ester as Ignition Improver in an 11 Liters Ethanol Fuelled
Diesel Engine
K. Nord and D. Haupt
Luleå
University of Technology
971 87 Luleå
Sweden
.
ABSTRACT
There is an ongoing search for better and cheaper ignition improvers to facilitate the introduction of ethanol fuel. Rapeseed methyl ester(RME) was therefore investigated in an ethanol fueled compression-ignited engine by means of different statistical designs. Experiments were accordingly performed at various levels of speed, load and concentration of RME in ethanol while the emissions were measured. The optimization criterions were; satisfactory engine performance and low exhaust emissions. Initial experiments showed that the power outlet and the opacity increased when using the tested ignition improver. A three level full factorial design correctly predicted that the emissions of HC, CO and NOX, should increase when using RME as an ignition improver. Lowest level of exhaust emissions was obtained at 16 % RME in ethanol but a higher concentration should be used to obtain better engine performance. A general conclusion is that RME seems suitable for the investigated task, i.e. ignition improvement, but the opacity increment should be further studied. Careful selection of the conditions used as well as rigorous control of the engine and dynamometer is necessary to obtain good repeatability and accuracy of the experimental conditions.
Key Words: Rapeseed methyl ester, ignition improver, emissions
INTRODUCTION
Ethanol and methanol have been used as automotive fuels for a long time, both as net fuels and as blend component, mostly in gasoline, Kremer and Fachetti (2000). One advantage with using alcohol fuels/alcohol blends is that the contribution of greenhouse gases from vegetable oils and alcohols produced from biomass are minor. Other advantages reported are low emissions of pollutants such as NOx and particles and emissions of specific substances such as olefins and polyaromatic compounds (PAH). Alcohol is an excellent net fuel in Otto engines;there is even a possibility to raise the engine efficiency due to the high octane rating, Olsson (1996). On the contrary, alcohol is an unfavorable net fuel in diesel engine because of the low cetane number. Different ignition improvers must therefore be added to the net alcohol fuels. Mainly two types of ignition improvers have been used, one type containing nitrated compounds and another type constituted of polymers, i.e. polyetylenglykols. Simonsen and Chomiak (1995) tested a range of different ignition improver and pointed out that despite the substantial amount of work regarding to ignition improvers effect, the actual reasons for the improvement of the ignition properties of the fuel are still uncertain.
The effects of an addition of an ignition improver can many times be hard to predict, the cetane rating are usually not the only property that are influenced. Ali and Hanna (1996) showed, for example, an increased engine wear when using methyl tallowate and ethanol as fuel. Other examples are increased / reduced engine performance and exhaust emissions.
The engine performance is usually tested after changing the fuel or fuel composition. Usually the test is performed according to a stipulated test cycle with varying speed and load according to an established test cycles such as the ECE R49-test cycle regulation or the newly introduced ESC (European Stationary cycle). At the same time important parameters such as exhaust emissions, fuel consumption, and other parameters such as combustion pressure pulse can be measured.
Usually the test cycles are based on a more or less well founded knowledge of the ordinary behavior of the engine of interest. This means that the test cycle is not primarily constructed for giving optimal information about the parameters that influence the exhaust emissions. In the test cycle used in this investigation, ECE R49, the engine is running according to 11 different steady modes while monitoring the emissions. This means that only one or sometimes two parameters are changed one at the time.
An alternative approach is to use design of experiments (DOE). In this statistical approach all relevant variables are altered simultaneously in a selected set of experiments. By doing this, a maximal amount of information is gained in a minimal number of experiments. Other advantages with DOE are that interacting effects between variables are easier to interpret and that optimum performance is easier to locate. A set of experiments usually does not contain more than 10-20 modes, but the number can be altered to meet specific demands. However, caution must be taken in interpretation of data from statistical experimental design. The obtained result is a computed model of the engine performance, not the actual performance.
The aim of this study has been to evaluate the properties of RME as ignition improver and to find the optimal blend of ethanol and rapeseed methyl esters vis-à-vis low levels of NOX, acceptable engine performance and low cost of the fuel. These have been done by means of different statistical designs. At the same time valuable information of the usefulness of DOE as a tool for gaining information about system as this has been gained.
EXPERIMENTAL PROCEDURE AND METHODS
Engine, Fuel and Instrumentation.
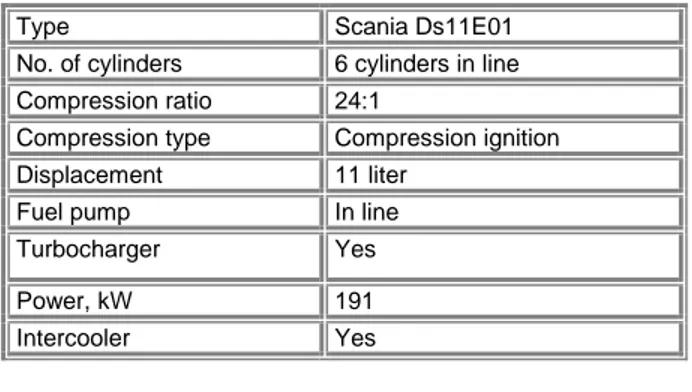
All tests have been performed at the test-cell laboratory at Luleå University of Technology, Sweden. An eleven-liter six-cylinder in-line Scania ethanol engine, turbocharged and with intercooler was used for the tests, see Table1 for further information. The mixtures used in the experiments, i.e. 16-20 and 25% volume percentage of rapeseed methyl ester in ethanol were mixed in the laboratory by weighing the right amount of RME and adding appropriate weight of ethanol. The ethanol used for fuel mixing contained azeotropic ethanol (92 % volume percentage) ethanol denaturants 3%, and 250 ppm corrosion inhibitor. Both ethanol and rapeseed methyl ester were delivered from ELAB AB.
The reference fuel, Etamax, was purchased from SEKAB, Örnsköldsvik Sweden and consisted of azeotropic ethanol (92 % volume percentage), 3% ethanol denaturants, 5% ignition improver (Beraid), 250 ppm corrosion inhibitor and 5 ppm red dye.
Fuel consumption was measured by weighing, using a system constructed at the Department for Environment Technology, Luleå Technical University (LTU). The fuel was also heated to a desired temperature by a system using a heat exchanger. Temperature, pressure and airflow were measured in the air inlet. The test-cell was equipped with a Schenk D 630-IE dynamometer. An AVL computer with software from PUMA was used for controlling the driving modes and for registering the engine parameters.
Type Scania Ds11E01 No. of cylinders 6 cylinders in line Compression ratio 24:1
Compression type Compression ignition
Displacement 11 liter
Fuel pump In line
Turbocharger Yes
Power, kW 191
Intercooler Yes
Table 1 - Engine data.
Sampling of exhaust gas components was carried out in undiluted exhaust gas with heated sampling lines. Two nondispersiv infrared instruments, type Maihak UNOR 6N, were used for measurements of carbon oxide (CO) and carbon dioxide (CO2). Hydrocarbons (HC) were measured using a heated flame ionization detector (HFID), type J.U.M.V 5. Emissions of nitrogen oxide (NO) and the sum of NO and NO2 (NOx) were determined by a TECAN chemiluminescence instrument called CLD700 ELHT. All instruments for measurements of regulated emissions were purchased from BOO Instrument AB ,Saltsjö Boo, Sweden. Data from the different analyzers were sampled and collected by using a computer with software from BOO-instrument. Smoke were measured with a DST 200-DX opacimeter from Electra Control AB. Combustion pulse measurements were carried out with a piezoelectric accelerometer, which was mounted firmly on the engine surface. An inductive magnetic sensor, which was connected to the flywheel, was used to locate the position of the piston in the cylinder. A quartz pressure water-cooled transducer was used to make combustion pulse measurements. The sampling frequency for all the experiments related to pressure was 16284 Hz. Post-processing software in the signal processing toolbox of Mat-Lab was used for the analyses.
Statistical Methods
Two or three level factorial designs have been used for the optimization of the fuel composition and evaluation of engine performance and emission characteristics with different mixtures of fuel. The studied variables were RME concentration in ethanol, speed and load. The responses were emissions of HC, CO and NOx.
The first step in the optimization process was to use a simple two levels, factorial, design with added central points, see Figure 1. The number of experiments in the first design was 11, including two replicates in the centre. Replicates were necessary to obtain a measure of the variance amongst the replicates. This variance was later used for evaluation of the model. All experiments were (in this first step) randomized to minimize the influence of systematic errors. Later, when further experiments were added, they were added in a randomly way to avoid systematic errors together with an extra measurement at the central point.
In case of poor modeling, some additional experiments were added to obtain a central composite face design, CCF, see Figure 1. The total number of experiments increased to 18, including four replicates at the center. After evaluation of the computed CCF model, and if considered necessary, additional experiments were added to obtain a three level full factorial design, see figure 1.
Fig 1 - Used factorial designs.
The software used for the modeling and the analysis was Modde 5.0, developed and distributed by Umetrics in Umeå, Sweden. The statistical methods used for the evaluation of the models were multiple linear regressions, MLR, and partial least square, PLS. The methods are incorporated in Modde 5.0. For further information about the methods see Box et al.(1978) or Martens and Naes (1991). Finally, in order to check the predictive power of the models, some (real) experiments were performed, with 17% and 19 % RME in ethanol, and the agreement between obtained and predicted value was compared.
RESULTS AND DISCUSSION
Initial Studies
Experimental designs usually cover an experimental space that for some reason is considered more interesting than other spaces. One shortcoming with the models build this way is that their validity usually are limited to this space even if extrapolating, some times, are possible. The first task for the experimenter is thus to decide which space or experimental domain to study. On one hand, a too wide experimental domain can gives poor models and sometimes miss the anticipated optima due to rough estimates of the parameters. On the other hand, a too narrow experimental domain will not show any effect of the variables involved and most of the results are just “noise”. Empirically, with the equipment used in the laboratory, we know that a too large experimental domain, say from idle to 2000rpm, automatically results in too much variance, hindering the development of acceptable models. It was therefore decided to use a somewhat narrower experimental domain to enabling better models of the subject of interest, i.e. the influence of various RME/ethanol mixtures on engine performance and exhaust emissions at different loads and speeds .The experimental domain was therefore limited to the three speeds (800, 1300, 1800 rpm), three loads (10%, 50% and 90%) and three different concentrations of RME in ethanol (16, 18 and 20 %), see table 2. Four of the steps in the ECR 49 cycle were covered by the used experimental designs of interest.
Engine Speed and loads used for Testing Designed experiments,
DOE
ECR 49 cycle 800 rpm, 10, 50, 90 % of
max load
Idle, approx. 500 rpm, unloaded 1300 rpm, 10, 50, 90 % of max load 1200 rpm, 10, 25, 50, 75, 100 % of max load 1800 rpm, 10, 50, 90 % of max load 2000 rpm, 10, 25, 50, 75, 100 % of max load
Table 2 - Different modes used for the experimental design. The different modes in the ECE R49 cycle
Initial studies were necessary to define the area of interest regarding concentration of RME. Engine performance as well as exhaust emissions for different RME/ethanol blends, 16,18, 20 and 25 % were therefore tested and evaluated.
Results from the engine performance test in terms of corrected power output can be seen in Figure 2 together with the test result from the run with Etamax fuel. As the Figure shows, power increases with increasing levels of RME. Changes are probably related to the energy content in the fuel. Etamax, with main constituent ethanol, has probable energy content somewhere around 27.1 MJ/kg, while RME has 37.2 MJ/kg fuel, cf. Table 3. There is also a tendency that the higher the level of RME there is in the fuel, the more RME has to be added to make a difference in power output. However, if this tendency originates from engine tuning, engine construction or the fuel properties have not been further investigated.
Another property of special interest is the smoke. The smoke emitted from the engine is a measure of unburned RME and particles. Particles have long been considered one of the main
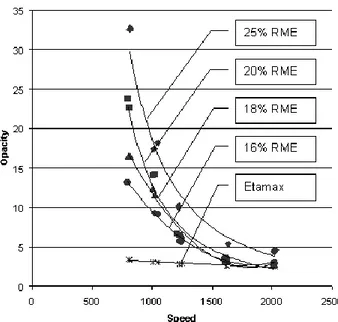
problems with diesel engines. If the particles are in the same range or exceed the amount of smoke produced by “ordinary” diesel engines, one of the arguments for using ethanol/RME is disqualified. Normally, low levels of particulate emissions are emitted from vehicles running on ethanol-based fuel, Christensen et al (1997). Opacity was therefore measured for a couple of mixtures at full load conditions and at various speeds, see Figure 4. As expected the smoke intensity increased when increasing the levels of RME in the fuels, see Figure 4. It seems like the level of unburned RME increases rapidly after a admixture of 18 % RME. Because of the intention to keep the RME levels as low as possible in the fuel and the measured smoke, mixtures containing RME levels over 20 % RME were excluded from further investigations.
Property Rapeseed metylester Ethanol Diesel MK1 Energy content (MJ / kg) 37,2 27,1 42,5
Cetane Number 54 8 (estimated) >50
Density kg / dm3
(15°C
)
0,88 0,80 0,83
Table 3 – Some properties for RME, ethanol and MK1 Diesel, Swedish environmental class 1 Diesel
Figure 2 - Engine performance with different fuels
Figure 3 - Opacity measurements when using different blends of ethanol and RME at full load conditions and various speeds.
Measuring cetane number, i.e. the ignition quality of the fuel, for fuel as Etamax and RME /ethanol are not easily done or sometimes even possible in ordinary CRF engines. The reason is that the CRF engine is dedicated for analysis of hydrocarbon fuels featured by high and moderately high cetane numbers, compare table 3. However, the ignition propensity for low cetane fuels is possible to estimate by measuring the cylinder pressure during combustion and calculate the ignition delay. According to the findings in this investigation, the ignition properties seem to be similar for the 18% and 20% RME mixtures, see Figure 4. The ignition delay is somewhat longer for the Etamax fuel and longest for the ethanol fuel with 16 % RME content. The maximum pressure follows the same priority, highest pressure were obtained for the ethanol fuels containing 18 and 20 % of RME followed by Etamax. Results also showed that there are very small divergences between 18% and 20 % admixture.
Figure 4 – Cylinder pressure for the different mixtures of RME/ethanol and the reference fuel Etamax. The tops of the curves
are magnified to the right.
Initial testing showed that the lowest possible admixture of RME to use was 16%. The engine wouldn’t work satisfactory below this limit, probably because of improper ignition properties. Another conceivable explanation for improper engine function is that the fuel pump will not pump the fuel properly if the fuel has a viscosity that differs too much from the viscosity specified by the pump. Based on experience obtained during the initial studies it was decided that the RME levels in the experimental designs should be between 16% and 20 %. The range for speed and load was set to vary between 800 –1800 rpm and 10-90 % of maximum load at the specified speed.
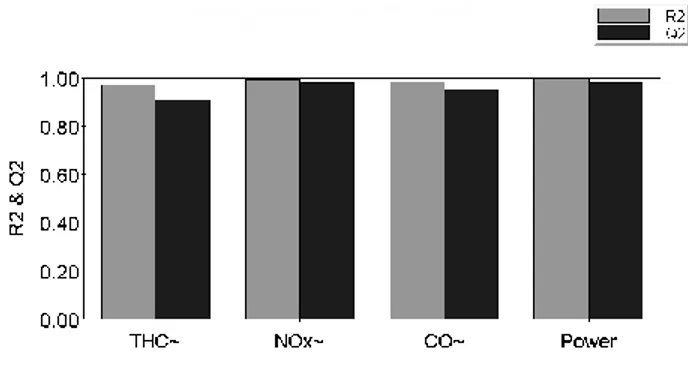
Figure 5 - Goodness of fit (R2) and goodness of prediction (Q2) for the three levels full factorial designs.
Different models were made and tested according to the procedure described under statistical methods. Different statistical tools were used for testing the models. Goodness of fit, R2, is a measure of how well the statistical model can be made to fit the raw data. Goodness of prediction, Q2, estimates the predictive power of the model as Eriksson et al (2000) explains. The best models were three levels full factorial design, explaining between 97%-99% of R2 for total hydrocarbon, nitrogen oxides and carbon oxide, see Figure 5. Q2 was also good for the different models, varying between 93% and 98%. The best prediction ability was obtained for the emission of nitrogen oxides (Q2 = 98 %). A probable cause for this can be found in the fact that the formation of nitrogen oxides is mainly dependent upon temperature and pressure while the combustion of hydrocarbon and carbon oxide is somewhat more complicated reflecting all the steps from vaporization until final oxidation with the oxygen in air, for further details see Egnell (1992).
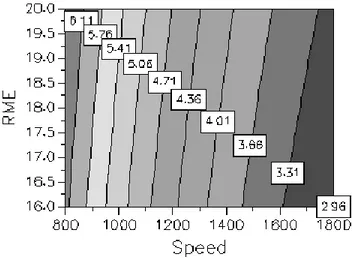
Figure 6 shows the predicted emission of nitrogen oxides at different speeds and concentration of RME at 50 % of maximum load. As can be seen, the level of nitrogen is predicted to decrease with decreasing levels of RME in the fuel. This is in accordance with increasing ignition delay at with decreasing levels of RME, see also figure 4. Postponed ignition is well known method to reduce emission of NOx, often with a penalty in the engine efficiency as Egnell (1992) stated.
Figure 6 - Predicted emissions of NOx in g/kwh contra speed and concentration of RME at 50 % of maximum load.
Four additional runs were done in order to validate the models, see table 4. In spite of the good R2 and Q2 results, the models suffered from a lack of fit problem (LOF). The reasons for LOF can be; not enough terms in the model, there is need to transform the responses, to good replicates, outliers ruining the model as Eriksson et al (2000) describes.
Mode 5RME Load Speed
1 17 75 1200
2 19 60 1700
3 17 40 1200
4 19 301200 1700
Table 4 - Experimental condition for the evaluation sets
No outliners were found in the data that could explain the LOF. Extra experiments were added to analyze if the model suffered from of repeatability problems. Normal deviation for the speed and load were about one to two percent during three measurements and in most cases under one.
Figure 7 - Total hydrocarbon, measured and calculated from a two level full fractional design model. The 95 % confidence interval can
be seen in the figure as columns.
Figure 8 - Total hydrocarbon, measured and calculated from a three level full fractional design. The 95 % confidence interval can be
seen in the figure as columns.
The divergences were commonly somewhat higher for the load. Too sum up, it seemed to be no problem with the repeatability for the engine conditions.
Tests were also made to see if a transformation could be the remedy for the observed LOF. Results showed that transformation of data, exponential and logarithmic, had minor influence on the models.
In conclusion; the most likely explanation of the lack of fit is that the models simplify the reality too much. A plausible explanation of the LOF is therefore that one or more variables, for example air temperature or humidity has to be added to the models.
Examples showing the agreement between measured and calculated values of the emissions of total hydrocarbon are shown in figures 7 and 8. The two level factorial design gave a poor prediction of the emitted hydrocarbons while the three level factorial design have a much better predictive ability, cf. Fig 7 and 8. This is what could be expected, namely that more experiments leads to more accuracy. Also observe that the wide confidence interval in the two level factorial designs is due to the small number of replicates in this design, giving few degrees of freedom in the calculation of t .The accuracy for the model not showed, the composite face design, was somewhere between the accuracy of the two and three level full factorial designs models.
In order to see if the models were adequate to correctly predict the emission value of the ECE R49 cycle some more test were done. The task was not quite easy; the used experimental domain covered only four out of 13 steps in the ECR 49 cycle, see table 2 for more details. These steps, 1200 rpm, 10, 25, 50,and 75 % of max load, could thus be evaluated both with calculated and measured data. The necessity of and also the insecurity of extrapolating the remaining steps in the ECR R49 cycle were obvious. (Please notice that the ECE R49 value is actually just a weighted sum of the 13 different steps).
Models were developed for this purpose; see table 5 and figure 9. Included in the table are also the ECE R49 data from measurements with Etamax and the legislation according to Euro 2 and Euro 3 standard. While the agreement between predicted and measured NOX emissions was acceptable, roughly speaking between 10-15 %, the discrepancy between calculated/measured hydrocarbon and calculated/measured carbon monoxide were worse, approximately 25 %, see table 5. As earlier stated, the emissions of NOx from these types of engines are usually easier to predict than the emissions of hydrocarbons and carbon oxide. The main reason for the discrepancy was, however, that some of the values used are extrapolated and thus suffer from bias. The models did not accurately predict modes that are not covered by the experimental area. Hydrocarbon (g/kwh) Nitrogen oxides (g/kwh) Carbonoxide (g/kwh) Measured, 18% RME in Ethanol 1,04 4,08 2,98 Predicted 18%RME in Ethanol 0,76 4,51 2,26 Measured 20%RME in Ethanol 0.81 4,08 3.19 Predicted 20%RME in Ethanol 0,71 4,45 2,35 Etamax Swedish ethanol fuel 0,89 3,69 2,059 Euro 2 1,1 7,0 4,0 Euro 3 0,66 5 2,1
Table 5 – Raw exhaust gas emission from the engine in g/kwh.
Fig 9- Goodness of fit (R2) and goodness of prediction (Q2) for the models used for calculation of ECR 49 values. Notice the god agreement between (R2) and (Q2.
The results also showed that the emissions from the RME/ethanol mixture fuel are somewhat higher than from conventional Swedish fuel, Etamax. On the other hand, cost is markedly reduced (approximately 10 %). Both measured and predicted data showed that the engine exhaust emissions levels passed the Euro 2 standard without exhaust after treatment, but not the Euro 3. It can be anticipated that future requirements, Euro 3, Euro 4, could probably be fulfilled with appropriate exhaust gas after treatment
CONCLUSIONS.
An eleven-liters ethanol fueled diesel engine has been tested with various mixtures of a new ignition improver, rapeseed methyl ester, RME: Following conclusions can be drawn:
The statistically calculated models indicated that lowest level of exhaust emissions could be anticipated when using the fuel with 16 % RME in ethanol. However, if engine performance were taken into consideration, the optimum concentration of RME in ethanol was raised to 18 % or 20 % RME in ethanol that gave both good engine performances and low emissions.
Statistical modeling, DOE, is a way of extracting maximum amount of information in a minimum number of experiments. Optimum and interaction effects can easily be interpreted and good models established. By using DOE, it should be possible to simulate other test cycles used all around the world in an easy and cost-effective way.
Even if all models suffered from lack of fit god estimates were nevertheless achieved with the models. The best assumptions were made for NOx.
Better result have probable been obtained from the statistical evaluation if models with more terms had been used. This will be examined in further research with a extended number of variables such as temperatures, humidity and heat release measurements. The introduction of RME as an ignition improver can facilitate the implementation of ethanol fuel in the society. The main reason for this is that the ethanol price can be cut by almost 10 % if changing to this, new, ignition improver. Further investigations are therefore justified
ACKNOWLEDGMENTS
The authors want to express their sincere gratitude to ELAB AB for engaging the authors in this project. The authors also want to thank Grover Zurita Villaroel for help and consulting with the pressure pulse measurements.
REFERENCES
Olsson, L-O. (1996) Fordonskostnadens påverkan vid användande av biodrivmedel KFB - report 1996:28, (in Swedish).
Kremer F.G., Fachetti A., Alcohol as Automotive Fuel – Brazilian Experience, SAE paper 2000-01-1965
NUTEK B 1992: 4 ISBN 91-38-12742-1 (in Swedish).
Simonsen H., Chomiak J., (1995) Testing and Evaluation of Ignition Improvers for Ethanol use in a DI Diesel Engine, SAE paper 952512
Ali, Y., Hanna. M. A. (1996) Durability testing of a Diesel Fuel, Methyl Tallowate, and Ethanol Blend in a Cummins N14-410, Diesel Engine, Transactions of the ASAE Vol. 39(3) 793-797 Box, G. E. P.; Hunter, W. G., Hunter, J. S. (1978) Statistics for Experimenters, Wiley Interscience ISBN 0-471-09315-7
Martens, H., Naes T. (1991) Multivariate Calibration, John Wiley & Sons ISBN 0-471-93047-4
Egebäck, K-E., Pettersson, E. (1996) Reaserch on a 11 liter Ethanol Fueled Bus Engine, Research report Tulea 1996:13 ISSN 0347- 0881
Christensen, A., Ehrenberg, L., Haupt, D., Törnqvist, M.,
Westerholm, R. (1997) Chemical and biological characterisation of
exhaust emissions from ethanol and ethanol blended diesel fuels in comparison with neat diesel fuels, KFB report 1997:17 Eriksson, L., Johansson, E., Kettaneh-Wold, N., Wikström, C.; Wold, S. (2000) Design of Experiments: principles and applications UmetricsISBN 91-973730-0-1