Contents lists available at ScienceDirect
International Journal of Drug Policy
journal homepage: www.elsevier.com/locate/drugpoIllicit drug prices and quantity discounts: A comparison between a
cryptomarket, social media, and police data
Kim Moeller
a,⁎, Rasmus Munksgaard
b, Jakob Demant
c a Malmö University, Department of Criminology, Jan Waldenströmgata 25, SE- 205 06 Malmö, Swedenb École de criminologie, Université de Montréal. 3150, rue Jean-BrillantMontréal (QC) H3T 1N8, Montreal, Canada c Department of Sociology, Copenhagen University, Denmark. Øster Farimagsgade 5, 1014 Copenhagen K, Denmark
A R T I C L E I N F O Keywords:
Drug prices Risks and prices Sweden Cryptomarket Social media Online drug sales
A B S T R A C T
Background: Illicit drugs are increasingly sold on cryptomarkets and on social media. Buyers and sellers perceive these online transactions as less risky than conventional street-level exchanges. Following the Risks & Prices framework, law enforcement is the largest cost component of illicit drug distribution. We examine whether prices on cryptomarkets are lower than prices on social media and prices reported by law enforcement on primarily offline markets.
Methods: Data consists of online advertisements for illicit drugs in Sweden in 2018, scraped from the crypto-market Flugsvamp 2.0 (n = 826) and collected with digital ethnography on Facebook (n = 446). Observations are advertisements for herbal cannabis (n = 421), cannabis resin, hash (n = 594), and cocaine (n = 257) from 156 sellers. Prices are compared with estimates from Swedish police districts (n = 53). Three multilevel linear regression models are estimated, one for each drug type, comparing price levels and discount elasticities for each platform and between sellers on each platform.
Results: Price levels are similar on the two online platforms, but cocaine is slightly more expensive on social media. There are quantity discounts for all three drug types on both platforms with coefficients between -0.10 and -0.21. Despite the higher competition between sellers on cryptomarkets, prices are not lower compared to social media. Online price levels for hash and cocaine are similar to those reported by police at the 1 g level. Conclusion: Mean prices and quantity discounts are similar in the two online markets. This provides support for the notion that research on cryptomarkets can also inform drug market analysis in a broader sense. Online advertisements for drugs constitute a new detailed transaction-level data source for supply-side price informa-tion for research.
Introduction
Illicit drugs are very expensive. Cannabis is worth its weight in gold and cocaine is even more expensive. Illicit drug price levels display “extremely” large variation (Reuter & Caulkins, 2004). Research has examined this variation between countries (Červený & van Ours, 2019), regions (Clements, 2006), legal and illegal sources (Amlung et al., 2019), characteristics of the transaction (on the street, indoors etc.) (Lakhdar, Leleu, Vaillant & Wolff, 2013; Wilkins, Reilly & Casswell, 2005), cryptomarkets and the streets (Cunliffe, Martin, Décary-Hétu & Aldridge, 2017), and across distribution layers (Caulkins & Padman, 1993). A key finding is that the price per gram falls as the size of the transactions increase (Brown & Silverman, 1974; Caulkins & Pacula, 2006). These quantity discounts are fairly large (Caulkins & Reuter, 2006) and reflect the regular discounts as in legal markets
(Clements, 2006), but also the drug seller's goal of reducing the number of risky transactions and getting rid of inventory as fast as possible (Moeller & Sandberg, 2019).
Most of the research on illicit drug prices that examines the char-acteristics of the transaction and quantity discounts uses data collected by US law enforcement agencies, self-report surveys. While the surveys correlate strongly with other official sources (Caulkins, 2007), the midpoint price estimates from police have been found to be 10–20 percent lower than self-reports (Davenport & Caulkins, 2016). Data from police are subject to potentially greater bias because undercover police do not have the same relationship with the seller as the typical buyer. Surveys may be biased from asking “last acquisition” questions. If this acquisition was not representative of all acquisitions made by the user, surveys risk sampling users and not transactions (Bond, Caulkins, Scott, Kilmer & Dietze, 2014). A similar critique can be raised at
https://doi.org/10.1016/j.drugpo.2020.102969
⁎Corresponding author.
E-mail addresses: kim.moeller@mau.se (K. Moeller), rasmus.munksgaard@umontreal.ca (R. Munksgaard), jd@soc.ku.dk (J. Demant).
0955-3959/ © 2020 The Authors. Published by Elsevier B.V. This is an open access article under the CC BY license (http://creativecommons.org/licenses/BY/4.0/).
crowdsourced demand-side price data for cannabis posted online (Giommoni & Gundur, 2018).
There is still much to learn about illicit drug prices and their im-plications for drug use prevalence, crime, theory, and policy, but new data sources are needed (Caulkins & Reuter, 1996; Manski, Pepper & Petri, 2001; Moeller, 2018a; Smart, Caulkins, Kilmer, Davenport, & Midgette, 2017). In Europe, no transactional level data collected by law enforcement is available for research (Mounteney et al., 2016). We propose that the increase in online distribution constitute a novel source for supply-side data on prices of illicit drugs. The aim of this study is to measure and compare mean prices and quantity discounts for herbal cannabis, hash, and cocaine in two online markets, the Swedish cryptomarket Flugsvamp 2.0 and advertisements on Facebook. Our analysis focuses on these two markets, but we compare results with data collected by law enforcement on face-to-face drug prices. All data are from Sweden in 2017–2018.
Transaction characteristics and prices
The baseline framework for analysing illicit drug prices is risks and prices, based on transaction cost economic reasoning. The proposition is that sellers add a premium to compensate for various risks, collec-tively referred to as frictions—costs other than the product price. These costs come from the risk of arrest and incarceration, seizures of drugs and assets, violence from competitors or transaction partners (Caulkins & Reuter, 2010). Prices therefore vary by institutional context—na-tional drug policy and policing intensity—as well as more proximate risks associated with the particular transaction form. Since law en-forcement is the largest cost component (Reuter & Kleiman, 1986), we would expect indoor transactions to be cheaper than outdoors, and online transactions to be cheaper than offline.
However, the existing research indicates that the association be-tween transaction form and retail prices is not straightforward. In a sample of US arrestees, cannabis buyers paid higher prices for outdoor transactions (Pacula, Kilmer, Grossman, & Chaloupka, 2010) and New Zealand buyers paid more when they purchased from publicly acces-sible ‘tinny houses’ compared to personal markets (Wilkins et al., 2005). Conversely, users in a US household sample reported paying higher prices when cannabis transactions occurred in private dwellings (Caulkins & Pacula, 2006). Buyers may be willing to pay a premium to avoid legal risks and safer retail transactions could be more expensive. There is still much we do not understand about price variations and their relation to buyer and seller's legal risks (Caulkins & Reuter, 2010, 1996; Moeller, 2018b).
Another aspect that complicates the relationship between transac-tion form and prices is the quality of the drugs, their potency. Access to information plays a key role in illegal transactions because neither the seller nor the buyer knows the actual quality of the drugs or the re-liability of their transaction partner (Caulkins and Reuter, 2006). This uncertainty increases the chance of rip-offs, especially in transactions where there is social distance between the seller and buyer (Jacques, Allen & Wright, 2014). Lakhdar et al. (2013) found there was more price variation for cannabis resin purchased on the street, with little information on quality and seller reliability, and less variation for cocaine purchased at scheduled meetings where more information was available. In extension of this logic, Amlung et al. (2019) found that buyers were willing to pay extra for legally procured cannabis over il-legal cannabis of the same quality.
Compared to offline transactions, cryptomarkets, illicit online drug markets which use anonymizing networks (Martin, 2014), have a number of advantages in this regard. There is lower risks of violence and rip-offs as buyers have access to information on sellers and the quality of their drugs. Reputation systems, similar to those on eBay, and discussion forums enable buyers to identify dishonest sellers and com-municate with peers on questions concerning service and reliability (Bancroft & Reid, 2016; Van Hout & Bingham, 2013). Buyers in
cryptomarkets can peruse several sellers and their wares, which reduces search costs and increases competition between sellers (Hardy & Norgaard, 2016; Paquet-Clouston, Décary-Hétu & Morselli, 2018; Przepiorka, Norbutas & Corten, 2017). While this competition should push prices down, the cryptomarket administrators charge a transaction fee for providing and maintaining the platform, escrow services. The total effect on prices as compared to offline transactions remains un-clear. Maybe the extra costs of paying cryptomarket administrators imply that prices are similar or higher than offline, despite the lower risks and higher competition. Maybe prices are lower, because buyers are not willing to demand the same quantum at the higher price. Re-search on prices on cryptomarkets has found that most of the variation comes from differences between countries, but sellers with higher re-putation scores charge higher prices (Červený & van Ours, 2019). Cunliffe et al. (2017) found that cryptomarket prices within Australia for cocaine, MDMA, and herbal cannabis were comparable to street prices, but methamphetamine was much cheaper online.
Limited research has examined drug dealing on social media. Transactions here are reminiscent of cryptomarkets as they have a platform-like market structure with “groups” designated to selling drugs. Both small and large-scale vendors advertise in these groups and some have review systems for customer feedback. Social media drug dealing tends to be locally embedded (cities, parts of cities) compared to the regionally oriented cryptomarkets, and qualitative studies in-dicate that both buyers and sellers perceive online mediated transac-tions as low risk compared to conventional street-level transactransac-tions (Aldridge & Askew, 2017; Demant, Bakken, Oksanen & Gunnlaugsson, 2019; Moyle, Childs, Coomber & Barratt, 2019).
Quantity discounts
Research has consistently found substantial quantity discounts in illicit drug markets. One way to depict the relationship between price and quantity, suggested by Caulkins and Padman (1993), is the log of price-per-gram as a function of the log of quantity. The log-log structure implies that the relationship between quantity and price is measured in percentage terms. A coefficient of −0.25 means that a 1 percent in-crease in transaction size, quantity, is accompanied by a 0.25 percent decrease in unit price.
Caulkins and Padman (1993) found a mean quantity discount coefficient for four types of marijuana was −0.23 and −0.17 for six other drug types. Clements (2006) examined several approaches and found that cannabis discounts was about −0.25 in Australia. Wilkins et al. (2005) surveyed 5800 people in New Zealand and found a quantity discount of −0.19 for cannabis. Caulkins and Pacula (2006) analysed 3872 marijuana purchases from a U.S. household sample and found “substantial” quantity discounts with a coefficient of −0.57, a 0.57 percent decrease in cost per unit per percent increase in transac-tion size. A few studies have examined quantity discounts online. Przepiorka et al. (2017) found a mean quantity discount of −0.2 across nine drug types while Červený & van Ours, 2019 found −0.19 for herbal cannabis.
Smart, Caulkins, Kilmer, Davenport, & Midgette, 2017 analysed 36,001,228 transactions in Washington's legal cannabis market and found a mean quantity discount of −0.06. This discount is markedly smaller than what we see in studies of illegal markets, and supports the risks and prices framework. There is less variation in the institutional context and transactional forms in the legal market. In extension, the large discounts in Caulkins and Pacula's (2006) analysis of a household sample could reflect this variation in illegal contexts (see Moeller and Sandberg (2019) for reasons sellers provide discounts in illegal drug distribution).
Method
hash, and cocaine, on two online markets with the face-to-face trans-actional data collected by Swedish law enforcement. The sellers on the two online platforms commonly have several types of drugs for sale, and we apply multilevel hierarchical regression models to examine the variation in prices and discounts between sellers on each platform. Data
Data from Flugsvamp 2.0 was collected in collaboration with the DATACRYPTO project (see Décary-Hétu & Aldridge, 2015) between May and September in 2018, yielding 826 advertisements. Flugsvamp 2.0 provided specified categories for drug types and prices, but we also verified and coded them manually. The data collection follows the standard ethical protocol in the literature on cryptomarkets (Martin & Christin, 2016).
Screenshots of advertisements for the sale of illicit drugs on Swedish Facebook (n = 446) were collected as part of the NDDSM study on social media drug dealing (Demant et al., 2019). This study collected data between September and December 2017 from Danish, Finish, Icelandic, Norwegian, and Swedish social media sites (primarily Face-book and Instagram). We searched for upwards of 50 drug related keywords to locate advertisements for illicit drugs. From these searches, we located closed or hidden drug seller groups. We also located groups by observing semi-relevant Facebook groups such as pro-cannabis groups and groups for youths, where discussions of where to find drug sales groups were occasionally part of the activity. From the semi-open groups, the person's profiles or mentioned names could lead to drug seller groups. We used anonymous profiles to “lurk” these groups and gained access to hidden and closed groups by request or by invitation (from being members of similar groups). This is an established practice, grounded on the principles of ethnographic research and referred to as online ethnography (Hine, 2015; but see Kozinets, Dolbec, & Earley, 2014, for a discussion of the ethics). We continued the search for new groups until we reached a point of data saturation where we no longer discovered new groups or saw mentions of groups unknown to us. We documented all data in a non-traceable format and the research ethics committee at Copenhagen University approved the study. This data collection method complies with terms and conditions for the website as sellers advertising in these groups have made their posts publicly available according to the sites’ privacy principles.
Swedish police publish drug price data from all 53 police districts in reports, with information on mean, median, and ranges for various drugs at the 1 g and kilogram level (Guttormsson & Zetterqvist, 2020). We acquired standard deviations for the 1 g prices from Guttormsson through personal communication.
Statistical methods
We first compare the advertised mean prices for each drug type, using a Wilcox test due to relatively small samples and non-normality. To measure quantity discount, we follow the literature and examine a log-log relationship in which price per gram is a function of transaction size (Caulkins & Padman, 1993; Clements, 2006). We extend the model to include a dichotomous variable for the platform, Facebook or
Flugsvamp 2.0, and add an interaction between quantity and platform allowing the quantity discount to differ between the two. We apply this model to the products herbal cannabis (n = 421), hash (n = 594), and cocaine (n = 257).
Since different sellers offer products, it is reasonable to assume that prices set by the same seller are correlated. For example, a seller may source stock cheaper than the average seller and reduce price per gram while maintaining the population-level quantity discount. The OLS as-sumption of uncorrelated error terms is therefore untenable and we utilize multilevel hierarchical regression. Multilevel regression relaxes the assumption of uncorrelated error terms and accounts for group structure by estimating a separate intercept for each group, in our case the sellers (n = 156) (Gelman & Hill, 2006; Harrison et al., 2018). Models were fit in R using lme4 with REML, restricted maximum likelihood estimation (Bates, Mächler, Bolker & Walker, 2015; Steenbergen & Jones, 2002). Lastly, we use our model estimates to predict the 1 g and kilogram prices and compare with prices collected by law enforcement. All prices are in SEK.
Results
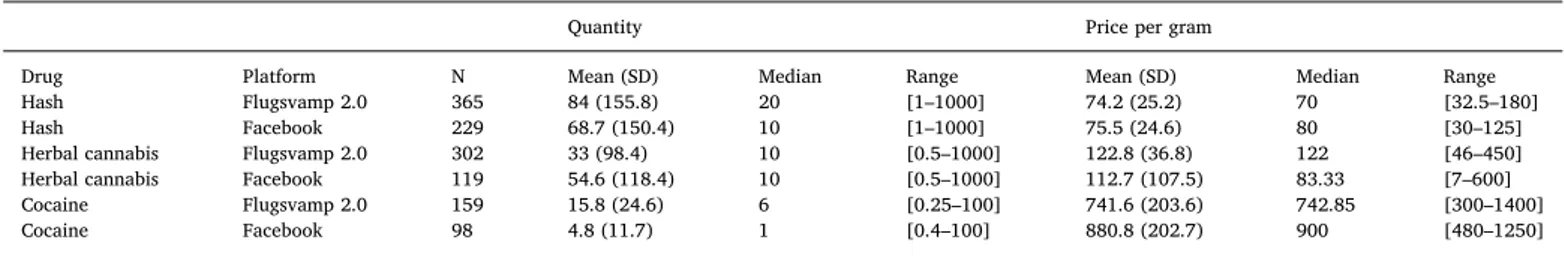
We first present the descriptive statistics of the online listings from the cryptomarket and social media. Next, we present the multilevel linear regression results for price and quantity discount for the three drug types. Lastly, we use the coefficients of the multilevel model to estimate predicted gram and kilogram prices and compare them with law enforcement data. Table 1 below, presents the mean advertised gram amounts and mean price per gram for the three drug types.
Cocaine is offered in smaller quantities on social media compared to on the cryptomarket while there is no significant difference in quan-tities for herbal cannabis and hash. The non-log-transformed quanquan-tities for difference in means are significantly different in a Wilcox test for cocaine (W = 11,510, p < 0.001) and hash (W = 47,702, p = 0.003), but not herbal cannabis (W = 17,348, p = 0.579). Cocaine is offered in mean quantities of 15.8 gram on Flugsvamp 2.0, and 4.8 gram on Facebook, whereas the mean quantity of hash on Flugsvamp is 84 gs as opposed to 68.7 gs, in both cases suggesting that significantly larger quantities are offered on Flugsvamp.
Table 2 shows the results for our regression models for each sub-stance type, and we begin by discussing the random, or group-level, findings and structure. ICC is the intra-class correlation, i.e. the corre-lation between observations within the same group (i.e. seller). We find high scores for all three models (0.61, 0.47 and 0.55), which suggests that price-per-gram is highly correlated within each vendor. This is documented in earlier research (Espinosa, 2019; Przepiorka et al., 2017), and provides evidence for the appropriateness of a multilevel design for the data structure. The marginal and conditional R2 are the
shares of the variance of prices explained by the fixed and random ef-fects (Nakagawa & Schielzeth, 2013). We find the highest value for the hash model, with a marginal R2 of 0.742.
σ2 designates the residual variance at the vendor level, and τ00 is
the intercept variance that shows the differences between vendors. The σ2 values shows that there is more residual variance for herbal (0.03)
cannabis compared to hash (0.01) and cocaine (0.02), suggestive of
Table 1
Descriptive statistics for online datasets.
Quantity Price per gram
Drug Platform N Mean (SD) Median Range Mean (SD) Median Range
Hash Flugsvamp 2.0 365 84 (155.8) 20 [1–1000] 74.2 (25.2) 70 [32.5–180]
Hash Facebook 229 68.7 (150.4) 10 [1–1000] 75.5 (24.6) 80 [30–125]
Herbal cannabis Flugsvamp 2.0 302 33 (98.4) 10 [0.5–1000] 122.8 (36.8) 122 [46–450] Herbal cannabis Facebook 119 54.6 (118.4) 10 [0.5–1000] 112.7 (107.5) 83.33 [7–600] Cocaine Flugsvamp 2.0 159 15.8 (24.6) 6 [0.25–100] 741.6 (203.6) 742.85 [300–1400]
more variation within this product class than the others. The τ00 values
shows that there is also more variance in herbal cannabis prices be-tween vendors (0.04), than there is variance bebe-tween vendors for hash (0.01) and cocaine (0.02). That is, the intercept, price of 1 gram of herbal cannabis, varies more among vendors than is the case for hash or cocaine. In our regression models, Flugsvamp 2.0 is the reference ca-tegory, and the variable Facebook therefore indicates the difference in price per gram between the two. While we find price differences for herbal cannabis (−0.04) and hash (−0.02), the estimate is only sig-nificant for cocaine (0.9, p = 0.045) suggesting a higher price for co-caine on social media.
The quantity and outcome, price-per-gram, are both log trans-formed. Therefore, the quantity discount coefficients may be inter-preted such that a 1% increase in quantity yields a discount of, for example, 0.17% in price-per-gram for herbal cannabis. Across both market types, we observe significant quantity discounts, similar for herbal cannabis (−0.17) and hash (−0.17), but markedly lower for cocaine (−0.1). The interaction between social media and quantity discount, shown in Fig. 1, may be interpreted as the change in quantity discount on social media relative to Flugsvamp. Thus, the quantity discount for herbal cannabis is −0.17 on Flugsvamp and −0.21 on Facebook. For all three substances, herbal cannabis (−0.04, p = 0.017), hash (−0.02, p = 0.012) and cocaine (−0.08, p < 0.001) we find that quantity discounts are significantly steeper on social media.
Lastly, we back-transform our log-scale estimates and produce es-timates for the price-per-gram of product in quantities of 1 and 1000 gs based on the fixed effects. As can be seen in Table 1 and Fig. 1, our estimates for hash and herbal cannabis may be more certain since we have observations up to 1 kg, whereas for cocaine our largest ob-servations are up to 100 gs. The estimated prices are presented in Fig. 2 below with 95% confidence intervals, along with the price estimates from Swedish police.
For herbal cannabis, we find a lower mean price for 1 g estimated by law enforcement (117, 95% CI: 111–122), which does not overlap with the confidence intervals of our model predictions (169.3, 95% CI: 152.4–188.0 on Facebook and 175.8, 95% CI: 160.6–192.3 on Flugsvamp 2.0). At the 1000 g level, the law enforcement data have a price of 52.6 per gram, which is higher than our estimates based on Facebook (39.6, 95% CI: 34.6–46.1) but slightly lower and within the confidence interval compared Flugsvamp 2.0 (54.1, 95% CI: 160.6–192.3).
For hash, the 1 g law enforcement estimate is lower (107, 95% CI: 102.6–111.4) compared to both Facebook (120, 95% CI: 114.7–126.6) and Flugsvamp 2.0 (122.4, 95% CI: 116.9–128.1), while the 1000 g estimate is higher (45.8) and outside of the confidence intervals of both Facebook (32.7, 95% CI: 30.7–34.8) and Flugsvamp 2.0 (38.0, 95% CI: 36.2–40.1).
The law enforcement data for 1 g cocaine prices (893, 95% CI: 905.7–1018.4) sits comfortably between the low Flugsvamp 2.0 prices (880.1, 95% CI: 827.2–936.4) and the high Facebook prices (960.4,
95% CI: 905.7–1018.4). At the 1000 g law enforcement estimate (385.6) is above the confidence intervals for Facebook prices (270.5, 95% CI: 225.3–324.8), and lower but within the confidence intervals from the Flugsvamp 2.0 data (428.8, 95% CI: 384.7–478.0).
Discussion
Summarizing the findings, we found low, and insignificant, differ-ences in price levels across the two online markets for herbal cannabis and hash, but cocaine was significantly more expensive on Facebook. There are significant quantity discount across all substance types, and steeper discounts (i.e., more negative coefficient) on Facebook for all three substances. Our coefficients for quantity discount were in the range of −0.10 to −0.21 and are, therefore, quite similar to what the existing research has found (Červený & van Ours, 2019; Clements, 2006). Price levels on the online marketplaces were similar to those reported by Swedish police, though markedly higher online for herbal cannabis.
While there is broad agreement among scholars for the notion that online drug vendors perceive their positions as less risky, we find little evidence that this associated with lower prices. Further, online plat-forms provide access to information on competitor's prices, which should increase competition and lead to lower prices (Paquet- Clouston et al., 2018). We did not find indications that competition has entailed lower price levels. For now, we speculate that online sellers require compensation for the expertise and time required to maintain anonymous accounts. By extension, they may also compete for custo-mers primarily on other parameters than price, such as trustworthiness. Cryptomarkets provide numerous features that improve trusting rela-tions. Our findings indicate that sellers charge a premium for con-ducting more complicated, lower risk transactions. Despite online drug prices being similarly high as the offline transactions, buyers may be willing to pay for the lower risks, shifting the demand curve to the right. This notion finds support in the research on the legal cannabis market where buyers will pay more for legally sourced cannabis compared to illegal cannabis of similar quality (Amlung et al., 2019).
While online drug markets constitute a limited share of the full re-tail market, research and law enforcement seizures document increases in total revenue, listings, sellers, sales, and overall size over time. These online drug markets remain embedded in offline drug markets in var-ious different ways. A large share of the distributed drugs supply the domestic retail market (Demant, Munksgaard & Houborg, 2018; Norbutas, 2018; Tzanetakis, 2018), and the encryption techniques in-troduced here are becoming the norm in offline drug distribution as well (Demant et al., 2019; Moyle et al., 2019; Søgaard, Kolind, Haller & Hunt, 2019). However, analysis of prices in these markets cannot pro-vide insight into overall market price trends unless there is a consistent relationship between the different markets. If risks and prices change in only one of the markets, this will presumably shift demand in the other markets as well. Future research should make systematic comparisons
Table 2
Online prices and quantity discounts.
Herbal cannabis Hash Cocaine
Predictors Esti-mates 95% CI p Esti-mates 95% CI p Esti-mates 95% CI p
Intercept 5.17 5.08 – 5.26 <0.001 4.81 4.76 – 4.85 <0.001 6.78 6.72 – 6.84 <0.001 Quantity −0.17 −0.19 – −0.15 <0.001 −0.17 −0.18 – −0.16 <0.001 −0.10 −0.12 – −0.09 <0.001 Facebook −0.04 −0.18 – 0.10 0.593 −0.02 −0.08 – 0.05 0.646 0.09 0.00 – 0.17 0.045 Facebook * Quantity −0.04 −0.07 – −0.01 0.017 −0.02 −0.03 – −0.00 0.012 −0.08 −0.11 – −0.05 <0.001 Random effects σ2 0.03 0.01 0.02 τ00 0.04 0.01 0.02 ICC 0.61 0.47 0.55 N 63 110 68 Observations 421 594 257 Marginal R2 / Conditional R2 0.497 / 0.806 0.742 / 0.864 0.484 / 0.769
of the various risks associated with transactions in all three markets. A strength of this study is that it provides detailed price data across different markets and products. The lower mean advertised amounts and higher price of cocaine on Facebook suggest a buyer behavior with emphasis on expediency and convenience. Some buyers may be willing to pay a higher price for cocaine in order to receive the product shortly. Other, infrequent users would be less concerned about prices and po-tency. Conversely, cryptomarket buyers may be more regular drug users or buyers that supply themselves and a small network of friends. If this is the case, some of the observed differences between platforms may reflect customer bases rather than distribution costs. The relative si-milarity in price levels presents questions for future research as it may be related to market characteristics or product purity, actual or per-ceived.
The variation between sellers, lowest for hash and highest for herbal cannabis, and marginal R2 scores (lowest for cocaine, highest for hash)
may reflect product characteristics. Hash has a more standardized format as compared to cocaine where purity varies substantially, as does the quality of herbal cannabis. The omitted potency variable is a key limitation in our comparison study. For cannabis, the relation be-tween quality and price is mostly one of perceived quality (Bancroft & Reid, 2016; Rhumorbarbe, Staehli, Broséus, Rossy & Esseiva, 2016). There is no systematic dilution of the product between distribution layers and THC-content is not the primary driver of price (Caulkins & Pacula, 2006; Lakhdar et al., 2013).
Potency is, however, an important facet of cocaine prices (Caulkins & Padman, 1993). Prior research has suggested that quality is a moti-vation for using cryptomarkets (Bancroft & Reid, 2016). Quantitative studies have failed to find evidence of advertised purities corresponding to actual purity (Rhumorbarbe et al., 2016), but the overall quality appears to be higher than street-level substances (Caudevilla et al., 2016). Thus, the relatively low difference in prices between the online
platforms and the law enforcement data could reasonably hide a sys-tematic difference in either the actual or perceived potency of products offered. The omission of potency may cause us to overestimate the quantity discount. Sellers may provide larger discounts for low potency product to get rid of low quality inventory (Moeller & Sandberg, 2019). However, Caulkins and Pacula (2006) noted that a variation in cannabis potency would probably be proportional across distribution layers, markets. We cannot exclude the possibility that the quality of drugs were consistently lower in one of our markets. This would make the discounts appear larger because we did not adjust for purity, but it would not undermine the finding that quantity discounts exist.
While our sample size is modest, the techniques for scraping transaction-level information allow for collection of a larger dataset and analyses with more statistical power. Drug dealing on commercial platforms constitute a novel innovation with potential for growth in
drug distribution that warrants further analysis. These platforms are more easily accessible than cryptomarkets and may consequently at-tract a broader segment of drug buyers. Many of the questions that the growing cryptomarket research has examined, e.g. on motivations and risk perceptions, and risk perceptions, could also applied to these markets. Collecting data from social media is time-consuming and contains less information on individual transactions compared to cryptomarkets, but the information can supplement what limited data is available to researcher from law enforcement sources.
With the limitations in mind, we hope our study has demonstrated the utility of using online marketplaces as a source for illicit drug prices. The findings demonstrate that, despite some differences mean prices and quantity discounts are relatively similar, especially in the two on-line markets. This provides support for the notion that research on cryptomarkets can also inform drug market analysis in a broader sense.
Supplementary materials
Supplementary material associated with this article can be found, in the online version, at doi:10.1016/j.drugpo.2020.102969.
References
Aldridge, J., & Askew, R. (2017). Delivery dilemmas: How drug cryptomarket users identify and seek to reduce their risk of detection by law enforcement. International
Journal of Drug Policy, 41, 101–109. https://doi.org/10.1016/j.drugpo.2016.10.010. Amlung, M., Reed, D. D., Morris, V., Aston, E. R., Metrik, J., & MacKillop, J. (2019). Price
elasticity of illegal versus legal cannabis: A behavioral economic substitutability analysis. Addiction (Abingdon, England), 114(1), 112–118. https://doi.org/10.1111/ add.14437.
Bancroft, A., & Reid, P. S. (2016). Concepts of illicit drug quality among darknet market users: Purity, embodied experience, craft and chemical knowledge. Int J Drug Policy,
35, 42–49. https://doi.org/10.1016/j.drugpo.2015.11.008.
Bates, D., Mächler, M., Bolker, B., & Walker, S. (2015). Fitting linear mixed-effects models using lme4. J Statistical Software, 67(1), 1–48. https://doi.org/10.18637/jss.v067. i01.
Bond, B., Caulkins, J. P., Scott, N., Kilmer, B., & Dietze, P. (2014). Are users’ most recent drug purchases representative? Drug and Alcohol Dependence, 142, 133–138. https:// doi.org/10.1016/j.drugalcdep.2014.06.016.
Brown, G. F., Jr, & Silverman, L. P. (1974). The retail price of heroin: Estimation and applications. Journal of the American Statistical Association, 69(34), 595–606. https:// doi.org/10.2307/2285989.
Caudevilla, F., Ventura, M., Fornís, I., Barratt, M. J., Vidal, C., Quintana, P., et al. (2016). Results of an international drug testing service for cryptomarket users. Int J Drug
Policy, 35, 38–41. https://doi.org/10.1016/j.drugpo.2016.04.017.
Caulkins, J. P. (2007). Price and purity analysis for illicit drug: Data and conceptual issues. Drug and Alcohol Dependence, 90, S61–S68. https://doi.org/10.1016/j. drugalcdep.2006.08.014.
Caulkins, J. P., & Pacula, R. L. (2006). Marijuana markets: Inferences from reports by the household population. J Drug Issues, 36(1), 173–200. https://doi.org/10.1177/ 002204260603600108.
Caulkins, J. P., & Padman, R. (1993). Quantity discounts and quality premia for illicit drugs. J American Statistical Association, 88(423), 748–757. https://doi.org/10.1080/ 01621459.1993.10476335.
Caulkins, J. P., & Reuter, P. (1996). The meaning and utility of drug prices. Addiction
(Abingdon, England), 91(9), 1261–1264.
Caulkins, J. P., & Reuter, P. (2006). Illicit drug markets and economic irregularities. Socio-
Economic Planning Sciences, 40(1), 1–14. https://doi.org/10.1016/j.seps.2004.08. 002.
Caulkins, J. P., & Reuter, P. (2010). How drug enforcement affects drug prices. Crime and
Justice, 39(1), 213–271. https://doi.org/10.1086/652386.
Červený, J., & van Ours, J. C. (2019). Cannabis prices on the dark web. European Economic
Review, 120, Article 103306. https://doi.org/10.1016/j.euroecorev.2019. 103306https://www.sciencedirect.com/science/article/pii/S0014292119301588. Clements, K. W. (2006). Pricing and packaging: The case of marijuana. J Business, 79(4),
2019–2044. https://doi.org/10.1086/503655.
Cunliffe, J., Martin, J., Décary-Hétu, D., & Aldridge, J. (2017). An island apart? Risks and prices in the Australian cryptomarket drug trade. Int J Drug Policy, 50, 64–73. https:// doi.org/10.1016/j.drugpo.2017.09.005.
Davenport, S. S., & Caulkins, J. P. (2016). Evolution of the United States marijuana market in the decade of liberalization before full legalization. Journal of Drug Issues,
46(4), 411–427. https://doi.org/10.1177/0022042616659759.
Décary-Hétu, D., & Aldridge, J. (2015). Sifting through the net: Monitoring of online offenders by researchers. European Review of Organised Crime, 2(2), 122–141. Available from: Https://standinggroups.ecpr.eu/sgoc/wp-content/uploads/sites/ 51/2020/01/decaryhetualdridge.pdf.
Demant, J., Bakken, S. A., Oksanen, A., & Gunnlaugsson, H. (2019). Drug dealing on Facebook, Snapchat and Instagram: A qualitative analysis of novel drug markets in the Nordic countries. Drug and Alcohol Review, 38(4), 377–385. https://doi.org/10. 1111/dar.12932.
Demant, J., Munksgaard, R., & Houborg, E. (2018). Personal use, social supply or redis-tribution? cryptomarket demand on Silk Road 2 and Agora. Trends in Organized Crime,
21(1), 42–61. https://doi.org/10.1007/s12117-016-9281-4.
Espinosa, R. (2019). Scamming and the reputation of drug dealers on Darknet Markets. Int
J Industrial Organization, 67, Article 102523. https://doi.org/10.1016/j.ijindorg. 2019.102523.
Gelman, A., & Hill, J. (2006). Data analysis using regression and multilevel/hierarchical
models. Cambridge: Cambridge University Press.
Giommoni, L., & Gundur, R. V. (2018). An analysis of the United Kingdom's cannabis market using crowdsourced data. Global Crime, 19(2), 85–106.
Guttormsson, U., & Zetterqvist, M. (2020). Narkotikaprisutvecklingen i Sverige 1988–2018. Centralförbundet för alkohol- och narkotikaupplysning (CAN), Rapport 181: Stockholm.
Hardy, R. A., & Norgaard, J. R. (2016). Reputation in the Internet black market: An
empirical and theoretical analysis of the Deep Web. Journal of Institutional Economics,
12(3), 515–539. https://doi.org/10.1017/S1744137415000454.
Harrison, X. A., Donaldson, L., Correa-Cano, M. E., Evans, J., Fisher, D. N., & Goodwin, C. E. (2018). A brief introduction to mixed effects modelling and multi-model inference in ecology. PeerJ, 6, e4794. https://doi.org/10.7717/peerj.4794.
Hine, C. (2015). Ethnography for the internet: Embedded, embodied and everyday. London, UK: Bloomsbury Publishing.
Jacques, S., Allen, A., & Wright, R. (2014). Drug dealers’ rational choices on which customers to rip-off. Int J Drug Policy, 25(2), 251–256. https://doi.org/10.1016/j. drugpo.2013.11.010.
Kozinets, R. V., Dolbec, P. Y., & Earley, A. (2014). Netnographic analysis: Understanding culture through social media data. In Uwe Fick (Ed.). The Sage handbook of qualitative
data analysis (pp. 262–276). London: Sage.
Lakhdar, C. B., Leleu, H., Vaillant, N. G., & Wolff, F. C. (2013). Efficiency of purchasing and selling agents in markets with quality uncertainty: The case of illicit drug transactions. European Journal of Operational Research, 226(3), 646–657. https://doi. org/10.1016/j.ejor.2012.12.003.
Manski, C. F., Pepper, J. V., & Petrie, C. V. (Eds.). (2001). Informing america's policy on
illegal drugs: What we don't know keeps hurting us. Washington, DC: National Research
Council, National Academy Press.
Martin, J. (2014). Lost on the Silk Road: Online drug distribution and the “crypto-market.”. Criminology and Criminal Justice, 14(3), 351–367. https://doi.org/10.1177/ 1748895813505234.
Martin, J., & Christin, N. (2016). Ethics in cryptomarket research. Int J Drug Policy, 35, 84–91. https://doi.org/10.1016/j.drugpo.2016.05.006.
Moeller, K. (2018a). Drug market criminology: Combining economic and criminological research on illicit drug markets. International Criminal Justice Review, 28(3), 191–205.
https://doi.org/10.1177/1057567717746215.
Moeller, K. (2018b). Video-recorded retail cannabis trades in a low-risk marketplace: Trade value and temporal patterns. Journal of Research in Crime and Delinquency,
55(1), 103–124. https://doi.org/10.1177/0022427817701256.
Moeller, K., & Sandberg, S. (2019). Putting a price on drugs: An economic sociological study of price formation in illegal drug markets. Criminology; an interdisciplinary
journal, 57(2), 289–313. https://doi.org/10.1111/1745-9125.12202.
Mounteney, J., Griffiths, P., Sedefov, R., Noor, A., Vicente, J., & Simon, R. (2016). The drug situation in Europe: An overview of data available on illicit drugs and new psychoactive substances from European monitoring. Addiction (Abingdon, England),
111(1), 34–48. https://doi.org/10.1111/add.13056.
Moyle, L., Childs, A., Coomber, R., & Barratt, M. J. (2019). # Drugsforsale: An exploration of the use of social media and encrypted messaging apps to supply and access drugs.
Int J Drug Policy, 63, 101–110. https://doi.org/10.1016/j.drugpo.2018.08.005. Nakagawa, S., & Schielzeth, H. (2013). A general and simple method for obtaining R2
from generalized linear mixed‐effects models. Methods in Ecology and Evolution, 4(2), 133–142. https://doi.org/10.1111/j.2041-210x.2012.00261.x.
Norbutas, L. (2018). Offline constraints in online drug marketplaces: An exploratory analysis of a cryptomarket trade network. Int J Drug Policy, 56, 92–100. https://doi. org/10.1016/j.drugpo.2018.03.016.
Pacula, R. L., Kilmer, B., Grossman, M., & Chaloupka, F. J. (2010). Risks and prices: The role of user sanctions in marijuana markets. The BE Journal of Economic Analysis &
Policy, 10(1), 1–36. https://doi.org/10.2202/1935-1682.1992.
Paquet-Clouston, M., Décary-Hétu, D., & Morselli, C. (2018). Assessing market competi-tion and vendors’ size and scope on AlphaBay. Int J Drug Policy, 54, 87–98. https:// doi.org/10.1016/j.drugpo.2018.01.003.
Przepiorka, W., Norbutas, L., & Corten, R. (2017). Order without law: Reputation pro-motes cooperation in a cryptomarket for illegal drugs. European Sociological Review,
33(6), 752–764. https://doi.org/10.1093/esr/jcx072.
Reuter, P., & Kleiman, M. A. (1986). Risks and prices: An economic analysis of drug enforcement. Crime and Justice, 7, 289–340. https://doi.org/10.1086/449116. Rhumorbarbe, D., Staehli, L., Broséus, J., Rossy, Q., & Esseiva, P. (2016). Buying drugs on
a darknet market: A better deal? Studying the online illicit drug market through the analysis of digital, physical and chemical data. Forensic Science International, 267, 173–182. https://doi.org/10.1016/j.forsciint.2016.08.032.
Smart, R., Caulkins, J. P., Kilmer, B., Davenport, S., & Midgette, G. (2017). Response to commentaries: New data sources for understanding cannabis markets. Addiction
(Abingdon, England), 112(2), 2180–2181.
Søgaard, T. F., Kolind, T., Haller, M. B., & Hunt, G. (2019). Ring and bring drug services: Delivery dealing and the social life of a drug phone. Int J Drug Policy, 69, 8–15.
https://doi.org/10.1016/J.DRUGPO.2019.02.003.
Steenbergen, M. R., & Jones, B. S. (2002). Modeling multilevel data structures. American
Journal of Political Science, 46(1), 218–237. https://doi.org/10.2307/3088424. Tzanetakis, M. (2018). Comparing cryptomarkets for drugs. A characterisation of sellers
and buyers over time. Int J Drug Policy, 56, 176–186. 0 https://doi.org/10.1016/j. drugpo.2018.01.022.
Van Hout, M. C., & Bingham, T. (2013). ‘Surfing the Silk Road’: A study of users’ ex-periences. Int J Drug Policy, 24(6), 524–529. https://doi.org/10.1016/j.drugpo.2013. 08.011.
Wilkins, C., Reilly, J. L., & Casswell, S. (2005). Cannabis ‘tinny’ houses in New Zealand: Implications for the use and sale of cannabis and other illicit drugs in New Zealand.
Addiction (Abingdon, England), 100(7), 971–980. https://doi.org/10.1111/j.1360- 0443.2005.01134.x.