Research Paper
Dual Effect of Rosuvastatin on Glucose Homeostasis Through Improved
Insulin Sensitivity and Reduced Insulin Secretion
Vishal A. Salunkhe
a, Inês G. Mollet
a, Jones K. Ofori
a, Helena A. Malm
a, Jonathan L.S. Esguerra
a,
Thomas M. Reinbothe
c, Karin G. Stenkula
b, Anna Wendt
a, Lena Eliasson
a,⁎
,1, Jenny Vikman
d,⁎
,1 aUnit of Islet Cell Exocytosis, Dept Clinical Sciences Malmö, Lund University Diabetes Centre, Lund University CRC 91-11, SUS Malmö, Jan Waldenströms gata 35, 205 02 Malmö, Sweden
bUnit of Glucose Transport and Protein Trafficking, Dept of Experimental Medical Sciences, Lund University Diabetes Centre, Lund University BMC-C11, Sölvegatan 21, 222 84 Lund, Sweden c
Inst. Neuroscience and Physiology, Dept of Physiology, University of Gothenburg, Medicinaregatan 11-13, Box 432, 405 30 Gothenburg, Sweden
d
Unit of Diabetes and Endocrinology, Dept Clinical Sciences Malmö, Lund University Diabetes Centre, Lund University CRC 60-13, SUS Malmö, Jan Waldenströms gata 35, 205 02 Malmö, Sweden
a b s t r a c t
a r t i c l e i n f o
Article history: Received 5 April 2016
Received in revised form 24 June 2016 Accepted 7 July 2016
Available online 9 July 2016
Statins are beneficial in the treatment of cardiovascular disease (CVD), but these lipid-lowering drugs are associ-ated with increased incidence of new on-set diabetes. The cellular mechanisms behind the development of diabetes by statins are elusive. Here we have treated mice on normal diet (ND) and high fat diet (HFD) with rosuvastatin. Under ND rosuvastatin lowered blood glucose through improved insulin sensitivity and increased glucose uptake in adipose tissue. In vitro rosuvastatin reduced insulin secretion and insulin content in islets. In the beta cell Ca2+signaling was impaired and the density of granules at the plasma membrane was increased
by rosuvastatin treatment. HFD mice developed insulin resistance and increased insulin secretion prior to admistration of rosuvastatin. Treatment with rosuvastatin decreased the compensatory insulin secretion and in-creased glucose uptake. In conclusion, our data shows dual effects on glucose homeostasis by rosuvastatin where insulin sensitivity is improved, but beta cell function is impaired.
© 2016 The Authors. Published by Elsevier B.V. This is an open access article under the CC BY-NC-ND license (http://creativecommons.org/licenses/by-nc-nd/4.0/). Keywords: Statin Insulin secretion Glucose uptake Glucose homeostasis Islet Beta cell Adipose tissue Muscle OGTT
Transmission electron microscopy Ca2+
measurements
1. Introduction
Western life style with excessive food intake and reduced physical activity is the leading cause of metabolic syndrome, including the fol-lowing criteria; increased abdominal waist line, elevated triglycerides, low HDL cholesterol levels, high blood pressure and insulin resistance (Grundy et al., 2004). Metabolic syndrome is a strong predictor for the development of cardiovascular disease (CVD), the leading cause of mor-tality world-wide (Preiss and Sattar, 2012). The major risk factor for CVD is hypercholesterolemia, and therefore statins are the major thera-peutic drugs used to prevent cardiovascular episodes. Statins decrease levels of low density lipoprotein cholesterol (LDL) in the blood by inhibiting 3-hydroxy-3-methyl-glutaryl coenzyme-A (HMG-CoA). Al-though proven beneficial for the treatment of CVD, there is emerging evidence suggesting increased incidence of new-onset diabetes with
statin use (Cederberg et al., 2015; Mora et al., 2010; Preiss and Sattar, 2012; Ridker et al., 2008; Ruscica et al., 2014; Sattar et al., 2010). The first study to report an increased incidence of diabetes with statins was the JUPITER trial, a double-blind randomized study comparing sub-jects assigned to rosuvastatin 20 mg or placebo (Mora et al., 2010; Ridker et al., 2008). Rosuvastatin has hydrophilic properties and is more potent in reducing cholesterol levels than pravastatin and simva-statin (Paoletti et al., 2001).
The mechanisms behind increased diabetes incidence by statins re-main to be investigated. A follow-up study in the METSIM cohort showed association between increased risk of diabetes with statins and impaired insulin sensitivity and insulin secretion (Cederberg et al., 2015). Others suggest improved insulin sensitivity by statins (Guclu et al., 2004; Okada et al., 2005; Paolisso et al., 1991; Sonmez et al., 2003). Insulin resistance leads to an increased pressure on the beta cells to se-crete more insulin. When the beta cell response is insufficient, fasting and postprandial hyperglycemia develops ultimately leading to type 2 diabetes. Normally, increased blood glucose stimulates beta cells to se-crete insulin through a Ca2+dependent process. We have previously
demonstrated that cholesterol in the plasma membrane of the beta
⁎ Corresponding author.
E-mail addresses:lena.eliasson@med.lu.se(L. Eliasson),jenny.vikman@med.lu.se
(J. Vikman).
1
Shared co-senior authorship.
http://dx.doi.org/10.1016/j.ebiom.2016.07.007
2352-3964/© 2016 The Authors. Published by Elsevier B.V. This is an open access article under the CC BY-NC-ND license (http://creativecommons.org/licenses/by-nc-nd/4.0/).
Contents lists available atScienceDirect
EBioMedicine
cell is essential for insulin secretion, and removal reduces glucose-stim-ulated insulin secretion byN50% (Vikman et al., 2009). Thus, although el-evated blood cholesterol is deleterious, sufficient cholesterol levels in cell membranes are vital. Hence, the balance between circulating and cellular levels needs to be tightly controlled. It is not known whether statins influence glucose metabolism through this balance or through a direct effect on beta cells. In favor of the latter, studies performed in cell lines suggest effects on small G-binding proteins (Li et al., 1993) and reduced voltage-dependent Ca2+influx (Okada et al., 2005; Salunkhe et al., 2016; Yada et al., 1999). Moreover, acute experiments with rosuvastatin in vitro in human islets have shown ultrastructural changes (Bugliani et al., 2013) and reduced insulin secretion (Zhao and Zhao, 2015).
The High Fat Diet (HFD) fed mouse is a widely used model to study insulin resistance (Winzell and Ahren, 2004), and the phenotype has many of the risk factors associated with metabolic syndrome (Grundy et al., 2004). The mice are obese, and have elevated cholesterol and blood glucose. The blood glucose is only slightly increased since the HFD mouse compensate with increased insulin secretion, further fuel-ing weight gain and insulin resistance (Winzell and Ahren, 2004). As many patients treated with statins have a high BMI, it is of interest to in-vestigate the mechanisms explaining the effect of statin treatment on glucose homeostasis in HFD mice compared to mice fed a normal diet (ND). Here we have studied the integrated role of rosuvastatin on glu-cose homeostasis and aimed to understand the cellular mechanisms by which rosuvastatin acts on insulin secretion and glucose uptake. 2. Materials and Methods
2.1. Animals
C57BL/6 female mice were delivered from Taconic, Denmark at 8 weeks. Mice were allowed to adapt to the surrounding for one week before given high-fat diet (HFD) and matched low-fat normal diet (ND) (Research Diets Inc, New Brunswick, USA). The ND contained the same ingredients with a closely matched composition to the HFD formula. After 4 weeks on ND or HFD mice part of the mice were given rosuvastatin (0.2 mg/mice/day; LKT Laboratories, MN, USA) in the drinking water for the rest of the study period. At the end of the study mice were sacrificed and tissues were collected for further analy-sis. The procedures used in the in vitro and in vivo studies were ap-proved by the ethical committee of Lund/Malmö.
2.2. OGTT and In Vivo Measurements
The in vivo study was performed according to the study plan (Fig. S1). OGTT was performed at week 0, 4, 8 and 12. Prior to OGTT mice were fasted for 4–6 h.D-Glucose was administered at 75 mg/mouse by oral gavage and blood was sampled from the vena saphena at 0, 15, 30, 60 and 120 min. The samples were immediately analyzed for glucose using a blood glucose meter (Accu-Check Aviva, Roche Diagnostics Scandinavia AB, Bromma, Sweden). Plasma samples were stored at −20 °C until being assayed for insulin ELISA (Mercordia, Uppsala, Swe-den). Blood samples to measure total cholesterol, triglycerides and HDL were collected at week 6, 10 and 12 and levels were determined using commercially available kits (HDL: HDL-cholesterol plus direct method (#981823); total cholesterol: InfinityTM Cholesterol Liquid Stable Re-agent (#TR13421); triglycerides: InfinityTM Triglycerides Liquid Stable Reagent (#TR22421); Thermo Fisher Scientific, VA, USA). LDL was esti-mated according to the manufacturer's instructions.
2.3. Isolation of Islets and Hormone Release Assays
Pancreatic islets were isolated by collagenase digestion and hand-picked prior to insulin secretion measurements. Insulin secretion was measured in static batch incubations as previously described (Vikman et al., 2009). Briefly, islets were pre-incubated in 1 mM glucose for
30 min followed by 1 h incubation in Krebs-Ringer bicarbonate buffer (pH = 7.4) with 10 mM HEPES, 0.1% bovine serum albumin and variable glucose as indicated (5.6, 11.1, and 16.7 mM). In some experiments the buffer was supplemented with 0.1μM GLP-1 (Bachem, Bubendorf, Swit-zerland) or 50 mM KCl (equimolar substituted for NaCl), respectively. Total insulin islet content was determined after extraction with acidic ethanol. Insulin secretion and islet content was measured using Radio Immuno Assay (RIA; Millipore, Solna, Sweden).
2.4. Ultrastructural Analysis
Mouse islets werefixed in 2.5% glutaraldehyde in freshly prepared Millonig's buffer and post-fixed in 1% osmium tetroxide before being dehydrated, embedded in AGAR 100 (Oxford Instruments Nordiska AB, Johanneshov, Sweden) and cut into ultrathin sections (70–90 nm). The sections were put on Cu-grids and contrasted using uranyl acetate and lead citrate. The islet containing sections were examined in a JEM 1230 electron microscope (JEOL-USA, Inc., Peabody, USA). Micrographs were analyzed with respect to the intracellular granule distribution as described elsewhere (Vikman et al., 2009).
2.5. Imaging and Ca2+Measurements
Imaging of insulin and glucagon staining was performed using con-focal microscopy imaging (Zeiss LSM 510). For calcium imaging islets were loaded with 4μM Fura 2-AM (TefLabs, Austin, USA) for 40 min followed by 30 minutes de-esterification in imaging buffer at pH 7.4 (mM: KCl 3.6, MgSO40.5, CaCl22.5, NaCl 140, NaHCO3, NaH2PO30.5,
HEPES 5). Imaging was performed with a Polychrome V monochroma-tor (TILL Photonics, Graefelfing, Germany) on a Nikon Eclipse Ti Micro-scope (Nikon, Tokyo, Japan) equipped with an ER-BOB-100 trigger, an iXON3 camera, and iQ2 software (Andor Technology, Belfast, UK). Re-cordings were performed at one frame per second at 37 °C under perfu-sion at 1 ml/min. A region was marked around each islet and the ratio of fluorescence emission intensity per unit area (μm2
) at 340 nm (expo-sure 150 ms) and 380 nm (expo(expo-sure 100 ms) was recorded. Parameters analyzed are described in Suppl Table 1.
2.6. Isolation and Glucose Uptake in Primary Adipocytes
Primary adipose cells were isolated from epididymal adipose tissue as previously described (Rodbell, 1964). The isolated cells were suspended (5% suspension) in Krebs-Ringer (KRH) medium containing 25 mM HEPES pH 7.4, 200 nM adenosine, 2 mM glucose and 3% BSA (w/ v), and glucose uptake measured as previously described (Gliemann et al., 1984). Briefly, cells were incubated in KRH medium (37 °C, shaking water bath) in triplicates with or without insulin (28 nM) for 30 min, followed by addition ofD-14C(U)-glucose (2.5μl/ml, NEC042, Perkin Elmer), and incubated for 30 min. The uptake was terminated by spin-ning 300μl of each cell suspension in microtubes containing 80 μl dinonylphtalate oil. The cell fraction was collected, dissolved in scintilla-tionfluid (Optima Gold, Perkin Elmer, Upplands Väsby, Sweden) and subjected to scintillation counting.
2.7. mRNA Expression Analysis
Pancreatic islets were lysed in Qiazol (Qiagen, Sollentuna, Sweden) and homogenized by vortexing. Total RNA was extracted using miRNeasy®Mini Kit protocol (Qiagen) and RNA concentration was measured on a NanoDrop (Thermo Scientific, Göteborg, Sweden). High Capacity cDNA Reverse Transcriptase Kit (Life Technologies, Stock-holm, Sweden) was used to generate RT-PCR according to the manufacturer's protocol.
The QuantStudio™ 7 Flex Real-Time PCR System (Life Technologies) was used to performed qPCR according to the TaqMan®Universal PCR Master Mix I protocol (Life Technologies) using the following primers
from TaqMan®Gene Expression Assays; SERCA2 (Mm01201431_m1), SERCA3 (Mm00443898_m1), Sel1l (Mm01326442_m1), CHOP (Mm01135937_m1), and Calb1 (Mm00486647_m1). Gene expression was normalized using Hprt (Mm004469_m1) and Ppia (Mm00478295_m1) as reference genes with theΔΔCt method.
2.8. Western Blot Analysis
Intact soleus muscle tissues were homogenized with a polytron (Omni International TH, Bebensee, Germany) in lysis buffer containing 50 mM Tris/HCl pH 7.5, 1 mM EGTA, 1 mM EDTA, 1 mM sodium
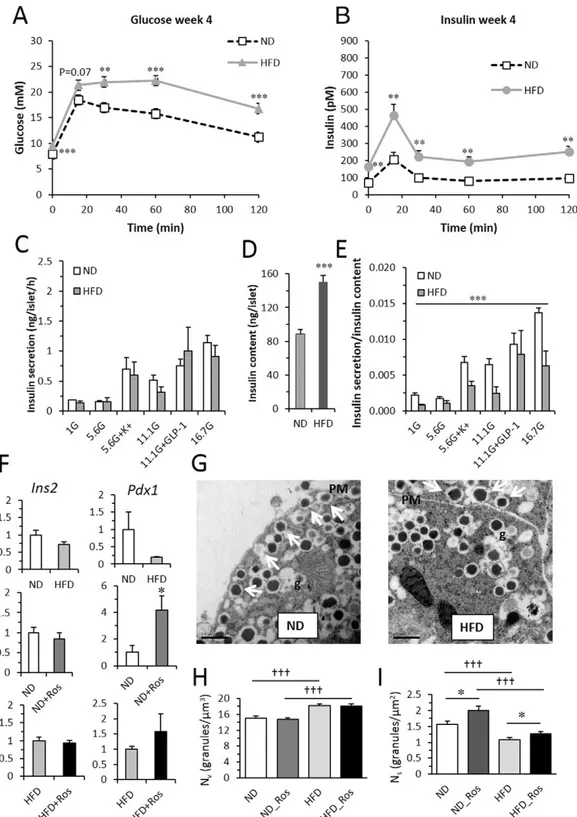
Fig. 1. In vivo and in vitro parameters from mice on ND and HFD. (A) Blood glucose and (B) insulin in mice after 4 weeks on ND (top) and HFD (bottom). Data presented as mean ± SEM of N = 14–25 mice; **p b 0.01 and ***p b 0.001 HFD vs ND using t-test for each time-point. For both glucose and insulin OGTT data: p b 0.001 ND vs HFD using 2 way repeated measures ANOVA (C) insulin secretion and (D) insulin content in isolated islets from mice on ND with and without rosuvastatin as indicated. Islets were incubated for 1 h in 1 mM, 5.6 mM, 11.1 mM and 16.7 mM glucose in the absence or presence of 50 mM K+
or 100 nM GLP-1. N = 4 ain each group ***pb 0.01 ND_Ros vs ND on effects of rosuvastatin (ordinary 2-way ANOVA). (E) Insulin secretion per insulin content from data in C–D. (F) Expression of Ins2 and Pdx1 in islet from ND and HFD with and without rosuvastatin. Data presented as mean ± SEM of N = 6 biological replicates,*pb 0.05 ND_Ros vs ND using t-test. (G) Ultrastructural images of beta cells from mice on ND (left) and HFD (right). Arrows indicate docked granules. PM - plasma membrane; g - granule. Scale bar 0.5μm. (H–I) Histogram of calculated volume density (Nv) and surface density (Ns) from beta cells from mice on ND and HFD with and without rosuvastatin as indicated. Data are mean of 54–65 cells from N = 3 mice in each group, *p b 0.05 ND_Ros vs ND or HFD_Ros vs HFD using t-test.
orthovanadate, 10 mM sodium-β-glycerophosphate, 50 mM sodium fluoride, 5 mM sodium pyrophosphate, 0.27 M sucrose, 1% NP-40, 1 mM dithiothreitol (DTT), and complete protease inhibitor cocktail (one tablet/50 ml). Lysates were centrifuged for 15 min at 10,000 × g and protein concentrations were determined by Bradford assay. Adi-pose tissue lysates were heated at 95 °C for 2 min in SDS sample buffer, subjected to polyacrylamide gel electrophoresis on pre-cast gradient gels (Biorad, Sundbyberg, Sweden) followed by electrotransfer to nitro-cellulose membrane. According to Bradford protein quantification 10 μg protein was loaded per sample. Membranes were blocked for 30 min in 50 mM Tris/HCl pH 7.6, 137 mM NaCl and 0.1% (w/v) Tween-20 (TBS-T) containing 10% (w/v) skim milk. The membranes were then probed with indicated antibodies in TBS-T containing 5% (w/v) milk or 5% (w/ v) BSA, for 16 h at 4 °C. Detection was performed using horseradish per-oxidase conjugated secondary antibodies and the chemiluminescence reagent. The signal was visualized using a BioRad Image camera and band intensities quantified using BioRad Imaging software (Biorad, CA, USA).
2.9. Calculations and Statistical Analysis
Data from the OGTT measurements was analyzed as described in (Pacini et al., 2013). In short ISI _Comp, a measure of insulin sensitivity in rodents adapted from Matsuda's method (Matsuda and DeFronzo, 1999), was calculated as 10,000/(√[G0× I0× Gmean× Imean]) where G0
and I0are starting values for glucose and insulin, and Gmeanand Imean
are average glucose and insulin values during the 120 min. Beta cell function was estimated as the BCIoralusing total AUC for insulin and
glu-cose measured during the 120 min (tAUC_ins/tAUC_gluc) or during the first 30 min (BCIoral0–30). Beta cell function was also estimated using
the suprabasal measures of AUC, sAUC, for insulin and glucagon (sBCIoral).
Data are presented as mean ± SEM. Statistical significance was de-termined using two-way ANOVA or two-tailed Student's t-test. 3. Results
3.1. Reduced Insulin Sensitivity and Increased Insulin Secretion in HFD Mice We were interested in comparing the effect of rosuvastatin under both normal diet (ND) and high fat diet (HFD) conditions. The ND was a low-fat diet matched in every way to the HFD composition except for the fat content. Mice were monitored for 12 weeks and repeated oral glucose tolerance tests (OGTTs) and cholesterol measurements
were performed (see study design and Suppl Fig. 1 for details). After 4 weeks on ND or HFD, mice were given rosuvastatin (0.2 mg/mice/ day) in the drinking water for the rest of the study period. Total choles-terol and LDL was significantly reduced after 2 weeks of treatment (study week 6) and the levels continued to decrease throughout the study in mice given rosuvastatin as compared to control mice (Suppl Fig. 2). Weight, food, and water intake was monitored (Suppl Fig. 3). HFD mice increased body weight gain compared to ND independent of rosuvastatin.
Mice on HFD for 4 weeks had significantly higher blood glucose and insulin response in vivo at all time-points measured compared to mice on ND (Fig. 1A-B) and ISI_Comp, an estimate of insulin sensitivity, was reduced by ~60% (Table 1). Confirming previous findings (Winzell and Ahren, 2004) that HFD mice have increased insulin resistance. Blood glucose (area under the curve for glucose (tAUCgluc)) as well as insulin
levels (tAUCins) were increased, with beta cell function (BCIoral) being
enhanced (Table 1). This pattern was persistent throughout the study. To assess beta cell function in more detail in vitro insulin secretion was performed on islets isolated at the end of the study (Fig. 1C-E). In agreement with the in vivo insulin secretion data, HFD mice had in-creased insulin content. At mRNA level Ins2 was not affected and Pdx1 was reduced by HFD (Fig. 1F). The increased insulin content was in line with ultrastructural data (Fig. 1G-I) and the total number of insulin granules was increased in HFD mice as compared to control mice (pb 0.001;Fig. 1H). HFD also resulted in reduced number of docked granules (pb 0.001;Fig. 1I). In vitro insulin secretion per se was not dif-ferent in islets from ND and HFD mice but when compensated for the in-creased insulin content insulin secretion was significantly decreased. 3.2. Rosuvastatin Reduces Insulin Content and Impairs Ca2+Signaling in
ND Mice
Next we measured the effect of rosuvastatin on glucose homeostasis in ND mice. In OGTT measurements after 4 weeks of rosuvastatin treat-ment (study week 8) we observed a decrease in glucose levels during thefirst 30 min (Fig. 2A andTable 1) reflecting an increase in insulin sensitivity (ISI_Comp;Table 1). We did not detect any significant glucose-induced changes in in vivo insulin secretion by rosuvastatin (Fig. 2B, D andTable 1).
In vitro, islets from rosuvastatin treated mice had lower response to all stimulatory secretagogues tested, and the effect of rosuvastatin was found to be overall significant (Fig. 2E). Insulin content was reduced by ~ 25% in islets from rosuvastatin treated mice (Fig. 2F). There was no significant difference in insulin secretion when compensated for
Table 1
Measured and calculated values from the OGTT. Values are estimated according to Pacini and co-workers (Pacini et al., 2013). tAUC_gluc– total area under curve for glucose, sAUC_ gluc – suprabasal area under curve for glucose, tAUC_ins– total area under curve for insulin, sAUC_ ins – suprabasal area under curve for insulin, D_ins_0–15 – Insulin response first 15 min, BCI – beta cell function based on total area, sBCI - suprabasal beta cell function based, ISI_Comp - insulin resistance. ND - normal diet, HFD - high fat diet, ND_Ros - ND with rosuvastatin, HFD_Ros - HFD with rosuvastatin. Data are presented as mean ± S.E. and the number of mice in each group were for week 0 N = 17–52, week 4 N = 12–25, week 8 N = 7–14 and week 12 N = 9–15. *p b 0.05, **p b 0.01 and ***p b 0.001 HFD vs ND or HFD_Ros vs ND_Ros; † p b 0.05, ††p b 0.01 and †††p b 0.001 ND_Ros vs ND or HFD_Ros vs HFD.
Week 0 Week 4 Week 8 Week 12
All ND HFD ND ND_Ros HFD HFD_Ros ND ND_Ros HFD HFD_Ros Basal glucose (t = 0) 8.1 ± 0.5 7.9 ± 0.2 9.6 ± 0.3⁎⁎ 7.6 ± 0.3 6.4 ± 0.6 8.0 ± 0.9 10.0 ± 0.4⁎⁎⁎ 6.4 ± 0.2 5.9 ± 0.2 8.6 ± 0.3⁎⁎⁎ 8.9 ± 0.3⁎⁎⁎ tAUC_gluc (∗102 ) 17.1 ± 0.6 17.6 ± 1.0 23.9 ± 1.2⁎⁎ 15.4 ± 0.1 12.4 ± 0.5 24.8 ± 1.6⁎⁎⁎ 22.9 ± 1.7⁎⁎⁎ 14.9 ± 1.2 12.2 ± 0.7 19.8 ± 0.9⁎⁎ 19.7 ± 0.9⁎⁎⁎ tAUC_gluc_0–30 (∗102 ) 4.4 ± 0.1 4.6 ± 0.2 5.6 ± 0.2⁎⁎ 4.7 ± 0.2 3.3 ± 0.3†† 4.9 ± 0.6 4.7 ± 0.6⁎ 4.4 ± 0.3 3.9 ± 0.2 5.5 ± 0.1⁎⁎⁎ 5.4 ± 0.2⁎⁎⁎ sAUC_gluc (∗102 ) 7.4 ± 0.7 8.1 ± 0.9 12.3 ± 1.2⁎⁎ 6.3 ± 1.0 4.1 ± 0.4 13.8 ± 1.5⁎⁎⁎ 11.0 ± 1.9⁎⁎ 7.3 ± 1.4 5.1 ± 0.7 9.5 ± 1.0 9.0 ± 0.8⁎⁎ sAUC_gluc_0–30 (∗102) 1.9 ± 0.1 2.3 ± 0.2 2.7 ± 0.2⁎ 2.4 ± 0.2 1.5 ± 0.2† 2.8 ± 0.4 2.5 ± 0.3⁎⁎ 2.4 ± 0.3 2.1 ± 0.1 2.9 ± 0.1 2.8 ± 0.2⁎ D_ins_0–15 16 ± 3 9.1 ± 2.5 19.8 ± 3.8⁎ 18.6 ± 3.4 15.2 ± 2.9 15.6 ± 3.8 20.8 ± 4.3 14.5 ± 2.5 14.0 ± 2.6 28.2 ± 2.7⁎⁎ 12.4 ± 3.9†† tAUC_ins (∗103 ) 16.0 ± 1.6 12.0 ± 0.9 29.5 ± 3.7⁎⁎ 14.8 ± 0.7 16.9 ± 0.6 33.1 ± 3.2⁎⁎⁎ 36.3 ± 3.2⁎⁎⁎ 13.2 ± 0.9 14.3 ± 0.9 47.7 ± 4.2⁎⁎⁎ 46.8 ± 6.0⁎⁎⁎ tAUC_ins_0–30 (∗103 ) 6.4 ± 0.8 4.3 ± 0.7 9.8 ± 1.3⁎⁎ 6.8 ± 0.5 5.7 ± 0.6 10.2 ± 0.6⁎ 12.6 ± 0.7⁎⁎ 5.8 ± 0.6 5.8 ± 0.6 17.1 ± 0.5⁎⁎⁎ 15.6 ± 0.5⁎⁎⁎ sAUC_ins 6.7 ± 1.4 3.7 ± 0.5 9.7 ± 3.2 4.6 ± 1.0 4.9 ± 0.9 7.8 ± 4.0 5.6 ± 1.9 3.1 ± 1.0 4.5 ± 1.1 8.1 ± 3.4 −3.8 ± 5.4† sAUC_ins_0–30 4.1 ± 0.8 2.3 ± 0.5 5.0 ± 1.0⁎ 4.3 ± 1.0 3.5 ± 0.5 3.9 ± 1.7 4.9 ± 1.7 3.2 ± 0.6 3.4 ± 0.6 7.3 ± 0.5⁎⁎ 2.8 ± 0.5††† BCI_oral 11.0 ± 1.0 7.0 ± 0.9 12.6 ± 1.6⁎ 10.9 ± 0.6 10.8 ± 0.5 14.4 ± 2.8 16.5 ± 2.3⁎⁎ 10.0 ± 0.7 10.8 ± 0.7 25.2 ± 2.6⁎⁎⁎ 25.0 ± 4.1⁎⁎ BCI_oral_0–30 16.9 ± 1.9 9.7 ± 1.6 18.7 ± 2.4⁎ 16.1 ± 1.6 15.4 ± 1.5 19.0 ± 3.7 21.9 ± 3.4 14.2 ± 1.4 14.4 ± 1.3 31.0 ± 3.5⁎⁎⁎ 29.7 ± 4.3⁎⁎ sBCI_oral 16.8 ± 3.9 5.1 ± 0.9 10.1 ± 3.0 13.5 ± 4.4 12.7 ± 2.5 8.8 ± 6.5 8.0 ± 5.5 6.5 ± 2.0 8.6 ± 2.3 10.1 ± 4.3 −3.3 ± 5.8† sBCI_oral_0–30 38.7 ± 9.0 11.9 ± 3.0 32.2 ± 11.0 22.2 ± 4.4 21.9 ± 4.1 16.1 ± 7.4 19.3 ± 7.6 15.7 ± 2.5 16.1 ± 2.8 26.6 ± 3.6⁎⁎⁎ 8.3 ± 4.0†† ISI_Comp 9.8 ± 0.8 10.5 ± 0.9 4.3 ± 0.4⁎⁎⁎ 9.4 ± 0.5 11.3 ± 0.6†† 3.6 ± 0.8⁎⁎⁎ 2.9 ± 0.5⁎⁎⁎ 10.9 ± 0.7 10.7 ± 0.5 2.5 ± 0.3⁎⁎⁎ 2.7 ± 0.5⁎⁎⁎
the reduced insulin content (Fig. 2G). Expression of Ins2 was not affect-ed by rosuvastatin, but Pdx1 mRNA was significantly increased (Fig. 1F middle panel). However, the ultrastructural analysis did not reveal any effect by rosuvastatin on the total number of insulin granules (Fig. 1H). In agreement with a reduced insulin secretion the density of docked granules was significantly increased (Fig. 1I; ND vs ND_Ros). This accu-mulation of granules at the plasma membrane, suggests defects in the fusion process. Confocal analysis confirmed that the ultrastructure of the islet remained intact after rosuvastatin treatment (Suppl Fig. 4).
Insulin secretion is Ca2+dependent and uptake of glucose generates
oscillations consisting of afirst rapid Ca2+
peak followed by a nadir and subsequent consistent oscillations, and impaired Ca2+response thus
di-rectly affects insulin secretion. We measured Ca2+oscillations in islets
from ND mice with and without rosuvastatin (Fig. 3A) and indeed sev-eral parameters in the Ca2 +response were changed in islets from
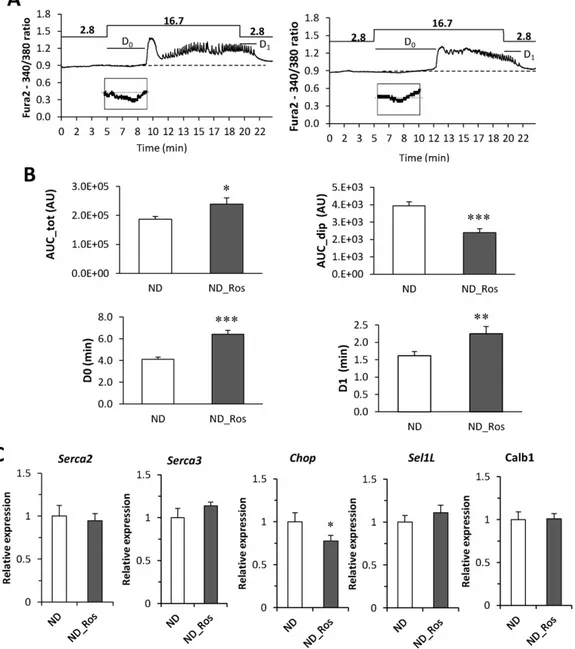
rosuvastatin treated mice (Fig. 3B). Normally, glucose-stimulation (16.7 mM) reduces the beta cell Ca2 + concentration transiently
reflecting Ca2 +
uptake into ER (Ad). This dip was reduced in the
rosuvastatin treated mice. Moreover, there was a significant increase in total Ca2 +influx (AUC_tot). The frequency of oscillations did not
change with rosuvastatin, but the reduction in Ca2 +after thefirst peak (C2) was significantly smaller (Suppl Table 1; p b 0.001).
The impaired Ca2+response and particularly the reduced re-uptake
of Ca2+to ER in rosuvastatin treated mice prompted us to investigate the expression of ER-related genes; SERCA2, SERCA3, Sel1l and CHOP (Chen et al., 2014; Francisco et al., 2011; Ravier et al., 2011) together
Fig. 2. In vivo blood glucose levels and insulin during OGTT and in vitro insulin secretion in ND mice. (A) Blood glucose and (B) insulin at study week 8 in ND mice with and without rosuvastatin for 4 weeks. Data presented as mean ± SEM of N = 11–14 mice; for glucose OGTT data: p b 0.01 ND vs HFD using 2 way repeated measures ANOVA (C–D). As in A–B, but at study week 12. Data presented as mean ± SEM of N = 9–14 mice; for glucose OGTT data: p b 0.071 ND vs HFD using 2 way repeated measures ANOVA (E) Insulin secretion and (F) insulin content in isolated islets from mice on ND with and without rosuvastatin. Islets were incubated for 1 h in 1 mM, 5.6 mM, 11.1 mM and 16.7 mM glucose in the absence or presence of 50 mM K+or 100 nM GLP-1 as indicated. (G) Insulin secretion per insulin content from data in E–F. Data are mean from N = 4 mice, **p b 0.01 ND_Ros vs ND on effects of
with Calb1, a gene we previously suggested to be involved in Ca2+
buff-ering (Christensen et al., 2015). Rosuvastatin reduced the expression of CHOP in mice on ND, but had no effect on the expression of the other genes investigated (Fig. 3C).
3.3. Rosuvastatin Improves Glucose Uptake and Reduces Insulin Secretion in HFD Mice
We next investigated effects of rosuvastatin on HFD mice. OGTTs re-vealed no further effect on either blood glucose or the insulin response by rosuvastatin after 4 weeks of rosuvastatin (study week 8;Fig. 4A–B). However, after 8 weeks on rosuvastatin (study week 12;Fig. 4C–D) the acute insulin response was significantly lower (Fig. 4D,Table 1). The in-sulin response to glucose was highly variable in the HFD mice treated with rosuvastatin (Suppl Fig. 6), and 4 out of 13 mice had no insulin re-sponse at all. Since HFD increased both insulin and glucose levels, we also analyzed the suprabasal AUC for insulin and glucose (sAUCgluc
and sAUCins), both indicators of the response to glucose stimulation
above basal levels. sAUCinswas reduced in the rosuvastatin treated
mice on HFD, and sBCIoralwas significantly decreased. The effects were
even more pronounced if values were measured during thefirst 30 min (sAUCins(0–30) and BCIoral(0–30);Table 1).
Insulin secretion in vitro was not reduced by rosuvastatin in any con-dition investigated in the HFD mice (Fig. 4E), but insulin content was slightly reduced (Fig. 4F). Therefore, insulin secretion per insulin con-tent (Fig. 4G) was increased. Even though insulin content was reduced the density of insulin granules was the same in HFD and HFD rosuvastatin treated mice (Fig. 1h). However, the number of docked granules was significantly increased (Fig. 1i).
We also investigated the expression of ER-related genes and Calb1 in mice on HFD with or without rosuvastatin treatment (Suppl Fig. 5). HFD diet reduced expression of SERCA3, Sel1l, CHOP and Calb1 compared to ND mice (Suppl Fig. 5A). Rosuvastatin did not have any further effect in the HFD mice (Suppl Fig. 5B).
Fig. 3. Ca2+
measurements on islets on ND with and without rosuvastatin. (A) Calcium measurements on islets from mice on ND (left) and ND with rosuvastatin (right). Oscillations were stimulated by addition of 16.7 mM glucose as indicated. (B) Histogram of analysis of the Ca2+
trace in A. AUCdip– area of initial dip in Ca2+before thefirst Ca2+peak (below baseline);
AUCtot– total area under the graph; D0- delay response to 16.7 mM glucose; D1– delay response to 2.8 mM glucose as indicated in A. Data are presented as of N = 20–22 islets, *p b 0.05,
**pb 0.01 and ***p b 0.001 ND vs ND_Ros using students t-test. (C) Expression of SERCA2, SERCA3, Sel1l, CHOP and Calb1 in islet from ND mice with and without rosuvastatin. Data presented as mean ± SEM of N = 6 biological replicates; *pb 0.05 ND vs ND_Ros using students t-test.
3.4. Rosuvastatin Improves Insulin Sensitivity and Increases Glucose Uptake We followed the calculated insulin sensitivity estimated as ISI_Comp (Table 1) over time for the four different conditions investigated (Fig. 5A), confirming previous observations that HFD reduce insulin sensitivity. This impairment in insulin sensitivity was confirmed in isolated adipocytes where both basal and insulin stimulated glucose uptake was reduced in HFD mice (Fig. 5B).
In ND mice, insulin sensitivity was improved by rosuvastatin treat-ment (study week 8; 4 weeks with rosuvastatin) while in HFD mice there was a tendency towards improved insulin sensitivity after 8 weeks of rosuvastatin treatment although the difference had only bor-derline significance. The improved insulin sensitivity could be verified in vitro in isolated adipocytes, where rosuvastatin increased basal (none insulin-stimulated) glucose uptake in ND mice (Fig. 5C). Most im-portantly, both basal and insulin stimulated glucose uptake was in-creased in the rosuvastatin treated HFD group (Fig. 5D). Most blood glucose is disposed in skeletal muscle tissue, and in the soleus muscle, we observed increased protein levels of GLUT4 after rosuvastatin treat-ment in ND mice, whereas the levels were decreased by rosuvastatin in
HFD mice (Fig. 5E–F). In addition, phosphorylated AMPK was signifi-cantly reduced in the HFD mice on rosuvastatin (Fig. 5E, G).
4. Discussion
Several studies propose an association between new on-set diabetes and statin treatment (Cederberg et al., 2015; Mora et al., 2010; Preiss and Sattar, 2012; Ridker et al., 2008; Ruscica et al., 2014; Sattar et al., 2010), but the precise mechanisms remain unknown. To obtain a better understanding of the possible cellular mechanisms by which statins in-fluence glucose homeostasis we performed detailed analysis in mice on ND and HFD treated with rosuvastatin. Our data suggests dual effects on glucose homeostasis with improved insulin sensitivity and reduced in-sulin secretion.
Current literature is conflicting concerning the effects of rosuvastatin on insulin sensitivity. Some studies speak in favor of statins and suggest that it improves insulin sensitivity (Guclu et al., 2004; Okada et al., 2005; Paolisso et al., 1991; Sonmez et al., 2003), whereas others report that statin treatment leads to increased insulin resistance (Cederberg et al., 2015; Jula et al., 2002; Ohmura et al., 2005), and some that statins
Fig. 4. In vivo blood glucose levels and insulin during OGTT and in vitro insulin secretion in HFD mice with and without rosuvastatin. (A) Blood glucose and (B) insulin at study week 8 in HFD mice with and without rosuvastatin for 4 weeks. Data presented as mean ± SEM of N = 9–13 mice (C–D). As in A–B, but at study week 12. Data presented as mean ± SEM of N = 9–14 mice (E). Insulin secretion and (F) insulin content in isolated islets from mice on HFD with and without rosuvastatin. Islets were incubated for 1 h in 1 mM, 5.6 mM, 11.1 mM and 16.7 mM glucose in the absence or presence of 50 mM K+or 100 nM GLP-1 as indicated. (G) Insulin secretion per insulin content from data in E–F. Data are presented as mean ± SEM of N = 4 mice,
have no effects on insulin sensitivity (Gannage-Yared et al., 2005; Koh et al., 2005). Our data show that rosuvastatin improves insulin sensitiv-ity. In our in vivo experiments this was most obvious in mice on ND, but we could observe a tendency also in the HFD mice. The effect could be dose dependent, since mice on ND, where the effect on insulin sensitivity was most pronounced, had slightly higher water intake. Our HFD mice became insulin resistant, and the effect of HFD seems to
override any effect of rosuvastatin. Our in vivo data is supported by in vitro measurements showing increased adipose glucose uptake in both ND and HFD mice treated with rosuvastatin. Interestingly, rosuvastatin raised primarily basal but also insulin-dependent glucose uptake. Hence, our data are in agreement with improved insulin sensi-tivity. In adipose and muscle cells, glucose uptake is facilitated through insulin-regulated glucose-transporter GLUT4, some situated in clusters
Fig. 5. Insulin sensitivity and glucose uptake in ND and HFD mice with or without rosuvastatin. (A) Insulin sensitivity (ISI_Comp) in ND and HFD mice treated with and without rosuvastatin. Data are presented as mean ± SEM of 7–25 mice (seeTable 1), ***pb 0.001 HFD vs ND or HFD_Ros vs ND_Ros; ††p b 0.01 ND_Ros vs ND using t-test. (B) Glucose uptake in adipocytes from mice on ND and HFD. Uptake was measured in absence (basal) and presence of insulin (insulin). Data are mean ± SEM of N = 4 mice. (C) Glucose uptake in adipocytes from mice on ND without (Ctrl) and with rosuvastatin. Uptake was measured in absence (basal) and presence of insulin (insulin). White– ND, grey - ND_Ros; ***p b 0.001 ND_Ros vs ND using t-test. (D) Glucose uptake in adipocytes from mice on HFD with and without rosuvastatin. Uptake was measured in the absence and presence of insulin. Grey bar-HFD; black bar– HFD_Ros. *p b 0.05, **p b 0.01 HFD_Ros vs HFD. (E) Western blot analysis of pAMPK (AMPK p172), AMPK tot, GLUT4 and actin in the soleus muscle of mice on ND and HFD with or without rosuvastatin as indicated. Data presented is from 4 groups/mice per condition, 10μg protein per lane. (F) Summary of data in E. Histogram of GLUT4 levels normalized to actin (left) and (G) phosphorylated AMPK (AMPK p172) normalized to total AMPK (AMPK tot) in the soleus muscle under the 4 different conditions investigated. Data are presented as mean ± SEM of N = 4 biological replicates in each group, *pb 0.05, **p b 0.01 vs without rosuvastatin using t-test.
at the plasma membrane (Stenkula et al., 2010). In the basal state, only a few GLUT4 transporters are present at the membrane (Stenkula et al., 2010). Thus, it can be suggested that rosuvastatin either increases the basal GLUT4 translocation, possibly through membrane alteration, or affects mechanisms downstream of the insulin receptor. We observed that rosuvastatin increased GLUT4 protein levels in the soleus muscle of ND mice, whereas in HFD mice it decreased GLUT4 levels. This might explain the larger improvement of insulin sensitivity in rosuvastatin treated mice on ND as compared to HFD, since the majority of glucose uptake in vivo is through muscle (Thiebaud et al., 1982). Insulin stimulation increases the number of GLUT4 in the plasma membrane, but muscle contraction also stimulates translocation of GLUT4 to the plasma membrane independent of insulin (Fushiki et al., 1989).
How could the reported increased incidence of new on-set diabetes with statins be explained? Knowledge regarding statin effects on beta cell function is scarce, except for a recent study suggesting impaired in-sulin secretion with statins (Cederberg et al., 2015). We therefore also investigated beta cell function in more detail in vivo and in vitro. Our data confirms a rosuvastatin-induced impairment of beta cell function and reduced insulin secretion in vitro, but not in vivo. The observed dif-ferences might be explained by absence of the complex integrated re-sponse from e.g. incretins and neuronal input in the in vitro insulin secretion measurements on isolated islets. In vivo the most pronounced effect was observed in HFD mice, and the increase in insulin secretion by HFD was counteracted by rosuvastatin. The in vitro insulin secretion measurements were presented both as per islet and per insulin content and insulin content data is also given. The data obtained when measur-ing insulin secretion per islet is the summed effect by changes in insulin content and effects on the insulin secretion process. When insulin is expressed as per insulin content this factor is taken into account and the changes measured are due to direct effects on the insulin secretion process. In the three different scenarios measured here this suggests that 1) HFD increases insulin content and inhibits the insulin secretion process; 2) rosuvastatin treatment in ND mice mainly reduces insulin content; and 3) rosuvastatin treatment in HFD mice reduces insulin content and amplifies the insulin secretion process.
How does then rosuvastatin disturb beta cell function? Our investi-gation shows a profound reduction of insulin content although the total number of granules remains unchanged. This is in agreement with experiments in MIN6 cells showing reduced insulin-synthesis via a disturbed metabolism (Zhou et al., 2014). We could not detect any changes in Ins2 mRNA, but still protein processing could be disturbed. The reduced insulin content together with the increased number of docked granules and disturbed Ca2+
signaling shows that rosuvastatin has multiple cellular effects that contribute to the impaired insulin se-cretion. Disturbed Ca2 +signaling can be due to impaired influx of
Ca2+through voltage-dependent Ca2+channels. Indeed we have re-cently shown reduced Ca2 + current in INS-1832/13 treated with
rosuvastatin (Salunkhe et al., 2016) and simvastatin has in other beta cell lines been demonstrated to reduce the Ca2+current (Yada et al., 1999; Zhou et al., 2014). Our Ca2 +measurements show changes in
the transient Ca2+response to glucose. The observed reduction in the
Ca2+dip suggests an incipient ER-stress. In consonance, CHOP was
re-duced in ND mice suggesting a protective mechanism counteracting ER-stress. Atorvastatin has also been shown to reduce the expression of CHOP and other ER-stress markers (Chen et al., 2014).
In conclusion, we have demonstrated that rosuvastatin reduces blood glucose through improved insulin sensitivity. Therefore, rosuvastatin has an overall positive effect on glucose homeostasis. How-ever, we observed deleterious effects on the beta cells in vitro which may be detrimental in the long run. More specifically, from a long term perspective an impaired beta cell function, with reduced insulin content and disturbed Ca2+signaling, will accelerate the risk of oping hyperglycemia. Hence, individuals susceptible to diabetes devel-opment are likely to be more sensitive to the negative effect of
rosuvastatin treatment on beta cells, which could explain the associa-tion between increased risk of new-onset diabetes and statin treatment. Conflict of Interest
The authors have no conflict of interest. Authors Contribution
VAS, AW, LE and JV designed the study. VAS, IM, KS, HM, JO, TR, KS, AW, and JV performed experiments, VAS, IM, KS, AW, LE and JV partici-pated in analysis and interpretation of data. LE and JV drafted the manuscript. VAS, IM, KS, HM, JO, TR, KS, AW, LE and JV revised the manuscript critically for important intellectual content and approved a final version.
Acknowledgements
We acknowledge the technical assistance from Britt-Marie S Nilsson and Anna-Maria Veljanovska-Ramsay. We are thankful for support from Swedish Research Council (project grant (LE: 2012-13147; KS: 2013-3542, LUDC, Exodiab)), ALF Region Skåne ALFSKANE-450661, Albert Påhlsson Foundation, Diabetesfonden DIA 2013-055 and LU Medical Faculty.
Appendix A. Supplementary data
Supplementary data to this article can be found online athttp://dx. doi.org/10.1016/j.ebiom.2016.07.007.
References
Bugliani, M., Syed, F., Masini, M., Marselli, L., Suleiman, M., Novelli, M., Filipponi, F., Boggi, U., Masiello, P., De Tata, V., et al., 2013.Direct effects of rosuvastatin on pancreatic human beta cells. Acta Diabetol. 50, 983–985.
Cederberg, H., Stancakova, A., Yaluri, N., Modi, S., Kuusisto, J., Laakso, M., 2015.Increased risk of diabetes with statin treatment is associated with impaired insulin sensitivity and insulin secretion: a 6 year follow-up study of the METSIM cohort. Diabetologia 58, 1109–1117.
Chen, Z.Y., Liu, S.N., Li, C.N., Sun, S.J., Liu, Q., Lei, L., Gao, L.H., Shen, Z.F., 2014.Atorvastatin helps preserve pancreatic beta cell function in obese C57BL/6 J mice and the effect is related to increased pancreas proliferation and amelioration of endoplasmic-reticu-lum stress. Lipids Health Dis. 13, 98.
Christensen, G.L., Jacobsen, M.L., Wendt, A., Mollet, I.G., Friberg, J., Frederiksen, K.S., Meyer, M., Bruun, C., Eliasson, L., Billestrup, N., 2015.Bone morphogenetic protein 4 inhibits insulin secretion from rodent beta cells through regulation of calbindin1 expression and reduced voltage-dependent calcium currents. Diabetologia 58, 1282–1290.
Francisco, A.B., Singh, R., Sha, H., Yan, X., Qi, L., Lei, X., Long, Q., 2011.Haploid insufficiency of suppressor enhancer Lin12 1-like (SEL1L) protein predisposes mice to high fat diet-induced hyperglycemia. J. Biol. Chem. 286, 22275–22282.
Fushiki, T., Wells, J.A., Tapscott, E.B., Dohm, G.L., 1989.Changes in glucose transporters in muscle in response to exercise. Am. J. Phys. 256, E580–E587.
Gannage-Yared, M.H., Azar, R.R., Amm-Azar, M., Khalife, S., Germanos-Haddad, M., Neemtallah, R., Halaby, G., 2005.Pravastatin does not affect insulin sensitivity and adipocytokines levels in healthy nondiabetic patients. Metabolism 54, 947–951.
Gliemann, J., Rees, W.D., Foley, J.A., 1984.The fate of labelled glucose molecules in the rat adipocyte. Dependence on glucose concentration. Biochim. Biophys. Acta 804, 68–76.
Grundy, S.M., Brewer Jr., H.B., Cleeman, J.I., Smith Jr., S.C., Lenfant, C., 2004.Definition of metabolic syndrome: report of the National Heart, Lung, and Blood Institute/Ameri-can Heart Association conference on scientific issues related to definition. Circulation 109, 433–438.
Guclu, F., Ozmen, B., Hekimsoy, Z., Kirmaz, C., 2004.Effects of a statin group drug, prava-statin, on the insulin resistance in patients with metabolic syndrome. Biomed. Pharmacother. 58, 614–618.
Jula, A., Marniemi, J., Huupponen, R., Virtanen, A., Rastas, M., Ronnemaa, T., 2002.Effects of diet and simvastatin on serum lipids, insulin, and antioxidants in hypercholesterol-emic men: a randomized controlled trial. JAMA 287, 598–605.
Koh, K.K., Quon, M.J., Han, S.H., Chung, W.J., Ahn, J.Y., Seo, Y.H., Choi, I.S., Shin, E.K., 2005.
Additive beneficial effects of fenofibrate combined with atorvastatin in the treatment of combined hyperlipidemia. J. Am. Coll. Cardiol. 45, 1649–1653.
Li, G., Regazzi, R., Roche, E., Wollheim, C.B., 1993.Blockade of mevalonate production by lovastatin attenuates bombesin and vasopressin potentiation of nutrient-induced in-sulin secretion in HIT-T15 cells. Probable involvement of small GTP-binding proteins. Biochem. J. 289 (Pt 2), 379–385.
Matsuda, M., DeFronzo, R.A., 1999.Insulin sensitivity indices obtained from oral glucose tolerance testing: comparison with the euglycemic insulin clamp. Diabetes Care 22, 1462–1470.
Mora, S., Glynn, R.J., Hsia, J., MacFadyen, J.G., Genest, J., Ridker, P.M., 2010.Statins for the primary prevention of cardiovascular events in women with elevated high-sensitivity C-reactive protein or dyslipidemia: results from the Justification for the Use of Statins in Prevention: An Intervention Trial Evaluating Rosuvastatin (JUPITER) and meta-analysis of women from primary prevention trials. Circulation 121, 1069–1077.
Ohmura, C., Watada, H., Hirose, T., Tanaka, Y., Kawamori, R., 2005.Acute onset and wors-ening of diabetes concurrent with administration of statins. Endocr. J. 52, 369–372.
Okada, K., Maeda, N., Kikuchi, K., Tatsukawa, M., Sawayama, Y., Hayashi, J., 2005. Prava-statin improves insulin resistance in dyslipidemic patients. J. Atheroscler. Thromb. 12, 322–329.
Pacini, G., Omar, B., Ahren, B., 2013.Methods and models for metabolic assessment in mice. J. Diabetes Res. 2013, 986906.
Paoletti, R., Fahmy, M., Mahla, G., Mizan, J., Southworth, H., 2001.Rosuvastatin demon-strates greater reduction of low-density lipoprotein cholesterol compared with pravastatin and simvastatin in hypercholesterolaemic patients: a randomized, double-blind study. J. Cardiovasc. Risk 8, 383–390.
Paolisso, G., Sgambato, S., De Riu, S., Gambardella, A., Verza, M., Varricchio, M., D'Onofrio, F., 1991.Simvastatin reduces plasma lipid levels and improves insulin action in elder-ly, non-insulin dependent diabetics. Eur. J. Clin. Pharmacol. 40, 27–31.
Preiss, D., Sattar, N., 2012.Pharmacotherapy: statins and new-onset diabetes—the impor-tant questions. Nat. Rev. Cardiol. 9, 190–192.
Ravier, M.A., Daro, D., Roma, L.P., Jonas, J.C., Cheng-Xue, R., Schuit, F.C., Gilon, P., 2011.
Mechanisms of control of the free Ca2+
concentration in the endoplasmic reticulum of mouse pancreatic beta-cells: interplay with cell metabolism and [Ca2+
]c and role of SERCA2b and SERCA3. Diabetes 60, 2533–2545.
Ridker, P.M., Danielson, E., Fonseca, F.A., Genest, J., Gotto Jr., A.M., Kastelein, J.J., Koenig, W., Libby, P., Lorenzatti, A.J., MacFadyen, J.G., et al., 2008.Rosuvastatin to prevent vascular events in men and women with elevated C-reactive protein. N. Engl. J. Med. 359, 2195–2207.
Rodbell, M., 1964.Metabolism of isolated fat cells. I. Effects of hormones on glucose me-tabolism and lipolysis. J. Biol. Chem. 239, 375–380.
Ruscica, M., Macchi, C., Morlotti, B., Sirtori, C.R., Magni, P., 2014.Statin therapy and related risk of new-onset type 2 diabetes mellitus. Eur. J. Intern. Med. 25, 401–406.
Salunkhe, V.A., Elvstam, O., Eliasson, L., Wendt, A., 2016 Mar 17. Rosuvastatin Treatment Affects Both Basal and Glucose-Induced Insulin Secretion in INS-1 832/13 Cells. PLoS One 11 (3), e0151592. http://dx.doi.org/10.1371/journal.pone.0151592
eCollection 2016.
Sattar, N., Preiss, D., Murray, H.M., Welsh, P., Buckley, B.M., de Craen, A.J., Seshasai, S.R., McMurray, J.J., Freeman, D.J., Jukema, J.W., et al., 2010.Statins and risk of incident di-abetes: a collaborative meta-analysis of randomised statin trials. Lancet 375, 735–742.
Sonmez, A., Baykal, Y., Kilic, M., Yilmaz, M.I., Saglam, K., Bulucu, F., Kocar, I.H., 2003.
Fluvastatin improves insulin resistance in nondiabetic dyslipidemic patients. Endo-crine 22, 151–154.
Stenkula, K.G., Lizunov, V.A., Cushman, S.W., Zimmerberg, J., 2010.Insulin controls the spatial distribution of GLUT4 on the cell surface through regulation of its postfusion dispersal. Cell Metab. 12, 250–259.
Thiebaud, D., Jacot, E., DeFronzo, R.A., Maeder, E., Jequier, E., Felber, J.P., 1982.The effect of graded doses of insulin on total glucose uptake, glucose oxidation, and glucose stor-age in man. Diabetes 31, 957–963.
Vikman, J., Jimenez-Feltstrom, J., Nyman, P., Thelin, J., Eliasson, L., 2009.Insulin secretion is highly sensitive to desorption of plasma membrane cholesterol. FASEB J. 23, 58–67.
Winzell, M.S., Ahren, B., 2004.The high-fat diet-fed mouse: a model for studying mecha-nisms and treatment of impaired glucose tolerance and type 2 diabetes. Diabetes 53 (Suppl. 3), S215–S219.
Yada, T., Nakata, M., Shiraishi, T., Kakei, M., 1999.Inhibition by simvastatin, but not prav-astatin, of glucose-induced cytosolic Ca2+
signalling and insulin secretion due to blockade of L-type Ca2+
channels in rat islet beta-cells. Br. J. Pharmacol. 126, 1205–1213.
Zhao, W., Zhao, S.P., 2015.Different effects of statins on induction of diabetes mellitus: an experimental study. Drug Des. Devel. Ther. 9, 6211–6223.
Zhou, J., Li, W., Xie, Q., Hou, Y., Zhan, S., Yang, X., Xu, X., Cai, J., Huang, Z., 2014.Effects of simvastatin on glucose metabolism in mouse MIN6 cells. Journal of Diabetes Res. 2014, 376570.