The Effects on Absorbed Dose Distribution in Intraoral X-ray
Imaging When Using Tube Voltages of 60 and 70 kV for Bitewing
Imaging
Kristina Hellén-Halme
1, Mats Nilsson
1,21Department of Oral and Maxillofacial Radiology, Faculty of Odontology, Malmö University, Malmö, Sweden. 2Department of Radiation Physics, Skåne University Hospital, Malmö, Sweden.
Corresponding Author: Kristina Hellén-Halme
Department of Oral and Maxillofacial Radiology, Malmö University SE-205 06 Malmö
Sweden
Phone: +46 40 665 8414
E-mail: Kristina.Hellen-Halme@mah.se
ABSTRACT
Objectives: Efforts are made in radiographic examinations to obtain the best image quality with the lowest possible
absorbed dose to the patient. In dental radiography, the absorbed dose to patients is very low, but exposures are relatively frequent. It has been suggested that frequent low-dose exposures can pose a risk for development of future cancer. It has previously been reported that there was no significant difference in the diagnostic accuracy of approximal carious lesions in radiographs obtained using tube voltages of 60 and 70 kV. The aim of this study was, therefore, to evaluate the patient dose resulting from exposures at these tube voltages to obtain intraoral bitewing radiographs.
Material and Methods: The absorbed dose distributions resulting from two bitewing exposures were measured at
tube voltages of 60 and 70 kV using Gafchromic® film and an anatomical head phantom. The dose was measured in the occlusal plane, and ± 50 mm cranially and caudally to evaluate the amount of scattered radiation. The same entrance dose to the phantom was used. The absorbed dose was expressed as the ratio of the maximal doses, the mean doses and the integral doses at tube voltages of 70 and 60 kV.
Results: The patient receives approximately 40 - 50% higher (mean and integral) absorbed dose when a tube
voltage of 70 kV is used.
Conclusions: The results of this study clearly indicate that 60 kV should be used for dental intraoral radiographic
examinations for approximal caries detection.
Keywords: dental radiography, dental digital radiography, bitewing radiography, radiation dosage, radiographic image enhancement.
Accepted for publication: 7 July 2013 To cite this article:
Hellén-Halme K, Nilsson M. The Effects on Absorbed Dose Distribution in Intraoral X-ray Imaging When Using Tube Voltages of 60 and 70 kV for Bitewing Imaging.
URL: http://www.ejomr.org/JOMR/archives/2013/3/e2/v4n3e2ht.pdf
INTRODUCTION
The purpose of all radiographic examinations is to provide reliable diagnostic information allowing rapid and suitable treatment of the patient. These examinations must be performed with great care to ensure sufficient image quality while exposing the patient to the lowest dose possible. In order to increase the sensitivity and specificity of a particular diagnostic method, every link in the diagnostic chain must be optimized and evaluated for the specific task at hand. Many studies have been performed in dental digital radiography to evaluate digital detectors [1-5], monitors [6-8], viewing conditions [7,9,10] and tube voltage [11-14].
The effect of tube voltage on radiographic image quality and diagnostic accuracy for dental carious lesions has been investigated by several authors. Svenson et al. [12] concluded that an optimal balance was obtained between the absorbed dose to the patient and diagnostic accuracy with an analogue film technique using a tube voltage of 60 kV. In a later study using a digital sensor technique [13] no significant difference was found in the diagnostic accuracy of approximal carious lesions when using tube voltages of 60 kV and 70 kV. In another previous study by Vandenberge and Jacobs [15] it was concluded that 63 kV and 70 kV provided a similar diagnostic accuracy and image quality for periodontal disease. The main opinion among vendors and many users is that digital sensors often perform with a higher subjective image quality at a higher tube voltage, although no studies could be found supporting this belief.
Optimization of any radiological procedure is a matter of obtaining adequate image quality at the lowest possible absorbed dose to the patient. In general dental practice radiographs are often taken every time the patient attends the clinic. Carious lesions are small, faint objects in the X-ray image, superimposed on a background of anatomical structures, which may impede detection. The dose administered by standard dental X-ray units can be adjusted by changing the exposure time or the tube voltage.
Self-developing Gafchromic® film (XR-QA2, International Specialty Products, Wayne, NJ, USA) has been used previously to measure absorbed dose and its distribution in phantoms simulating the clinical situation [16-18]. This offers a simple and accurate way of mapping the dose distributions from radiographic examinations. In a recent study [19] some support was found of the hypothesis that exposure to dental X-rays, particularly multiple exposures, may be associated with an increased risk of thyroid cancer. Since it has been shown that reducing the voltage from 70 kV to 60 kV
does not reduce image quality, we have investigated the effect of voltage reduction on the absorbed dose to the patient at these two voltages.
MATERIAL AND METHODS
Self-developing Gafchromic® film (XR-QA2, International Specialty Products, Wayne, NJ, USA) was used to measure the absorbed dose and its distribution in phantoms simulating the clinical situation. This film has a sensitive layer containing a crystalline diacetylene monomer which polymerises and, as a result, darkens when irradiated. This provides a simple and accurate way of mapping the dose distributions from radiographic examinations. The response of Gafchromic film is not linear to the absorbed dose [20]. The response curve of the film was obtained by irradiating the film with X-rays when it was placed adjacent to a calibrated ionisation chamber (Radcal 10X6-6, Radcal Corporation, Monrovia, CA, USA) which measured the absorbed dose to the film. The film, in which different sections were irradiated with different absorbed doses, was digitalized using a high-quality flat-bed scanner (Epson Perfection 4990, Seiko Epson Corporation, Nagano, Japan). The results were used to obtain a polynomial calibration curve which was then used to calculate the actual absorbed dose distributions in the films irradiated in the phantom. Response curves were also obtained for 60 and 120 kV, respectively, and were found to be identical to that for 70 kV. Therefore, the same response curve could be used for the experiments with 60 and 70 kV, respectively.
As the output from a dental intraoral X-ray unit is very low and the Gafchromic film has low sensitivity, a standard X-ray tube for medical radiology (A-196, Varian Medical Systems, Inc., Salt Lake City, UT, USA) with a standard collimating device (Svendx SX100-MF, Santax Medico A/S, Aarhus, Denmark) was - for practical reasons - used to irradiate the film in the head phantom. The output from a medical radiology X-ray tube is 50 - 100 times higher than that from an intraoral X-ray tube. This means that the experiments could be carried out using a few exposures with the medical unit instead of having to make more than 500 exposures with the intraoral unit. The radiation field produced by the medical X-ray unit was compared (uniformity, penumbra regions axial and transverse) with that of a standard intraoral dental unit (Planmeca Intra, Planmeca Oy, Helsinki, Finland). For that purpose, two pieces of Gafchromic film were irradiated with identical field size and focal distance. The filtration of the beam from the standard X-ray tube was adjusted so that the half-value layer was the same as for the intraoral unit.
The basis for comparison of the two X-ray tube voltages was that the signal-to noise ratio in the images was the same. The ratio was measured in images produced in a geometry used in a previous study [10] simulating the clinical case with extracted teeth mounted in PRESIDENT putty (Coltène Whaledent AG, Cuyahoga Falls, Ohio, USA). In order to obtain the same signal-to-noise ratio, the exposure time for 70 kV had to be reduced with 20%. This reduction also resulted in an approximately equal entrance skin dose for 60 and 70 kV, respectively.
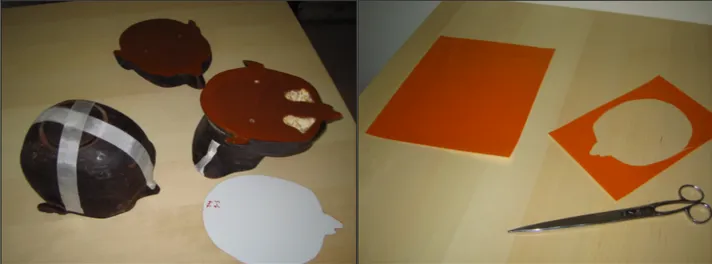
To simulate a dental patient, the head of an anatomical phantom (Rando/RAN100, The Phantom Laboratory, Salem, NY, USA) was used. The Rando head phantom consists of natural bone, full dentition and a soft plastic simulating tissue, and is well suited and frequently used in dosimetry studies. The Gafchromic film was cut with a pair of scissors to fit between the slices of the anatomical phantom (Figure 1). The anatomical phantom was irradiated corresponding to two bitewing exposures. This was done by using the same entrance angle for the X-ray field as for normal intraoral units. The dose distributions were measured in the occlusal plane, and ± 50 mm cranially and caudally to evaluate the primary and scattered dose distributions, respectively. Following irradiation the films were digitized in the scanner and read into an image processing program (ImageJ, NIH, Bethesda, MD, USA). The measured pixel values were converted to absorbed dose using the polynomial calibration curve. The dose distributions were recalculated in order to correspond to exposure of the patient from two standard bitewing images.
The sensor used when obtaining a radiographic image in a patient is in itself an efficient beam stopper. When placed intraorally, the absorbed dose behind the sensor is drastically reduced. However, an intraoral digital sensor could not be placed inside the phantom. Therefore, the attenuation of two types of sensors:
Planmeca DIXI2 (Planmeca Oy, Helsinki, Finland) and a CDR wireless sensor (Schick Technologies, Inc., Long Island City, NY, USA) was measured at 60 and 70 kV with an ionization chamber (Radcal 10X6-6, Radcal Corporation, Monrovia, CA, USA) with 4 cm of plexiglass in front of the sensor in order to produce a similar amount of scatter as in the clinical case. Both sensors are scintillation detectors using CsI (Tl).The dose distributions behind the position where the sensor would have been placed in the mouth were corrected for sensor attenuation by scaling the dose values in the region affected by attenuation of the sensor.
RESULTS
The radiation field of the standard X-ray tube used was found to have properties very similar to those of the dental X-ray unit, as can be seen in Figure 2, where dose profiles along the main axes of the radiation field are shown. The use of the standard X-ray unit was therefore considered representative of the clinical situation. The transmission of the DIXI2 intraoral sensor is 4.4% for a tube current of 60 kV and 4.6% for 70 kV. The corresponding values for the Schick CDR sensor were 2.4% and 2.7%. The lower values for the Schick sensor are explained by the fact that this sensor is wireless, and is powered by a small battery which increases its attenuation. The dose distributions in the Gafchromic film for the two different tube voltages are shown in Figure 3, while Figure 4 shows the dose distributions as isodose curves for the same entrance dose at tube voltages of 60 and 70 kV. It should be noted that the absorbed dose outside of the primary radiation field, i.e. in the cranial and caudal sections, is only a few percent of that inside the primary field. The effect of using sensors in the clinical situation on
Figure 4. Dose distributions represented as isodose lines. The values given on the
right are absorbed doses in mGy for exposures of 0.12 s at 60 kV and 0.1 s at 70 kV: A = cranial level, B = occlusal level, C = caudal level.
Figure 3. Gafchromic® film after exposure in the
phantom at 60 kV and 70 kV: A = cranial level, B = occlusal level, C = caudal level.
Figure 2. Signal profiles along the minor and major axes for the standard X-ray unit used in this study and for a conventional dental X-ray
unit, showing the similarity between them.
Dental unit Standard unit
Minor axis
Major axis
Signal profiles - major axis Signal profiles - minor axis
0 200 400 600 0 200 400 600 210 200 190 180 170 160 150 210 200 190 180 170 160 150
Relative film blackening
Relative film blackening Position
Position 60 kV 70 kV
A
B
C
60 kV 70 kV 5 4 3 2 1 Absorbed dose ( mGy) Absorbed dose ( mGy) Absorbed dose ( mGy) 175 150 100 50 25 10 5 5 4 3 2 1A
B
C
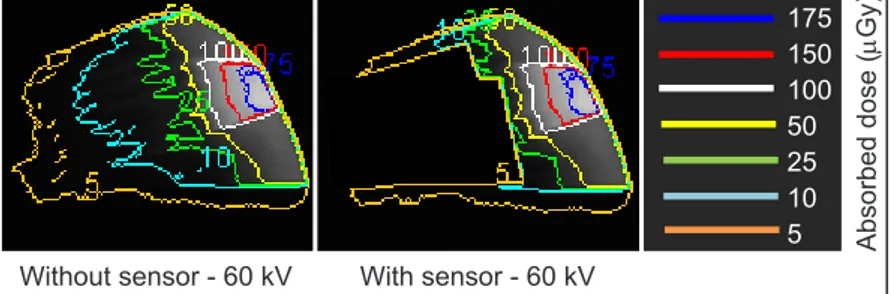
the dose distributions is illustrated in Figure 5. The lack of scatter caused by the presence of the sensor can be estimated by integrating the dose distribution that would have been shadowed by the sensor in relation to the total integrated absorbed dose within the primary beam. Table 1 gives the absorbed dose expressed as the ratio of the maximal, mean and integral doses resulting from exposure using tube voltages of 70 and 60 kV for the same entrance dose.
DISCUSSION
The purpose of this study was to evaluate how tube voltage affected the absorbed dose within the primary radiation field, and outside the primary radiation field
Figure 5. The values of absorbed dose at the occlusal level without a sensor and
the simulated levels with a sensor in place.
Without sensor - 60 kV With sensor - 60 kV Absorbed dose (
mGy) 175 150 100 50 25 10 5
Table 1. Ratios of the absorbed doses (mGy) resulting from exposure using tube
voltages of 70 kV and 60 kV
Layer Maximal dose Mean dose Integral dose
50 mm cranially 2.46 1.4 1.4
Occlusal 0.99 1.5 1.49
50 mm caudally 2.49 1.43 1.4
due to scattered radiation. The major principles when undertaking any radiological procedure are justification and optimisation. Optimisation means that the absorbed dose to the patient is kept as low as reasonably achievable while the diagnostic value of the procedure is maintained. It can be argued that the absorbed dose, and hence the effective dose, are very low for a dental intraoral exposure. On the other hand, the number of intraoral X-ray examinations performed is relatively high, and is the most common X-ray procedure in the Western world. Despite the low individual dose, the effects on the population as a whole cannot be neglected. In a recent publication, the risk of thyroid cancer as a result of dental X-ray examinations was extensively discussed, and it was concluded that dose optimization in dental radiography should be urgently addressed [19].
In intraoral imaging, only a few parameters that affect the absorbed dose to the patient can be altered. Given proper filtration and collimation, only the tube voltage and the exposure time can be adjusted to change the absorbed dose. When using digital detectors, it is the responsibility of the dentist to use a dose at which the quantum noise will not impair the diagnostic accuracy. Therefore, the parameter affecting the dose which should be studied in detail is the tube voltage. Today, the lowest tube voltage (kV) permitted and used in the Western world is 50 kV [21,22]. In Europe, there is an on-going discussion on increasing the lower limit to 60 kV [22]. In Sweden, the permitted tube voltage interval is 60 - 75 kV for general dental practitioners [23]. This study was based on a comparison of 60 and 70 kV, which are the two most common tube voltages used in Sweden.
Previous studies have been carried out to evaluate
different tube voltages in intraoral imaging. Svenson et al. [12] concluded that 60 kV was preferable when using analogue film. Kaeppler et al. [24] showed that increasing the tube voltage from 60 to 90 kV did not have any effect on either the local absorbed dose or the effective dose. They did not investigate how the image quality or the diagnostic accuracy was affected when the tube voltage was increased. In a study on a charge-coupled device (CCD) Kitagawa et al. [25] found that the estimated signal-to-noise ratio improved at a lower tube voltage. Results reported by Hayakawa et al. [26] showed that the low-contrast resolution of a CCD sensor decreased when the tube voltage was increased from 60 to 70 kV. In a previous study [10], we found no significant difference in the diagnostic accuracy for any approximal carious lesions when evaluating digital radiographs using tube voltages of 60 and 70 kV. Due to the higher photon energies using tube voltage of 70 kV, a larger fraction of the photons is scattered than at 60 kV. Additionally, the mean energy of the scattered photons generated at 70 kV is higher than those at 60 kV, and their range is thus longer. This should result in a higher absorbed dose outside the primary radiation field at 70 kV than at 60 kV. This is confirmed by the results of this study, and is illustrated in Figure 4. The low dose levels outside of the primary field should not be neglected, since the scattered radiation causing the dose will inevitably hit sensitive tissues as the brain, thyroid and salivary glands. Here, it is obvious that 70 kV will cause a significantly higher dose outside of the primary radiation field. It should also be noted that the dose distributions cranially and caudally of the occlusal plane were measured without a sensor blocking the primary photons (as it was not possible to insert a sensor inside the phantom). Since most of the scattered radiation
is produced in front of the sensor, due to the high intensity of photons in this area, the lack of a blocking sensor will have a small effect on the amount of scattered radiation. Since the sensor will block the beam to an extent that approximately 10% less scatter will be generated in the phantom, the measured dose outside of the primary field may be slightly overestimated. Furthermore, as most scattered radiation is produced in front of the sensor and has an angular distribution that is generally in the forward direction with respect to the primary beam, this overestimation is clearly below 10%.
Several studies [13-15] have shown that the accuracy and reliability of Gafchromic film for dose measurements are adequate. The results obtained in this study clearly confirm these previous findings. Furthermore, the film is extremely user friendly and makes it possible to measure absorbed dose distributions with an almost unsurpassed spatial resolution. Its only drawback is its low sensitivity which requires repeated exposures from X-ray units with low output.
The findings of this study show that the patient receives an approximately 40 - 50% higher absorbed dose (mean
value) when using a tube voltage of 70 kV.
Our results indicate that lowering the tube voltage from 70 to 60 kV will result in a lower dose to the patient without compromising image quality for evaluation of carious lesions. Further studies are needed to investigate if this also applies to other diagnostic tasks in bitewing imaging, i.e. periodontal bone levels.
CONCLUSIONS
The results of this study clearly indicate that 60 kV should be used for digital bitewing examinations for approximal caries detection.
ACKNOWLEDGEMENTS AND DISCLOSURE STATEMENTS
The authors declare that they have no conflict of interests.
REFERENCES
1. Kullendorff B, Nilsson M, Rohlin M. Diagnostic accuracy of direct digital dental radiography for the detection of periapical bone lesions: overall comparison between conventional and direct digital radiography. Oral Surg Oral Med Oral Pathol Oral Radiol Endod. 1996 Sep;82(3):344-50. [Medline: 8884837] [doi: 10.1016/S1079-2104(96)80364-7] 2. Kitagawa H, Scheetz JP, Farman AG. Comparison of complementary metal oxide semiconductor and charge-coupled
device intraoral X-ray detectors using subjective image quality. Dentomaxillofac Radiol. 2003 Nov;32(6):408-11. [Medline: 15070845] [doi: 10.1259/dmfr/19990417]
3. Paurazas SB, Geist JR, Pink FE, Hoen MM, Steiman HR. Comparison of diagnostic accuracy of digital imaging by using CCD and CMOS-APS sensors with E-speed film in the detection of periapical bony lesions. Oral Surg Oral Med Oral Pathol Oral Radiol Endod. 2000 Mar;89(3):356-62. [Medline: 10710463] [doi: 10.1016/S1079-2104(00)70102-8] 4. Wenzel A. Digital radiography and caries diagnosis. Dentomaxillofac Radiol. 1998 Jan;27(1):3-11. Review.
[Medline: 9482015] [doi: 10.1038/sj.dmfr.4600321]
5. Vandenberghe B, Bosmans H, Yang J, Jacobs R. A comprehensive in vitro study of image accuracy and quality for periodontal diagnosis. Part 2: the influence of intra-oral image receptor on periodontal measurements. Clin Oral Investig. 2011 Aug;15(4):551-62. Epub 2010 May 12. [Medline: 20461423] [doi: 10.1007/s00784-010-0417-7]
6. Hellén-Halme K, Nilsson M, Petersson A. Effect of monitors on approximal caries detection in digital radiographs--standard versus precalibrated DICOM part 14 displays: an in vitro study. Oral Surg Oral Med Oral Pathol Oral Radiol Endod 2009; 107: 716-20 [Medline: 19201219] [doi: 10.1016/j.tripleo.2008.12.011]
7. Hellén-Halme K, Petersson A, Warfvinge G, Nilsson M. Effect of ambient light and monitor brightness and contrast settings on the detection of approximal caries in digital radiographs: an in vitro study. Dentomaxillofac Radiol. 2008 Oct;37(7):380-4. [Medline: 18812599] [doi: 10.1259/dmfr/26038913]
8. Cederberg RA, Frederiksen NL, Benson BW, Shulman JD. Influence of the digital image display monitor on observer performance. Dentomaxillofac Radiol. 1999 Jul;28(4):203-7. [Medline: 10455382] [doi: 10.1038/sj.dmfr.4600441] 9. Cederberg RA, Frederiksen NL, Benson BW, Shulman JD. Effect of different background lighting conditions on
diagnostic performance of digital and film images. Dentomaxillofac Radiol. 1998 Sep;27(5):293-7. [Medline: 9879219] [doi: 10.1038/sj.dmfr.4600377
10. Wenzel A. A review of dentists’ use of digital radiography and caries diagnosis with digital systems. Dentomaxillofac Radiol. 2006 Sep;35(5):307-14. Review. [Medline: 16940477] [doi: 10.1259/dmfr/64693712]
11. Hellén-Halme K. Effect of two X-ray tube voltages on detection of approximal caries in digital radiographs. An in vitro study. Clin Oral Investig. 2011 Apr;15(2):209-13. Epub 2010 Feb 9. [Medline: 20143243] [doi: 10.1007/s00784-010-0383-0]
12. Svenson B, Gröndahl HG, Petersson A, Olving A. Accuracy of radiographic caries diagnosis at different kilovoltages and two film speeds. Swed Dent J. 1985;9(1):37-43. [Medline: 3859029]
13. Svenson B, Petersson A. Influence of tube voltage on radiographic diagnosis ofcaries in premolars and molars. Swed Dent J. 1991;15(5):245-50. [Medline: 1767370]
14. Vandenberghe B, Corpas L, Bosmans H, Yang J, Jacobs R. A comprehensive in vitro study of image accuracy and quality for periodontal diagnosis. Part 1: the influence of X-ray generator on periodontal measurements using conventional and digital receptors. Clin Oral Investig. 2011 Aug;15(4):537-49. Epub 2010 May 5. [Medline: 20443035] [doi: 10.1007/s00784-010-0416-8]
15. Vandenberghe B, Jacobs R. The Influence of Tube Potential on Periodontal Bone Level Measurements and Subjective Image Quality Using a Digital Photostimulable Storage Phosphor Sensor. J Oral Maxillofac Res 2010; 1: e5. URL: http://www.ejomr.org/JOMR/archives/2010/1/e5/e5ht.pdf
16. Oren U, Rääf CL, Mattsson S. Gafchromic film as a fast visual indicator of radiation exposure of first responders. Radiat Prot Dosimetry. 2012 Jun;150(1):119-23. Epub 2011 Sep 17. [Medline: 21926417] [doi: 10.1093/rpd/ncr374]
17. Abadi S, Mehrez H, Ursani A, Parker M, Paul N. Direct quantification of breast dose during coronary CT angiography and evaluation of dose reduction strategies. AJR Am J Roentgenol. 2011 Feb;196(2):W152-8. [Medline: 21257856] [doi: 10.2214/AJR.10.4626]
18. Eaton DJ, Duck S. Dosimetry measurements with an intra-operative x-ray device. Phys Med Biol. 2010 Jun 21;55(12):N359-69. Epub 2010 May 26. [Medline: 20505225] [doi: 10.1088/0031-9155/55/12/N02]
19. Memon A, Godward S, Williams D, Siddique I, Al-Saleh K. Dental x-rays and the risk of thyroid cancer: a case-control study. Acta Oncol. 2010 May;49(4):447-53. [Medline: 20397774] [doi: 10.3109/02841861003705778]
20. Watanabe Y, Patel GN, Patel P. Evaluation of a new self-developing instant film for imaging and dosimetry. Radiat Prot Dosimetry. 2006;120(1-4):121-4. Epub 2006 Apr 27. [Medline: 16644995] [doi: 10.1093/rpd/nci551]
21. Radiation protection in dentistry. NCRP report no 145. National Council on Radiation Protection and Measurements. Bethesda, MD, USA, 2003: European Commission on radiation protection (RP 91) URL: http://ec.europa.eu/energy/ nuclear/radiation_protection/doc/publication/091_en.pdf. Accessed 2011-11-15.
22. European Commission on radiation protection RP (162) URL: http://ec.europa.eu/energy/nuclear/radiation_protection/ consultations/doc/rp_91_update_2009_draft_for_consultation.pdf. Accessed 2012-07-20.
23. Swedish Radiation Safety Authority. URL: http://www.stralsakerhetsmyndigheten.se/In-English/About-the-Swedish-Radiation-Safety-Authority1. Accessed 2012-07-20.
24. Kaeppler G, Dietz K, Herz K, Reinert S. Factors influencing the absorbed dose in intraoral radiography. Dentomaxillofac Radiol. 2007 Dec;36(8):506-13. [Medline: 18033949] [doi: 10.1259/dmfr/32903218]
25. Kitagawa H, Farman AG. Effect of beam energy and filtration on the signal-to-noise ratio of the Dexis intraoral X-ray detector. Dentomaxillofac Radiol. 2004 Jan;33(1):21-4. [Medline: 15140818] [doi: 10.1259/dmfr/26493631]
26. Hayakawa Y, Farman AG, Scarfe WC, Kuroyanagi K, Rumack PM, Schick DB. Optimum exposure ranges for computed dental radiography. Dentomaxillofac Radiol. 1996 Apr;25(2):71-5. [Medline: 9446976]
To cite this article:
Hellén-Halme K, Nilsson M. The Effects on Absorbed Dose Distribution in Intraoral X-ray Imaging When Using Tube Voltages of 60 and 70 kV for Bitewing Imaging.
J Oral Maxillofac Res 2013;4(3):e2
URL: http://www.ejomr.org/JOMR/archives/2013/3/e2/v4n3e2ht.pdf
doi: 10.5037/jomr.2013.4302
Copyright © Hellén-Halme K, Nilsson M. Published in the JOURNAL OF ORAL & MAXILLOFACIAL RESEARCH (http://www.ejomr.org), 1 October 2013.
This is an open-access article, first published in the JOURNAL OF ORAL & MAXILLOFACIAL RESEARCH, distributed under the terms of the Creative Commons Attribution-Noncommercial-No Derivative Works 3.0 Unported License, which permits unrestricted non-commercial use, distribution, and reproduction in any medium, provided the original work and is properly cited. The copyright, license information and link to the original publication on (http://www.ejomr.org) must be included.